Trade set-up_OFSS can give a breakout and rally 10% thereafter!The stock has been attempting to move beyond the INR4200 mark since September 2023 but its every attempt in past was met with some strong supply around the 4200-4250 zone preventing it from moving beyond.
In this ongoing tussle between the buyers and sellers in the past three months the stock made at least 3 attempts to breakout above 4200 and the very same 3 attempts of the stocks are now clearly visible on the chart as an "Inverted Head &shoulders" pattern.
The neckline of the pattern stands at the same old supply zone of 4200-4250.
On decisive close above the 4200 mark and also upon breaking out from the inverted H&S pattern the stock can rally nearly 10% towards the INR 4600 region.
CMP - 4166
SL - 4078(2.4%)
TARGET - 4600(10%)
RR - 1:4
Indianstocks

#HPPSTMNDS - Happiest Minds Techno Ltd ready for take off!#HPPSTMNDS
IT sector resurgence has started I think and some of the IT companies are looking nice.
One such stock is Happiest Minds Techno Ltd which I think is close to a nice breakout!
Keep an eye, as confirmed breakout can lead to 25-50% move in coming weeks/ months.

TRADE SETUP_INFOSYS_ The "BALL" is in Buyer's areaThe "Ball" as you can see in the above chart is clearly on the buyers half of the ground.
The real question is how hard are they going to kick it to the upside? Or are they not going to kick this time around?
Well i believe this could be a "10-13%" kick(which is pretty hard).
CMP 1391
support zone 1370-1380
SL 1350
Target 1550
Note*- Please do your own research/analysis before taking up any financial positions.

Bharat Heavy BHEL is expected to target 229 after crossing 185Daily chart,
BHEL has accelerated upwards and is probably on a parabolic pattern.
The last candlestick is a Shooting Star, which usually indicates reversal movement. But, it needs a next candle confirmation; Open Price below 180.25 -
The down target will be the support line (RED), 170 or 165 (2 Fibonacci levels - Uncertain!!)
Next movement should be a rebounding to the resistance line (BLUE). After crossing up, the target will be 229.9 (flag pattern)
Stop loss below the support line to be considered.

SWING IDEA - BALRAMPUR CHINIBALRAMPURCHINI seems to be in a very crucial buying zone.
The reasons are listed below :
Stock price tested 411 levels multiple times and finally broke it and it is retesting those levels
again.
Broke the ascending triangle pattern i.e a bullish sign.
200EMA support on daily timeframe.
Stock was in a consolidation phase from last 1.5 years.
Higher high are being formed.
Support formed at 411 levels which was a strong resistance previously.
Target - 462 // 520
SL - 406 on closing basis

SWING IDEA - MEDPLUS HEALTHStock seems to be in a very good buying and could potentially witness an upside rally.
Reasons are stated below :
750-780 is a very strong support zone.
Doji candle formed on daily timeframe.
200EMA support on daily timeframe.
50EMA support on daily timeframe.
Stock is in an uptrend.
Higher-high formation.
TARGET : 848 // 911 // 975 // 1130 // 1342
SL : DAILY CANDLE CLOSE BELOW 750

NSE:PARAG Parag milk - time to milk 🥛Time to milk? 🥛 #paragmilk NSE:PARAGMILK
Disc: Invested , first trance with tight stoploss
#investing #trading #pwinvest

LIC India goes into a 'Wave 3' impulseThe largest insurer in India showed a massive volume and price gain on Friday's trading session bringing itself into some spot light.
The stock was in a corrective triple three structure from the start of Sep. until Nov 13 when it completed the correction with a truncated 'wave 'z''.
In a matter of only 7 trading days after having completed the correction, the stock is up 12% from bottom 'z'.
While Friday's move might make it look like the stock has over-shot a bit but in totality of things the 'wave 3' is not even half-way from its target. INR 780-790 zone is the projected wave 3 target.
It makes sense to accumulate this stock between INR 655-685 levels before it jumps above the INR 700 mark.
CMP 677
Support zone 655-660
Target 780
Note*- Please do thorough analysis of any financial instrument before you trade/invest in it. The views expressed here are my personal opinions and not an advice to buy/sell.

Trade Setup_10% upside in GMRINFRAThe stock gave a successful breakout from a falling trendline and managed to close above important resistance level of INR 60.
The stock slid 21% in 2months between Oct-Nov. on back of contracting volume which in fact should be seen as a bullish sign.
The Friday low of 57 is crucial support for the stock now and can also be used as a SL.
The stock should now attempt to rally towards its Oct. high of INR 66.75(10% from CMP).
CMP 60.35
SL 57
TARGET 66
NOTE*- Please take any trading/investing decision only after doing a thorough research in any financial instrument.

Multi-Breakouts seen on RallisThe stock was seen breaking out of a cup and handle pattern as well a year old trendline resistance on Tuesday's session.
The vol on breakout was satisfactory providing validation to the breakout.
The cup &handle breakout target is projected to be around INR310-320 zone(25% from CMP).
On the downside INR 235 can be used an a 'Sl'.
CMP 257
SL 235
Target 315

ADANI Total Gas Ltd looks ultra bullish!ATGL looks ultra bullish and can be a multi-bagger in the long-run.
After a pro-longed downfall, stock has shown some strength in past few days based on technicals + fundamental indicators.
In the chart as well, from technical point of view, there are too many inefficiencies left behind while stock was taking a hit and price was falling. In my opinion, all those inefficiencies should be filled in long-run.

Time to hunt down the ICICIBANK bears!!The stock broke out above an active supply/demand zone of INR 900-920 in April 2023.This particular zone has been an active supply/demand zone for the stock since Sep.2022.
2 attempts by the stock to go past INR 1000 mark were reversed by the sellers in July and Sep. this year.
Now for the past 3-weeks the stock has been making an accumulating range right at the zone of 900-920 and now has picked up some pace.(REMEMBER-ACCUMULATION RANGE AT SUPPORT AND DISTRIBUTION RANGE AT RESISTANCE OFTEN LEAD TO POWERFUL UP/DOWN MOVES RESPECTIVELY).
INR 950 is the minor resistance zone and the stock should not have much trouble taking it down first, before heading forward to face the bigger resistance of INR 1000(which too shall be hopefully taken down this time around).
TIME'S UP FOR THE BEARS!!
NOTE*- This post is for educational purpose. Please analyze/research thoroughly about any instrument in which you want to trade/invest.

Gujarat Raffia Industries _a breakout on cards and 90% upside!It was noticed that the stock has been in an bottoming and accumulation phase for more than 2 years starting Aug 2021 till date.
During this 2 year phase the stock attempted to go beyond the INR 40 mark but the same proved to be a strong supply/resistance zone for the stock preventing it from going higher(though few spikes/tails managed to pierce it a few times).
On the downside however, INR 27-30 kept providing a very strong demand zone/support for the stock(though a few tails pierced it on one of the occasions) and was probably used to accumulate this stock by interested parties during this phase.
The stock gave a falling trend line breakout last week with growing volumes and has greater chances this time around of breaking-through the INR 40 wall that it could not break-down in past 2 years.
There is little to no resistance for the stock once it closes(weekly) above INR 40.INR70-80 seem to be the only resistance on the chart which from current price are almost 90% upside.
INR 33 can be used a 'SL' for this stock to enter around INR37-40 zone for a potential target of INR70-75.
NOTE*-The views expressed are based on personal opinions/observations. Please do your own analysis of any company in which you wish to invest/trade.

#EEM Emerging markets poised for a breakup ?While not a perfect construction this does look like an inverse Head and Shoulders. A break above the neckline resistance at 39.85 should see this poised to move to 42.00 and then the target of 43.30 which is almost 9% higher. Note price has been consolidating above the 200dma now for 13 days which is quite significant and i think the probability favour an upside breakout.

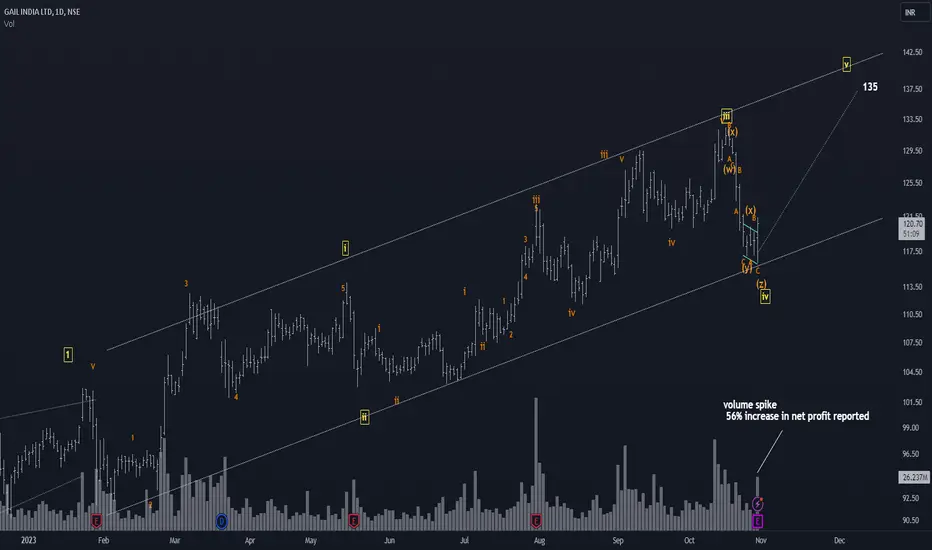
Trade Setup_10% move in GAILThe company just announced an increase in Net Profit by 56% as to beat all market expectations.
The wave V of 3 should get triggered with this news flow and the stock has shown a massive volume spike in past half hour.
sl 116.8
target 135
Muthoot : Riding high Target 2500Highest EPS Sept Quarter of 26.4 from Rs 24.2
Riding high the Credit Boom for NBFC's.
technicals:
1. 45% Trendline
2. 50/100/200 DMA support at current levels ( divine intervention)
3. Momentum INdicators Oversold.

CDSL ready for another run?After a good impulse movement on the upside, CDSL price corrected for a few trading sessions. It has now given a breakout above the resistance level with the support of increasing volume. DMI also shows potential strength in the upside momentum. From here we can see another good run in CDSL in the short-term
Buy Entry - 1910
Stop Loss - 1770
Target - 2550/1680

Pennar Industries #PENIND - Looking good for more upsideGood buying opportunity at CMP: ₹120.55 in my opinion.
Retesting the range.
Expecting another 25-30% move in coming days.

A possibility of a 100% move in Confidence Petroleum India Ltd.The stock is in a ascending triangle setup on weekly timeframe.
The 90-95 zone has been providing some resistance for the stock since 2021 and preventing it from launching above the INR 100 mark. But this 90-95 supply zone is now getting weaker since the constant rising demand for this stock wont let it dip below its previous lows every time and it is thus creating a beautiful upwards rising support zone.
The triangle breakout(when it happens), suggests an upward target of around INR180 for this stock.
Volume too has picked up this week. It should not take very long now for the breakout to play out.
On the downside 80-85 is good support area for the stock.
Note*- The views expressed are personal opinions/observations. Please study technicals &fundamentals of a stock thoroughly before taking any financial decisions.

ACC can rally 25% from CMPThe Cement company is completing a zig zag correction(ABC or 5-3-5) to an impulse wave it had shown in Mar.2023.
This impulse can either be considered as beginning of a new bull market and hence be considered as wave 1 or if it is to be considered as a corrective wave it can be marked as wave 'A'.
That does not change the fact that a 5-wave impulse is always followed up by another 5-wave advance. In this case we may call it wave 2 or wave "Wave B".This wave is projected going towards 2300-2400 zone(25% from CMP).
On the downside 1800 is good support for the stock which has now also approached the channel support.
Note*- Views expressed are personal opinions/observations. Please do your own research before taking up any trade.

How to locate Supply/Demand Zones?_Rupa_casestudyA very good morning to all.
The purpose behind publishing this chart is not primarily to talk about "Rupa and Co.".
The primary motive is to share the right approach to analyze any chart.
What do you look for when you look at a chart at first?
I have tried to put in a numerous things that i try to spot when i see a chart.
Now to talk about this particular chart of "Rupa and co.", the stock currently is very close to a major demand zone(both horizontal support and upward rising support). It is bouncing off the upward rising demand zone almost every time it approaches it. It now also has formed a 'double bottom' along the upward rising demand zone.
INR 220-240 is also a important horizontal support area. The upward running demand zone also currently shows support at INR 240. And is it random then that the most recent bounce that the stock witnessed came from INR 240zone??
What to make of this information? It tells us that the stock is currently going through the accumulation phase and 240-270 is a good price range to accumulate it. In the future when more demand for the stock kicks in it will accelerate firstly towards the INR 400 mark and then if it breaches that, then towards INR 550 mark. Both INR 400 zone and INR 550 were past supply/demand zones(support/resistance if you want to call them that) and hence one can again expect some slowdown around these crucial zones. In case of successfully breaching the INR 550 level the stock will dash towards INR 750-800.
I am sure i missed to talk about a lot of other things but i have tried to mark them onto the chart for easy visual grasp.
One can for sure make use of various other technical indicators available to confirm the views or even plan better entries. I prefer the raw price and volume data over anything else as it is the fastest moving and most reliable thing you will see plotted on a chart.
Note*- This post is for educational purpose only.

Break-out on cards and 18% rally for PRISM JOHNSON?There are three bullish confluences that you can see on this chart.
1.According to Elliot wave model the stock is taking off in wave III of 3.
2. A probable cup and handle breakout attempt.(target for this pattern comes in at around 200 Rs.)
3. Breakout attempt from imp 6 years old(2018-2023) horizontal resistance zone (145-150(Rs.))
The stock can give a swift move once it decisively closes above 150 mark.
Note*- This is not a buy/sell recommendation. This post is for educational purpose only.

The IGL stock is at good entry point currently.A picture says a thousand words. Well, I have have tried to depict everything i need to say about this stock onto the chart.
To summarize it, we are currently near 61.8% retracement of the impulsive wave we saw in the stock between Mar.2022 till May 2023.A new impulse wave from here (wave 3) is expected to begin that should take the stock towards the 600 mark in the near future.
Note*- this chart is for educational purpose only.
