Eicher motors Fib retracement ❗Eicher motors Fibonacci retracement
◽ Taking support at 2730 price which is Fibonacci 50% level
◽If it breakdown the level then we can short it
◽Weak sales data can also effect
Indianstocks

ZEE Breakout and Medium Term InvestmentThe stock has broken out and retested, so it may undergo a rally. Trade is supported by brokerage calls and Supports Nearby.
Risk Reward Ratio - 3:1
SL is placed below support zone & the previously upper trendline. The target is placed based on fundamentals and near swing high.

BANKNIFTY Short ❗❗Hi traders 😊...................
🛑 Shorting strikes purely based on India vix volatility index
🛑 India vix volatility index short strangle strike's
🛑India Vix closed at 17.21 which is fall by 6.47% on friday which show's that Friday market is in range bound and
🛑If we calculate India vix for day volatility or expected swing in both side for next day the we will get
( Caution it doesn't include any sentiment ie . Global or economical or news)
◽ Indian Vix volatility index works best in range bound market and helps option sellers
◽ Now clearly we get strike from india vix volatility index to short ie .37600 on CALL side
◽ Another one in downside we get one strike ie . 36900 on PUT side ( these levels were exact support and resistance in option chain and also in chart analysis you can checkout mine market analysis fro Monday )
◽we can clearly observe that market maybe trade between this range so I will going to do this
Short strangle means selling OTM strikes of PE And CE
🛑 short CALL
➡️ Sell 37600 CE with stop loss of 37650 (simply exist from position CE after breakout of 37650 )
◽ Target will be 36800
🛑 Short PUT
➡️. Sell 36900 PE with the Stoploss of 36900 (or in other words : exist from PUT position if breakdown of 36900 which crucial support zone )
◽ Target will be 37800
➡️ If sold both strikes (or if you do short strangle)
Key important you must have to follow
◽ Exist from one position if breakdown/breakout happens and keep it another side or another position until reach the target
◽ If breakout happens at (37650)exist from Position of CE or buy back CE or close CE selling position
Then keep short side PE to reach Target of 37800
◽ If breakdown happens (at 36900 ) then exist from Position PE or buyback PE or Close Position PE
Then keep it selling CALL (CE) until reach Target level 36800
🛑You can also short only side either CALL or P
PUT and follow respective Stoploss points
(Personally I will recommend Sell CALL or CE becaut fear market is higher )
🛑Make sure your capital is 1.6 L rupees to execute this strategy
🛑Any doubts regarding on this comment below I will definitely help you guy's
And if I'm wrong please let me know in comment section I will definitely correct my mistake
◽ Thanks for reading and do like it and follow for more and give reputation it will boost mine confidence
◽have nice day 😊

Nestle BreakoutThe stock has broken out and retested, so it may undergo a rally. Trade is supported by brokerage calls and Supports Nearby.
Risk Reward Ratio - 3:1
SL is placed below support zone & the previously upper trendline. The target is placed based on fundamentals and near swing high.

CEAT ReversalThe stock has reached lower trendline and may undergo a reversal rally. Trade is supported by brokerage calls and Supports Nearby.
Risk Reward Ratio - 2:1
SL is placed below support zone & the lower trendline. The target is placed near swing high.

NIFTY 50 Chart pattern ❗❗🛑 Nifty forming Flag pattern in daily frame
➡️ From aug to sep It rallied about 12%-13%
From 15900-17900
◽ This rally confirm that Other time frame players were present (OTF) Means big players were involved in this rally to take the market towards all time high
➡️ Now , it's corrected about 2%-3% from all time high
◽Means its saying that short term Bulls were exiting from Thier position or in other words weak players were exiting
◽Look like market is consolidating maybe this can continue for some days , as market is showing weakness so Bears can active and there is a chance they can short the market
◽ Stay light on your position and reduce your quantity until market close above 17950-18000 levels
I hope that it will help a lot ,
If you like it do follow
Have a nice day 😊

BANKNIFTY analysis for Monday ❗❗Hii Traders 😊 ,
Welcome to BANKNIFTY Futures and options analysis for friday
◽ Banknifty weekly pivot is at 37493
◽ And monthly pivot is at 37328 briefly explained below I hope that it will help you, do like ,share , follow for more ...
🛑 if we see day frame chart of BANKNIFTY currnetly trading above 50 Day , 100 Day moving averages
🛑 Taking support at 21Day MA and good thing is closed above the 21DMA
🎯 Key levels to watch out for day trader
🛑 Major resistance zone for BankNifty is at 37550-37650
◽ If market breakout resistance then we can see Target of 37900
◽ Whenever until breakout that resistance level don't trade
◽ Stop loss will be 37450
🛑 Major support level for BankNifty
◽ Support level for nifty lies at 36950-36850
◽ Whenever until breakdown this level don't take a trade
◽ if Market successfully breakdown this level then we can take a trade
◽ And we can see the Target 1 will be 36650
◽STOP loss will be 37050
◽ Market will be indecisive between 37700-36900
🛑 levels for banknifty futures will be also same
◽Go long on banknifty Futures if it breakout the resistance
◽ Don't short the market until below the 37000
Don't take a trade if market open above or below our levels bcz market don't like gaps let the market to consolidate first and then take a trade
🛑 TRADESHOTS
◽ Resistance level for CE buyers /option buyers is at 37550-37650
◽ support zone to buy PUT / PE is at 36850-37950
◽ BankNifty will be weaker below the 37300
◽ Banknifty weekly pivot is at 37493
◽And monthly pivot is at 37328
Thanks for reading 😊
I hope that it will help a lot and if I'm wrong kindly comment mine mistake surely I will correct it
If you like it do follow for more and give reputation which will boost mine confidence to do more.
have a nice day 😊

NIFTY 50 analysis for Monday ❗❗Hii Traders 😊 ,
Welcome to NIFTY 50 Futures and options analysis for intraday trading ......
🛑 Nifty will be stronger above 18000 zone which crucial resistance zone if failed to close above that zone then we can see some correction in market it may can test the 17000 levels This will be crucial for nifty to sustain above the level until then market will be weaker
🛑 Currently it is trading above ,50 Day, 100 Day moving averages
🛑 Taking support from 21Day moving average and good thing is closed above the moving average
🛑As I told in friday market analysis , 17600 will be crucial support zone for nifty but due to huge gap down market opened below the 17600 and it failed to closed above the level and for Monday market it will be crucial for market to close above the level for some movement
🎯 Key levels to watch out intraday levels for day trader
🛑 Major resistance zone for Nifty is at 17570-17600
◽ If market breakout resistance zone then we can see Target of 17700 as first target (if we see the Option chain data here 17700 CE holds more short position and next strike is 18000CE)
◽ Stop loss for this level is 17530
◽ Whenever until market below the 17570 market will be weaker and we can see more Shorts position in CALL and nifty futures as well
🛑 Major support level for Nifty 50
◽ Support level for nifty lies at 17440-17410
◽ If breakdown happens we can see the 1st Target of 17310
◽ stop loss ie .17500
🛑 levels for Nifty Futures will be as follows
◽ Go long on nifty Futures if it breakout the resistance 17570-17600 stay light with quantity
◽ Don't short the market until below the 17440-17410
◽In between range is indecisive don't go long or short anything can happen
🛑 Tradeshots
◽ Resistance level for CE buyers /option buyers is at 17570-17600
◽ support zone to buy PUT / PE is at 17440-17410
◽ Nifty will be weaker on intraday basis below the 17570
Thanks for reading,
If you like it do follow for more and give reputation which will boost mine confidence to do more.
have a nice day 😊

COAL INDIA Stock to watchout ❗❗❗🛑 Coal India stock formed an falling channel pattern in monthly Time frame
🛑 Trying to breakout the channel
🛑 Volume is good above the 100 Day moving average volume
◽Now stock is trading at nearly 2 year high
◽ Shortage of power in China will rise the demand in energy sector's of India
🛑Stock to watchout
🎯 Short-term Traget 220
Do like and follow for more , have a nice day 😊

Birla Soft Breakout RetestThe stock has broken out and retested, therefore may undergo a reversal rally. Trade is supported by brokerage calls and Supports Nearby.
Risk Reward Ratio - 2:1
SL is placed below support zone & the lower trendline. The target is placed near swing high.

Marico ReversalThe stock has reached lower trendline and may undergo a reversal rally. Trade is supported by brokerage calls and Supports Nearby.
Risk Reward Ratio - 3:1
SL is placed below support zone & the lower trendline. The target is placed near swing high.

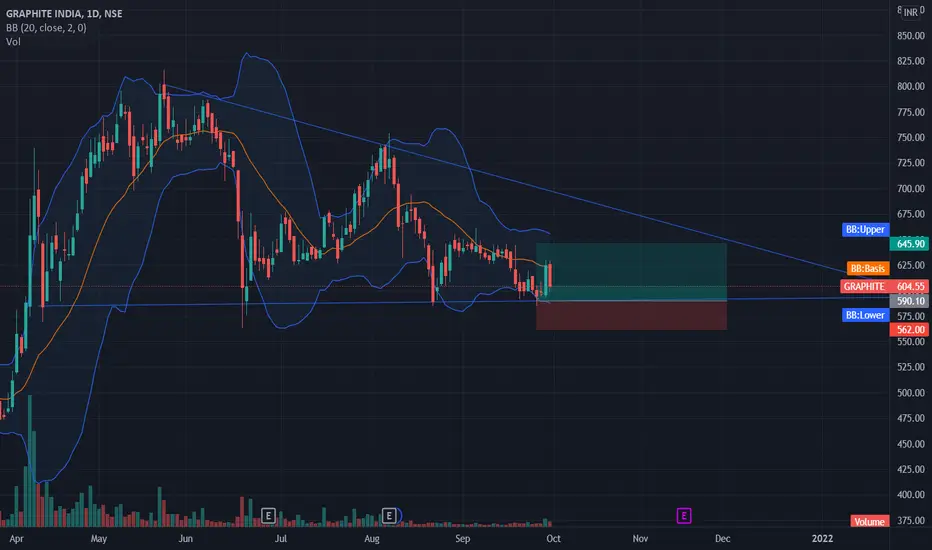
Graphite India ReversalThe stock has reached lower trendline and may undergo a reversal rally. Trade is supported by brokerage calls and Supports Nearby.
Risk Reward Ratio - 2:1
SL is placed below support zone & the lower trendline. The target is placed near swing high.
Credit Access Grameen ReversalThe stock has reached lower trendline and may undergo a reversal rally. Trade is supported by brokerage calls and Supports Nearby.
Risk Reward Ratio - 2:1
SL is placed below support zone & the lower trendline. The target is placed near swing high.

BANKNIFTY Channel pattern analysis ❗ 🛑 Banknifty forming Ascending parallel channel pattern in Day frame chart ......
🛑 Usually it forms during uptrend markets
🛑To formation of ascending channel an underlying security / stock must forms an Higher highs and lower lows
🛑 As we can see banknifty forming Higher highs and Higher lows
🛑 When we connected those higher highs and Higher lows we get an ascending channel
🛑What is higher high ❓
Well,
When an stock making new high than previous high is called higher high
For example , let's take an X company is trading at 11 Rs on 28th sep and Today X company Trading at 15 Rs this is called X company making Higher high
🛑What is Higher low ❓
Well,
When an stock get huge short and making low that Low price is not less than previous low.
In other words current low of an X company is high when compared to previous low
For example, let's take an X company which is trading at 9 Rs on 27th sep and made an high of 15 Rs yesterday today shorter's entered market they short X company's share now it is trading at 13 Rs
Means 13Rs low is higher than 9Rs low this is called Higher low
🛑What does Ascending parallel channel actually represents ❓
Well, when an stock or an index makes an new high and its short term correction is higher low ( means it does not go below the previous low )
In other words when buyers were aggressive take the market upwards making new high and they doesn't let market go below the previous low which means they were in the control and they were not letting sellers to control the market
🛑 Banknifty now may take support from 37250-37200 levels and it may be bounce back from the Trend line support
🛑If banknifty breakdown the Trend line support then we can expect Sideways market for some couple of days
I hope that it will help a lot
If like it do follow for more
Have a nice day 😊

BANKNIFTY Shorting strikes ❗❗Hi traders 😊...................
🛑 Shorting strikes purely based on India vix volatility index
🛑 India vix volatility index short strangle strike's
🛑India Vix closed at 18.4 . which means premiums were high on both the sides of options . India vix measures the expected volatility for next one year.
means Nifty can go up by +18.4% towards upside from today's close to next one year and other chance -18.4% can go down by next one year
🛑 If we calculate India vix for day volatility or expected swing in both side for next day the we will get
◽ Here banknifty can go upto max +360 points from previous close 37425
means it may can swing up to hardly 37800(not exactly add previous close ie .374253+ expected movement points ie . 360)
◽ Or can go down by -360 points from previous close 37425 and it may be swing down to 37000
( Caution it doesn't include any sentiment ie . Global or economical or news )
◽ Indian Vix volatility index works best in range bound market and helps option sellers
◽ Now clearly we get one strike from to short ie .37800 on CALL side
◽ Another one in downside we get one strike ie . 37000 on PUT side
◽we can clearly observe that market maybe trade between this range so I will going to do this
Short strangle means selling OTM strikes of PE And CE
◽ short CALL
➡️ Sell 37800 CE with stop loss of 37800 (simply exist from position CE after breakout of 37800 )
◽ Short PUT
➡️ Sell 37000 PE with the Stoploss of 37300 (or in other words : exist from PUT position if breakdown of 37300 which crucial support zone )
➡️ If sold both strikes (or if you do short strangle)
Key important you must have to follow
◽ Exist from one position if breakdown/breakout happens and keep it another side or another position until reach the target
◽ If breakout happens at (37800)exist from Position of CE or buy back CE or close CE selling position
Then keep short side PE to reach Target of 37950
◽ If breakdown happens (at 37300 ) then exist from Position PE or buyback PE or Close Position PE
Then keep it selling CALL (CE) until reach Target level 37000
🛑 You can also short only side either CALL or P
PUT and follow respective Stoploss points
(Personally I will recommend Sell CALL or CE becaut fear market is higher )
🛑 Make sure your capital is 1.6 L rupees to execute this strategy
🛑Any doubts regarding on this comment below I will definitely help you guy's
And if I'm wrong please let me know in comment section I will definitely correct my mistake
◽ Thanks for reading and do like it and follow for more and give reputation it will boost mine confidence
◽have nice day 😊

NIFTY 50 crucial zone for day trade ❗❗Hii Traders 😊
Welcome to NIFTY 50 Futures and options analysis for intraday trading ......
🛑 Nifty will be stronger above 18000 zone which crucial resistance zone if failed to close above that zone then we can see some correction in market it may can test the 17000 levels
🛑 Currently it is trading above all moving averages 21 Day ,50 Day, 100 Day
🛑It taken the support at 17600 I'm repeatedly saying that it is good support zone it taken support from here for the 3rd trading session and if it breakdown this level I'm sure Market will get short term correction
🛑Don't take position or don't go long on any stocks right now or stay light reduce your quantity and move from quantity to quality stocks
🎯 Key levels to watch out intraday levels for day trader
🛑 Major resistance zone for Nifty is at 17780-17740 where at this point nifty tried to breakout this level
◽ If market breakout resistance zone then we can see Target of 17860 as first target
◽ Stop loss for this level is 17700
◽markett will shown some weakness if it traded below 17700 on intraday basis
🛑 Major support level for Nifty 50
◽ Support level for nifty lies at 17600-17560 I'm repeatedly saying that this will be crucial support zone today also taken support from this level and bounce backed
◽ If breakdown happens we can see the 1st Target of 17430
◽2nd target will be 17320
◽ stop loss ie .17640
If market traded below this level I'm sure market will be weak on intraday basis
◽ For nifty their strong support at 17560-17600 if this zone is breakdown then we will enter into range bound market or short term correction ( consolidation) period for some days
🛑 levels for Nifty Futures will be as follows
◽ Go long on nifty Futures if it breakout the resistance 17710-17750 stay light with quantity
◽personal recommend Don't go long until breakout of 18000
◽ Don't short the market until below the 17600-17570
◽In between range is indecisive don't go long or short anything can happen
🛑 Tradeshots
◽ Resistance level for CE buyers /option buyers is at 17740-17780
◽ support zone to buy PUT / PE is at 17600-17570
◽ Nifty will be weaker on intraday basis below the 17700
(Yesterday also I told that market will be weaker below these levels and we can see that today piovot point control region as formed at 17700)
Thanks for reading,
If you like it do follow for more and give reputation which will boost mine confidence to do more.
have a nice day 😊

BANKNIFTY Shorting strikes for expirey Hi traders 😊
🛑 Banknifty short strangle strikes
🛑 Shorting strikes purely based on India vix volatility index
🛑India Vix closed at 18.84 with gaining of nearly 1.62% over the one day which means premiums were high on both the sides of options . India vix measures the expected volatility for next one year
means Nifty can go up by +18.81% towards upside from today's close to next one year and other chance -18.81% can go down by next one year
🛑 If we calculate India vix for day volatility or expected swing in both side for next day the we will get
◽ Here banknifty can go upto max +375 points from previous close 37743 means it may can swing up to hardly 38200 ( not exactly add previous close ie.37743 + expected movement points ie. 375 )
◽ Or can go down by -370 points from previous close 37743 and it may be swing down to 37300
( Caution it doesn't include any sentiment ie . Global or economical or news )
◽ Indian Vix volatility works best in range bound market and helps option sellers
◽ Now clearly we get one strike from to short ie .38200 in CALL side
◽ Another one in downside we get one strike ie . 37300 PUT side
◽we can clearly observe that market maybe trade between this range so I will going to do this
Short strangle means selling OTM strikes of PE And CE
◽ short CALL
➡️ Sell 38200 CE with stop loss of 38150 (simply exist from position after breakout of 38150 with is crucial resistance level I have discussed above it you can checkout by visiting mine profile)
◽ Short PUT
➡️ Sell 37300 PE with Stoploss of 37300 (or in other words : exist from PUT position if breakdown of 37300 which crucial support zone and it is pivot point control region. I have discussed above it clearly u can visit mine profile and Checkout)
➡️ If sold both strikes (or if do short strangle)
Key important you must have to follow
◽ Exist from one position if breakdown/breakout happens and keep it another side for until reach the target level
( if want to know Target level set visit mine profile and watchout BANKNIFTY analysis for expirey day I have clearly mentioned Target levels)
◽ If breakout happens at (38150)exist from Position of CE or buy back CE or close CE selling position
Then keep short side PE to reach Target of 38300 (I clearly explained about it visit mine profile)
◽ If breakdown happens (at 37300 ) then exist from Position PE or buyback PE or Close Position PE
Then keep it selling CALL (CE) until reach Target level 37000
🛑You can also short only side either CALL or PE and follow respective Stoploss points
(Personally I will recommend Sell CALL or CE becaut fear market is higher )
🛑Make sure your capital is 1.6 L rupees to execute this strategy
🛑Any doubts regarding on this comment below I will definitely help you guy's
And if I'm wrong please let me know in comment section I will definitely correct my mistake
◽ Thanks for reading and do like it and follow for more and give reputation it will boost mine confidence
◽have nice day 😊

NIFTY 50 levels for monthly expirey ❗Hii Traders 😊
Welcome to NIFTY 50 Futures and options analysis for intraday trading ......
🛑 Nifty will be stronger above 18000 zone which crucial resistance zone if failed to close above that zone then we can see some correction in market it may can test the 17000 levels
🛑 Currently it is trading above all moving averages 21 Day ,50 Day, 100 Day
🛑It taken the support at 17600 I'm repeatedly saying that it is good support zone it taken support and if it breakdown this level I'm sure Market will get short term correction
🛑 Don't take position or don't go long on any stocks right now or stay light reduce your quantity and move from quantity to quality stocks
🎯 Key levels to watch out intraday levels for day trader
🛑 Major resistance zone for Nifty is at 17770-17800 where at this point nifty tried to breakout this level
◽ If market breakout resistance zone then we can see Target of 19000 as first target
◽2nd target will be 18000
◽ Stop loss for this level is 17710
◽markett will shown some weakness if it traded below 17700 on intraday basis
🛑 Major support level for Nifty 50
◽ Support level for nifty lies at 17600-17560 I'm repeatedly saying that this will be crucial support zone today also taken support from this level and bounce backed
◽ If breakdown happens we can see the 1a
st Target of 17430
◽2nd target will be 17320
◽ stop loss ie .17660
If market traded below this level I'm sure market will be weak on intraday basis
◽ For nifty their strong support at 17560-17600 if this zone is breakdown then we will enter into range bound market or short term correction ( consolidation) period for some days
🛑 levels for Nifty Futures will be as follows
◽ Go long on nifty Futures if it breakout the resistance 17760-17800 stay light with quantity
◽personal recommend Don't go long until breakout of 18000
◽ Don't short the market until below the 17600-17580
◽In between range is indecisive don't go long or short anything can happen
🛑 Tradeshots
◽ Resistance level for CE buyers /option buyers is at 17760-17800
◽ support zone to buy PUT / PE is at 17600-17560
◽ Nifty will be weaker on intraday basis below the 17700
Thanks for reading 😊
I hope that it will help a lot and if I'm wrong kindly comment mine mistake surely I will correct it
If you like it do follow for more and give reputation which will boost mine confidence to do more.
have a nice day 😊

BANKNIFTY levels for 29th Wednesday ❗❗Hii Traders 😊
Welcome to BANKNIFTY Futures and options analysis for 29th Wednesday
🛑 if we see day frame chart of BANKNIFTY we can clearly observe that today's candel which is covered nearly last 3 trading session
🛑 Their was huge selling pressure but buyers were try to pull the things back
🛑 If we see the Day volatility is about 1.3% means which is high and not tradable or suitable volatility for retail traders and fluctuated points is about 1062
🎯 Key levels to watch out for day trader
🛑 Major resistance zone for BankNifty is at 38350-38400 where at this point BankNifty tried to breakout level and
◽ If market breakout resistance then we can see Target of 38550
◽ If banknifty traded above these levels I'm sure that more shorts were get covered in 37500 CE and 37600 CE strikes
◽ Whenever until breakout that resistance level don't trade
◽ Above 38150 will be momenum for buyers to control the market until then market will be weaker
◽ Stop loss will be 38150 if market traded below this level then banknifty will be weaker and might be fear can continue
🛑 Major support level for BankNifty
◽ Support level for nifty lies at 37300-37250
◽ Whenever until breakdown this level don't trade
◽Below the 37600 market will be weaker but it is indecisive
◽ if Market successfully breakdown this level then we can take a trade
◽ And we can see the Target 1 will be 37000
◽Target 2 will be 36850
◽ STOP loss will be 37400 where it acting as strong support and resistance
◽Use Target 1 as trailing Stoploss to achieve 2nd target I sure you will not gone loose money for market
🛑 levels for banknifty futures will be also same
◽Go long on banknifty Futures if it breakout the resistance
◽ Don't short the market until below the 37600
◽Go short below the support level 37300
🛑 TRADESHOTS
◽ Resistance level for CE buyers /option buyers is at 38350-38400
◽ support zone to buy PUT / PE is at 37300-37250
◽ BankNifty will be weaker on intraday basis below the 37600
Thanks for reading 😊
I hope that it will help a lot and if I'm wrong kindly comment mine mistake surely I will correct it
If you like it do follow for more and give reputation which will boost mine confidence to do more.
have a nice day 😊

BANKNIFTY strikes to sell based on India vix❗ ❗ Hi traders 😊
🛑 Banknifty short strangle strikes
🛑 Selling strikes purely based on India vix volatility index
🛑India Vix closed at 18. 54 with gaining of nearly 2.71% over the one day which means premiums were high on both the sides of options which is help for option sellers if market stays between this range as follows
🛑If we calculate India vix for day volatility or expected swing in both side for next day the we will get
◽ Here banknifty can go upto max +370 points from previous close 37945 means it may can swing up to hardly 38315 we can see in option chain their is more shorts position were holding by institutional traders
◽ Or can go down by -370 points from previous close 37945 and it may be swing down to 37575
( Caution it doesn't include any sentiment ie . Global or economical or news )
◽ Indian Vix volatility works best in range bound market and helps option sellers
◽ Now clearly we get one strike from to short ie .38300 in CALL side
◽ Another one in downside we get one strike ie . 37500 PUT side
◽we can clearly observe that market maybe trade between this range so I will going to do this
Short strangle means selling OTM strikes of PE And CE
◽ short CALL
➡️ Sell 38300 CE with stop loss of 38150 (simply exist from position after breakout of 38150 with is crucial resistance level I have discussed above it you can checkout by visiting mine profile)
◽ Short PUT
➡️ Sell 37500 PE with Stoploss of 37600 (or in other words : exist from PUT position if breakdown of 37600 which crucial support zone and it is pivot point control region. I have discussed above it clearly u can visit mine profile and Checkout)
➡️ If sold both strikes (or if do short strangle)
Key important you must have to follow
◽ Exist from one position if breakdown/breakout happens and keep it another side for until reach the target level
( if want to know Target level set visit mine profile and watchout BANKNIFTY analysis for expirey day I have clearly mentioned Target levels)
◽ If breakout happens at (38150)exist from Position of CE or buy back CE or close CE selling position
Then keep short side PE to reach Target of 38500 (I clearly explained about it visit mine profile)
◽ If breakdown happens (at 37600 ) then exist from Position PE or buyback PE or Close Position PE
Then keep it selling CALL (CE) until reach Target level 37300
🛑You can also short only side either CALL or PE and follow respective Stoploss points
(Personally I will recommend Sell CALL or CE becaut fear market is higher )
🛑Make sure your capital is 1.6 L rupees to execute this strategy
🛑Any doubts regarding on this comment below I will definitely help you guy's
And if I'm wrong please let me know in comment section I will definitely correct my mistake
◽ Thanks for reading and do like it and follow for more and give reputation it will boost mine confidence
◽have nice day 😊

SENSEX - Support and resistance
Reached extended price target. Neutral now but expecting selloff
Best,
Hard Forky

MOIL ReversalThe stock has reached lower trendline and may undergo a reversal rally. Trade is supported by brokerage calls and Supports Nearby.
Risk Reward Ratio - 2:1
SL is placed below support zone & the lower trendline. The target is placed based on fundamentals and near swing high.

Granules India ReversalThe stock has reached lower trendline and may undergo a reversal rally. Trade is supported by brokerage calls and Supports Nearby.
Risk Reward Ratio - 2:1
SL is placed below support zone & the lower trendline. The target is placed based on fundamentals and near all time high.
