SPY S&P 500 etf Oversold on the RSI ! 2025 Price Target ! The SPDR S&P 500 ETF Trust (SPY) is flashing a major buy signal, with its Relative Strength Index (RSI) currently sitting at 28.33 — firmly in oversold territory. Historically, every time SPY has entered oversold levels on the RSI, institutional buyers have stepped in aggressively, driving sharp rebounds in the following weeks and months.
The last time SPY dipped below the 30 RSI threshold was during market pullbacks in 2022 and 2023 — both of which were followed by significant rallies as institutions capitalized on discounted valuations. The current setup is no different. With earnings growth stabilizing, inflation cooling, and the Federal Reserve signaling a potential shift toward rate cuts in the second half of the year, the backdrop for a recovery is aligning perfectly.
Technically, SPY is also approaching key support levels that have held strong in past market corrections. The combination of an oversold RSI and strong institutional appetite at these levels creates a compelling case for a bounce.
My price target for SPY by year-end is $640, representing over 15% upside from current levels. With sentiment stretched to the downside and technical indicators flashing green, SPY looks primed for a sharp and sustained rebound. Now could be the perfect time to position for the next leg higher.
Indicators

DXY (U.S. Dollar Index) Bearish Outlook – Key Levels & PredictioDXY (U.S. Dollar Index) Analysis – Daily Chart
🔹 Recent Downtrend:
The DXY has been in a strong decline ⬇️ after breaking key support around 104.5 📉.
The price dropped sharply, showing bearish momentum 🚨.
🔹 Key Zones Identified:
Resistance Zone (104.0 – 105.0) ❌📊 (Previously support, now acting as resistance)
Support Zone (100.5 – 101.0) ✅📉 (Potential target for further downside)
🔹 Expected Price Movement:
A possible short-term bounce 🔄 back toward the 104.0 - 104.5 resistance ⚠️.
If rejected ❌, the downtrend may continue toward the 100.5 – 101.0 level 🎯📉.
🔎 Conclusion:
✅ Bearish Bias – Trend favors further downside unless the price reclaims 105.0.
📌 Watch for a retracement before another drop 📉.
📊 Key Levels:
Resistance: 104.0 – 105.0 🚧
Support: 100.5 – 101.0 🛑

BTC/USD Breakdown? Bearish Target at $70K!🔥
📉 Bitcoin Downtrend Alert! 🚨
📊 BTC/USD (4H Chart) - BITSTAMP
🔻 Bearish Structure!
📉 Lower highs & lower lows – trend is down!
📏 Descending trendline keeping price under pressure.
📌 Resistance Zone (~ FWB:83K - $85K)
🛑 Price struggling to break past strong supply area (purple box).
📉 Support Levels:
🟡 $77,500 🏗️ – Weak support? Possible break!
🔴 Target: $70,000 🎯 – Major support level ahead!
🛠️ Possible Price Action:
1️⃣ Retest resistance 🚀?
2️⃣ Rejection & drop to $77,500 ❌
3️⃣ Break below = CRASH to $70K 💥
⚠️ Warning: Bulls need to reclaim trendline for reversal! Otherwise, bears in control! 🐻💪
📢 Conclusion:
Trend = BEARISH! Until a breakout happens, shorting may be the best play! 🎯
🔥 What do you think? Bullish or Bearish? 🤔👇 #BTC #Crypto

XAUUSD 4H Analysis: Rejection at Resistance – Drop to $2,850?📉 XAUUSD (Gold) 4H Analysis – March 5, 2025
Key Levels:
Resistance: Around $2,920 - $2,940 (price is testing this zone)
Support: Around $2,850 - $2,860 (marked as a demand zone)
Market Structure & Projection:
Gold is currently at a resistance level, which has previously acted as a strong supply zone.
The price is showing signs of rejection at resistance, indicating a potential bearish move.
The chart suggests a drop towards the $2,850 support level if price fails to break above resistance.
Indicators & Confluence:
200 EMA (Red Line): Located below the price, showing an overall bullish trend, but short-term correction is possible.
Bearish Structure: The recent push to resistance followed by rejection hints at a potential sell-off.
Liquidity Grab? If price briefly spikes above resistance and then reverses, a deeper drop could be confirmed.
Trading Bias & Strategy:
📉 Bearish Scenario: If rejection at resistance holds, price could head towards $2,850 support.
📈 Bullish Breakout?: If price breaks & closes above resistance with strong volume, upside continuation could be possible.
⚠ Watch for price action at resistance before taking trades. A breakout or rejection confirmation is key.
🔥 What’s Your Take? Bullish or Bearish? Let me know! 🚀📊

XAU/USD 4H Analysis: Key Support, Resistance & Breakout TargetsKey Levels Identified:
Support Zone (~2,875-2,885) 🟣
This is a strong area where price previously bounced.
If price falls below this level, it could drop further toward the next support.
Resistance Zone (~2,915-2,925) 🟣
Price is currently consolidating around this level.
A breakout above resistance could push the price toward the target.
Target (~2,950) 🎯
If the price breaks above resistance, the next key level is around 2,950.
Potential Scenarios:
📈 Bullish Scenario:
If price breaks above resistance, expect an upward move toward the target (2,950).
Confirmation would come with strong volume and bullish candlestick patterns.
📉 Bearish Scenario:
If price fails to hold above support, a drop toward 2,825-2,835 is possible.
A strong bearish candle closing below support would confirm this move.
Current Trend:
The price has been moving in a sideways consolidation between support and resistance.
Watch for a breakout in either direction for the next big move.

AUD/USD at Critical Support – Breakout or Breakdown? 🔍 AUD/USD Daily Chart Analysis – March 9, 2025
Key Observations:
Ascending Channel 📈
The price is moving within an upward channel, indicating a short-term bullish trend.
Support & Resistance Zones 🟦🟥
Support: Around 0.6231 - 0.6200 (blue zone). A breakdown below this could push the price lower toward 0.6129 (orange zone).
Resistance: The 0.6460 - 0.6584 level is the next major hurdle for bulls.
200-Day Moving Average (Red Line) 🔴
The price is currently below the 200-MA, indicating a long-term bearish sentiment. However, a breakout above this level could signal a trend reversal.
Potential Scenarios 📊
✅ Bullish Case: If the price sustains above 0.6231, we could see a bounce towards 0.6460 - 0.6584 in the coming weeks.
❌ Bearish Case: A break below 0.6231 could push the price toward the 0.6129 - 0.6100 region before finding support.
Trade Plan 🎯
Buy Zone: Around 0.6231 with a stop-loss below 0.6200.
Sell Zone: If price rejects 0.6460, a short position could be considered with a stop above 0.6584.
📊 Conclusion: AUD/USD is at a key decision point. Bulls need to hold support for further upside. A breakdown could trigger a bearish move.

THE KOG REPORT THE KOG REPORT:
In last week’s KOG Report we said we would wait for the 2847-50 level to confirm support, and if it did the opportunity to long the market following KOG’s bias level targets would be available to traders. This worked well during the early part of the week as we managed to complete all targets by Tuesday! Once price confirmed encroaching the resistance we decided not to attempt the swing short, instead, trade the choppy range on the indicators which also worked well for traders.
Pre-NFP we released the KOG Report giving the idea to watch the support level 2910, if given the opportunity to long could be available into the higher levels on the boxes. Although we got the pinpoint long, the move did not complete after a 200pip+ capture, not a bad week at all, not only on Gold but all the other pairs we trade and analyse in Camelot hitting a phenomenal 32 Take profit levels.
Well done again to the community.
So, what can we expect in the week ahead?
It’s a difficult one to decipher this week with the previous weeks range holding into the close on Friday. We have support below at the 2895 with extension into 2885 and resistance at 2930-35 with extension into the 2945 region. We also have the range high and low which you can see on the chart with a slight incline! For that reason, we would suggest best practice for market open is to wait, wait for price to break out of the range with the key levels here being 2920 which needs to break upside to start the move into the 2935 level and above that 2950-55 which is where we may get that potential swing short opportunity from. Please note, here we need to see a daily close above the 2935 region to continue the move upside, ideally, we want to see tap and bounces from these higher levels.
On the flip, if we see resistance at that 2920 level and get a close below our red box support level 2907-10, we can consider the level to level short trades downside targeting the 2885 and potentially below that 2970-75 for now.
As above we'll keep it simple for now, we can’t magic up an idea and hope for the best, when price accumulates like this, we have a fair idea of what it can do, but we need that set up to pull the trigger. Until that comes we can we'll just simply play the range.
You can see from past KOG Reports how extremely powerful the red boxes we share for free are, they almost play price to perfection. So, lets stick with them and let Excalibur lead the way for this week.
KOG’s Bias for the week:
Bullish above 2898 with targets above 2920, 2934 and above that 2945
Bearish on break of 2898 with targets below 2895, 2880, 2874 and below that 2868
RED BOXES:
Break above 2916 for 2920, 2925, 2929, 2933 and 2941 in extension of the move
Break below 2900 for 2885, 2876, 2870 and 2868 in extension of the move
Please do support us by hitting the like button, leaving a comment, and giving us a follow. We’ve been doing this for a long time now providing traders with in-depth free analysis on Gold, so your likes and comments are very much appreciated.
As always, trade safe.
KOG

$AFRM $70-$80 target, cup and handle WEEKLY, pt. 2 chartYes, I used the brush and drew that juicy cup and handle. I don't know, friends, this one looks really good for setup to long. Part 1 was posted just before this give it a glance. The EMA and SMA used here was the 50 and in the previous chart was 200.
WSL

BRIEFING Week #10 : Dollar reversed, WTI may be nextHere's your weekly update ! Brought to you each weekend with years of track-record history..
Don't forget to hit the like/follow button if you feel like this post deserves it ;)
That's the best way to support me and help pushing this content to other users.
Kindly,
Phil

XAU/USD Weekly Outlook: Potential Pullback or Breakout?XAU/USD Weekly Chart Analysis 🏆📉📈
1️⃣ Current Price: $2,919.35
2️⃣ Key Observations:
Distribution on H4: Potential sign of a short-term reversal. 📉
Divergence: Suggests weakening momentum at the highs, increasing the probability of a pullback. ⚠️
Multiple Unfilled Mitigation Blocks (MB): Areas of interest where price may retrace for liquidity grabs. 🧐
Fair Volume Ranges: Notable levels around $2,700 - $2,500, where price might stabilize if a correction occurs. 🔄 3️⃣ Potential Scenarios:
If price breaks down from the H4 distribution, expect a retracement toward the nearest MB unfilled levels (~$2,700).
If bulls hold momentum, breaking above current resistance (~$3,000) could push prices into price discovery. 🚀
💡 Conclusion: Watch for price action around the unfilled MBs and fair volume ranges. A correction seems likely unless buyers step in aggressively.
🔥 Trade Wisely & Manage Risk! 🔥

XAG/USD Silver Price Analysis: Bullish Continuation or Rejection📉 Current Price: 32.3715
📊 Key Levels:
Support Zone (~32.00 - 32.20): Price recently bounced from this level.
Resistance Zone (~33.20 - 33.50): A potential target for an upward move.
📈 Potential Scenario:
The chart suggests a bullish breakout after retesting the lower support zone.
If the price successfully retests and holds above 32.00, it could continue towards 33.50.
A break below 32.00 could invalidate this bullish move and lead to further downside.
🎯 Trading Outlook:
Bullish Bias above 32.00, aiming for 33.50.
Bearish Risk below 32.00, which could lead to further declines.

Gold (XAU/USD) 1H Chart Analysis – Key Levels & Trade Setups!Gold (XAU/USD) 1H Chart Analysis 🏆✨
1️⃣ Support & Resistance Zones 🚧
Resistance Zones (Purple areas):
🔹 Lower resistance ~ 2,920
🔹 Upper resistance ~ 2,960
Support Zone 🛡️ around 2,900
2️⃣ Possible Price Movements 📈📉
✅ Bullish Scenario: If price breaks above 2,920, it may surge towards 2,960 🚀💰
❌ Bearish Scenario: If price gets rejected at 2,920, a pullback to 2,900 is likely ⚠️📉
3️⃣ Trend Analysis 📊
🔥 The price is in an uptrend after bouncing from 2,880
🔍 Watch the 2,920 level—break or rejection will decide the next big move!
💡 Trading Plan:
Bullish: Wait for a breakout 🔼 above 2,920, then target 2,960 🎯
Bearish: Short if price rejects 2,920, aiming for 2,900 📉

COST Costco Wholesale Corporation Options Ahead of EarningsIf you haven`t bought COST before the rally:
Now analyzing the options chain and the chart patterns of COST Costco Wholesale Corporation prior to the earnings report this week,
I would consider purchasing the 1030usd strike price Puts with
an expiration date of 2025-3-21,
for a premium of approximately $22.15.
If these options prove to be profitable prior to the earnings release, I would sell at least half of them.

GAP Options Ahead of EarningsAnalyzing the options chain and the chart patterns of GAP prior to the earnings report this week,
I would consider purchasing the 19.50usd strike price Puts with
an expiration date of 2025-3-7,
for a premium of approximately $1.02.
If these options prove to be profitable prior to the earnings release, I would sell at least half of them.

LFWD Lifeward Options Ahead of EarningsAnalyzing the options chain and the chart patterns of LFWD Lifeward prior to the earnings report this week,
I would consider purchasing the 2.50usd strike price Calls with
an expiration date of 2025-7-18,
for a premium of approximately $0.50.
If these options prove to be profitable prior to the earnings release, I would sell at least half of them.

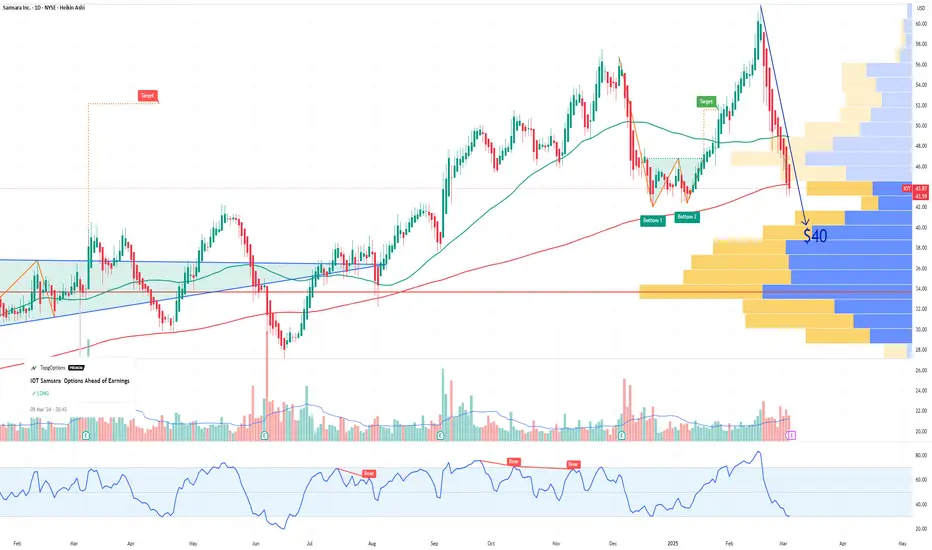
IOT Samsara Options Ahead of EarningsIf you haven`t bought IOT before the previous earnings:
Now analyzing the options chain and the chart patterns of IOT Samsara prior to the earnings report this week,
I would consider purchasing the 40usd strike price Puts with
an expiration date of 2025-3-7,
for a premium of approximately $1.85.
If these options prove to be profitable prior to the earnings release, I would sell at least half of them.
GBP/USD 4H Analysis – Bullish Momentum & Key Demand Zones📊 GBP/USD 4H Analysis – Smart Money Concepts (SMC) Perspective
Current Market Structure:
📈 Bullish Momentum: The price is currently trending upwards after breaking a short-term high (SH) and liquidity zone.
🔄 Change of Character (CH): Confirmed as the price broke previous resistance, signaling a possible trend continuation.
Key Zones & Levels:
🟣 H4 Block Order (Demand Zone): Marked in purple, this area aligns with a strong order block, indicating potential buying interest if the price retraces.
🟥 Daily Fair Value Gap (FVG): Above the demand zone, acting as a potential area for price rebalancing before resuming the uptrend.
🔴 200 EMA at 1.25179: Serving as dynamic support, aligning with the demand zone for potential buy setups.
Potential Scenarios:
📉 Retracement to Demand Zone (1.2500 - 1.2550)
Buyers may step in at the H4 Block Order & Fair Value Gap.
Price could form a higher low before continuation.
📈 Bullish Expansion to New Highs (1.2750 - 1.2800)
If demand holds, expect a strong push-up towards liquidity areas.
Breakout could trigger momentum buying.
Bias:
✅ Bullish (Higher Highs & Higher Lows Forming)
⚠️ Caution: If price breaks below 1.2500, sentiment may shift bearish.

Secure Profits of LONGBTC/USDT 1H Technical Analysis – Updated Insights
🟢 BitcoinMF Signal: TP Hit – Key Resistance Zone
The BitcoinMF PRO indicator's long signal successfully hit the Take Profit (TP) target, aligning with a resistance level around $94,410. This area is now a critical decision point for BTC's next move.
📊 Advanced Technical Breakdown:
1️⃣ Fibonacci Retracement & Extensions:
To assess potential support and resistance levels, key Fibonacci levels have been recalculated based on the recent price movement:
0.236 Fib Retracement (Support) → $87,416
0.382 Fib Retracement (Support) → $85,991
0.618 Fib Retracement (Stronger Support) → $80,423
1.618 Fib Extension (Bullish Target) → $98,217
2.618 Fib Extension (Aggressive Target) → $104,500
These levels suggest that maintaining support above $87,000 could pave the way for a move toward 98K, while a breach below this support might lead to a deeper retracement.
2️⃣ CME Gap – Key Risk Factor
A CME gap exists between $77,930 and $81,210, formed in November 2024. Historically, such gaps tend to be filled over time, indicating a potential retracement to this zone before resuming the macro uptrend.
3️⃣ Bitcoin Dominance – Altcoin Impact
BTC Dominance is currently at 52.8%, indicating that Bitcoin is leading the market rally. This dominance suggests that if BTC corrects, altcoins may experience more significant declines in the short term.
4️⃣ Exchange Flows – Whale Activity
There has been a significant outflow of BTC from exchanges, signaling accumulation by investors and reduced selling pressure. This trend supports the potential for further upside unless a reversal pattern emerges.
5️⃣ Fear & Greed Index – Market Sentiment
The Fear & Greed Index currently reads 81 (Extreme Greed), reflecting strong bullish sentiment. While this indicates market confidence, it also warrants caution, as extreme greed can precede corrective phases.
6️⃣ Fisher Transform & Stochastic RSI
Fisher Transform: The indicator is in the overbought zone but has not yet signaled a reversal.
Stochastic RSI: Recently crossed above 80, indicating overheated conditions and suggesting a potential cooldown or sideways movement.
🔮 Next Most Probable Move:
📊 Probability Score (Scale 1-10)
Bullish Continuation Probability: 6.5/10
Short-Term Correction Probability: 7.5/10
🔹 Scenarios:
If BTC maintains support above
87K, a move toward
98K is plausible.
If BTC falls below 87K, the 80K region becomes the next significant support level.
🚨 Most Likely Outcome: A short-term retracement toward 87K-85K is anticipated before the uptrend potentially resumes, targeting 98K-100K.

BRIEFING Week #9 : Is this just a Bad Dream ?!Here's your weekly update ! Brought to you each weekend with years of track-record history..
Don't forget to hit the like/follow button if you feel like this post deserves it ;)
That's the best way to support me and help pushing this content to other users.
Kindly,
Phil

$LLY Long-Term BuyHealthcare could possibly be the next rotation coming out of this tech bull run. Using the Trade Jeanie (Jeanius Screener/Indicator), I was able to see the current technical buy signals happening on NYSE:LLY :
Inside a HTF fair value gap (3M timeframe)
Took out an untested low (liquidity)
The Jeanius Indicator shows green 'Combo' labels every time this same combination of signals happened
The Jeanius Screener lets me filter my favorite tickers to see which ones are currently taking out untested lows or liquidity

MARA Holdings Options Ahead of Earnings If you haven`t bought the dip on MARA:
Now analyzing the options chain and the chart patterns of MARA Holdings prior to the earnings report this week,
I would consider purchasing the 13usd strike price Calls with
an expiration date of 2025-6-20,
for a premium of approximately $2.37.
If these options prove to be profitable prior to the earnings release, I would sell at least half of them.

TDOC Teladoc Health Options Ahead of EarningsAnalyzing the options chain and the chart patterns of TDOC Teladoc prior to the earnings report this week,
I would consider purchasing the 20usd strike price Calls with
an expiration date of 2026-1-16,
for a premium of approximately $1.04.
If these options prove to be profitable prior to the earnings release, I would sell at least half of them.

IONQ Options Ahead of Earnings If you haven`t bought IONQ before the rally:
Now analyzing the options chain and the chart patterns of IONQ prior to the earnings report this week,
I would consider purchasing the 30usd strike price Calls with
an expiration date of 2025-4-17,
for a premium of approximately $5.15.
If these options prove to be profitable prior to the earnings release, I would sell at least half of them.
