BMBL Bumble Options Ahead of EarningsAnalyzing the options chain and the chart patterns of BMBL Bumble prior to the earnings report this week,
I would consider purchasing the 8usd strike price Calls with
an expiration date of 2025-4-17,
for a premium of approximately $1.52.
If these options prove to be profitable prior to the earnings release, I would sell at least half of them.
Indicators

SEDG SolarEdge Technologies Options Ahead of EarningsAnalyzing the options chain and the chart patterns of DKNG DraftKings prior to the earnings report this week,
I would consider purchasing the 16usd strike price Calls with
an expiration date of 2025-2-28,
for a premium of approximately $1.76.
If these options prove to be profitable prior to the earnings release, I would sell at least half of them.

U Unity Software Options Ahead of EarningsIf you haven`t bought U before the previuos earnings:
Now analyzing the options chain and the chart patterns of U Unity Software prior to the earnings report this week,
I would consider purchasing the 21usd strike price Calls with
an expiration date of 2025-2-21,
for a premium of approximately $1.73.
If these options prove to be profitable prior to the earnings release, I would sell at least half of them.

The Ugly Truth of Technical Analysis...Even though this may be an extremely unpopular opinion on this topic, realizing this simple truth may be what makes or breaks a profitable trader. The truth is this...
Drawing lines on a chart does not predict any price movement, and there are more factors in play than simply price action
It doesn't matter what the gurus on the internet say about some "secret strategy" or a "secret indicator", anyone with common sense should automatically ignore content like that. Firms like NYSE:JPM , NYSE:GS , NYSE:MS , etc. , spend billions upon billions of dollars just to figure out how to trade the market with efficiency, but some random 19 year old on the internet figured out how to beat these mega-firms with a free indicator. Yeah right.
However, I'm not saying that technical analysis doesn't work or that it shouldn't be used; I'm simply saying to reconsider your strategy and use common sense before donating your money to Wall Street banks. Below is an example of technical analysis working perfectly on NYSE:UNH for the 1D timeframe looking back into April of last year.
This would have been a textbook channel breakout trade, in which the trader takes a short when the bottom trendline is broken (or the candle closes below the trendline). It would have resulted in a maximum of 17% gain on naked short shares if the bottom penny is the exit price (which is virtually impossible). So there you have it... technical analysis works perfectly and I have proven myself wrong.... right? No. . Now let me show you what really happened. Here is the same exact chart, but this time with a piece of key information shown.
As it turns out, there was nothing technical in play at all in this price action, but rather a "fundamental" or a "tangible" aspect was the price driver. An example like this should also show you that not providing sufficient information and taking charts out of context can be done by literally anyone. If you think you can predict the future with some geometric shapes, bars, and non financial, fundamental, or tangible analysis, better than the top Wall Street firms, I say good luck to you.
WITH THAT BEING SAID, this does not mean that trendlines, price areas, value gaps, and other technical indicators are completely invalid, but it does mean that there is more to the story than what is on the chart. Always review news, sentiment, financials, analyst ratings, and other key oscillators to gauge every trade.
Disclaimer: The indicators used on the chart are only for illustrative purposes of a cluttered chart. I am neither saying that they are accurate nor inaccurate.

DKNG DraftKings Options Ahead of EarningsIf you haven`t bought DKNG before the previuos earnings:
Now analyzing the options chain and the chart patterns of DKNG DraftKings prior to the earnings report this week,
I would consider purchasing the 45usd strike price Calls with
an expiration date of 2025-2-14,
for a premium of approximately $2.24.
If these options prove to be profitable prior to the earnings release, I would sell at least half of them.

ABNB Airbnb Options Ahead of EarningsIf you haven`t bought the dip on ABNB:
Now analyzing the options chain and the chart patterns of ABNB Airbnb prior to the earnings report this week,
I would consider purchasing the 145usd strike price Calls with
an expiration date of 2026-1-16,
for a premium of approximately $20.75.
If these options prove to be profitable prior to the earnings release, I would sell at least half of them.

AMAT Applied Materials Options Ahead of EarningsAnalyzing the options chain and the chart patterns of AMAT Applied Materials prior to the earnings report this week,
I would consider purchasing the 180usd strike price Calls with
an expiration date of 2025-2-21,
for a premium of approximately $6.75.
If these options prove to be profitable prior to the earnings release, I would sell at least half of them.

COIN Coinbase Global Options Ahead of EarningsIf you haven`t bought COIN before the previous earnings:
Now analyzing the options chain and the chart patterns of COIN Coinbase Global prior to the earnings report this week,
I would consider purchasing the 285usd strike price Calls with
an expiration date of 2025-2-14,
for a premium of approximately $7.65.
If these options prove to be profitable prior to the earnings release, I would sell at least half of them.

GBP/USD Breaks Downtrend – Bullish Reversal in Play? GBP/USD Daily Chart Analysis – February 11, 2025
Key Observations:
📌 Support Zone: The price recently bounced from a strong demand zone around 1.2050 - 1.2200, indicating a potential bullish reversal.
📌 Break of Downtrend Line: The market has broken above the descending trendline, suggesting a shift in momentum.
📌 200 EMA Resistance: The 200-day Exponential Moving Average (EMA) at 1.2691 is a crucial resistance level to watch. A break above it could confirm a stronger bullish trend.
📌 Bullish Price Action: The price has formed a higher low and is now pushing higher, showing early signs of an uptrend.
Potential Scenarios:
✅ Bullish Case: If GBP/USD holds above the breakout level and breaks past 1.2690, we could see a move toward 1.2800 - 1.3000.
❌ Bearish Case: If the price fails to hold above 1.2300, a retest of the demand zone near 1.2100 is possible.
Conclusion:
This setup favors bullish momentum 📈, but confirmation above the 200 EMA is necessary for further upside. Traders should monitor price action and key resistance levels before committing to long positions.

USOIL 1H Analysis: Bullish Breakout or Reversal?📊 WTI Crude Oil (USOIL) 1H Chart Analysis 🛢️🚀
Current Market Status
Open: 73.33
High: 73.36
Low: 73.25
Close: 73.26 (-0.11%) 🔻
200 EMA: 72.40
Key Observations
✅ Strong Uptrend 📈
Price is trading above the 200 EMA (red line), indicating bullish momentum.
Recent candles show higher highs and higher lows, confirming upward movement.
✅ Consolidation Zone 📊
Price is currently in a range (orange box), suggesting a potential breakout.
Market is forming small candles, indicating indecision before a bigger move.
✅ Projected Breakout 🚀
The chart shows an anticipated bullish breakout above $74.00 - $74.85 target area (gray box).
If the price breaks above resistance, it may rally towards the next psychological level $75.00+.
❌ Risk Zone (Stop Loss Area) ⚠️
Support zone (bottom of the orange box) at $72.78 - $73.15.
If price breaks below this level, a bearish reversal could happen.
Trading Outlook
💡 Bullish Bias 📈: Look for a breakout above $73.50 - $74.00 for a long entry.
⚠️ Bearish Reversal Risk: A break below $72.78 may invalidate the bullish setup.
🔥 Potential Move:
🚀 Upside Target: $74.85 - $75.00+
🛑 Stop Loss: Below $72.78

Gold Analysis – Potential Pullback Within Ascending ChannelKey Observations:
Current Price: $2,900.48
Recent High: $2,907.29
200 EMA (Red Line): $2,758.59 (Strong support level)
Projection: Price may correct lower towards the channel’s lower boundary (~$2,875)
Analysis:
📊 Short-Term Bearish: A pullback could happen before further upside if the trend holds. If price breaks below the channel, a deeper correction towards the 200 EMA might follow.
🔍 Trading Idea: Traders might look for buying opportunities at the lower trendline (~$2,875-$2,880) if price shows support.

XAU/USD Bullish Breakout – Gold Eyes $2,928 & Beyond!🔥 XAU/USD Analysis – February 4, 2025 🔥
📈 Current Price: $2,842.18 (+0.98%)
📊 Trend: Bullish momentum inside an ascending channel
🔍 Key Levels to Watch:
🔵 Resistance: $2,928.75 – If this level breaks, expect further upside movement! 🚀
🔵 Support: $2,729.13 – Strong demand zone; watch for pullbacks.
🔴 EMA 200: $2,534.85 – Long-term bullish confirmation above this level! ✅
📉 Possible Scenarios:
✅ Bullish Case: Price continues the uptrend, targeting $2,928.75 next. If broken, gold could see $3,000+ soon! 🎯🔥
⚠️ Bearish Case: A rejection from resistance could lead to a pullback towards $2,800-$2,730.
💡 Final Thoughts:
The bullish momentum is still strong, and dips could be buying opportunities! 📊👑 Watch for price action near key levels.
📢 Gold bulls, are you ready for new highs? 🚀💰

BREIFING Week #6 : Volatility is LyingHere's your weekly update ! Brought to you each weekend with years of track-record history..
Don't forget to hit the like/follow button if you feel like this post deserves it ;)
That's the best way to support me and help pushing this content to other users.
Kindly,
Phil

AFRM Affirm Holdings Options Ahead of EarningsIf you haven`t sold AFRM before the previous earnings:
Now analyzing the options chain and the chart patterns of AFRM Affirm Holdings prior to the earnings report this week,
I would consider purchasing the 75usd strike price Calls with
an expiration date of 2025-4-17,
for a premium of approximately $3.70.
If these options prove to be profitable prior to the earnings release, I would sell at least half of them.

AMZN Amazon Options Ahead of EarningsIf you haven`t bought AMZN before the previos earnings:
Now analyzing the options chain and the chart patterns of AMZN Amazon prior to the earnings report this week,
I would consider purchasing the 240usd strike price Calls with
an expiration date of 2025-2-7,
for a premium of approximately $6.40.
If these options prove to be profitable prior to the earnings release, I would sell at least half of them.

Ethereum (ETH/USDT) Rebound or Further Drop? Critical Levels!!📊 Ethereum (ETH/USDT) Daily Chart Analysis – Feb 4, 2025
🔴 Current Market Overview:
Closing Price: $2,692.12 (-6.52%) 📉
200 EMA Level: $3,128.49 (acting as resistance)
Key Support: $2,250 - $2,400 (Strong Support Zone) ✅
Key Resistance: $3,900 - $4,100 (Demand Zone) 🔥
📉 Price Action Insights:
ETH has seen a sharp decline, breaking below the 200 EMA 🚨.
Price bounced off the Strong Support area, indicating buying interest 📈.
A recovery scenario suggests ETH could retest the $3,000+ zone before heading towards the demand zone near $4,000.
🛠 Trading Strategy:
✅ Bullish Scenario:
A successful higher low formation around $2,750-$2,800 could trigger a move towards $3,250 - $4,000 📊.
Look for confirmation of bullish momentum with volume increase.
🚨 Bearish Risk:
If ETH fails to hold above support ($2,400-$2,500), further downside towards $2,000 is possible 😨.
🎯 Final Thoughts:
ETH is at a critical support; a bounce here could offer a great risk-reward opportunity 🚀.
Keep an eye on 200 EMA resistance and volume confirmation.
💬 What’s your plan? Are you bullish or waiting for more confirmation? 🤔

Gold (XAU/USD) 4H: Bullish with Possible Pullback?Gold (XAU/USD) 4H Chart Analysis: Bullish Trend with Possible Pullback
Key Observations:
1. Price Action & Trend:
The price is currently trading around $2,817.685.
The trend appears bullish, with a strong upward move.
There is a marked internal liquidity (Int. LQ) taken, indicating that liquidity has been absorbed, which could lead to further upside.
A market structure break (MB filled) suggests past resistance turned into support.
2. Technical Indicators:
Exponential Moving Average (EMA 200, red line) is at $2,709.123, which is significantly below the current price. This suggests that gold is in a strong uptrend.
Relative Strength Index (RSI, 14 close) is at 68.56, nearing the overbought zone (70) but still has room for potential upside.
3. Projected Movement:
The chart suggests a potential pullback (small consolidation) before further upward movement.
Fair volume ranges (marked in red) indicate levels where price may slow down or consolidate before continuation.
Price is above key liquidity levels, which may act as support.
Conclusion:
The trend remains bullish, and the price could continue rising after a minor consolidation.
Key levels to watch:
Support: Around $2,800 (former liquidity level).
Resistance: Next potential target is $2,840 - $2,860.
Risk Consideration: RSI is approaching overbought levels, so a short-term correction could occur before another push higher.

AMD Advanced Micro Devices Options Ahead of EarningsIf you haven`t bought AMD before the previous earnings:
Now analyzing the options chain and the chart patterns of AMD Advanced Micro Devices prior to the earnings report this week,
I would consider purchasing the 113usd strike price Calls with
an expiration date of 2025-2-21,
for a premium of approximately $7.20.
If these options prove to be profitable prior to the earnings release, I would sell at least half of them.

Bitcoin (BTC/USDT) 4H Analysis: Critical Support Test –(caption)🚀 Bitcoin (BTC/USDT) 4H Chart Analysis (Feb 2, 2025) 📊
🔍 Key Observations:
1️⃣ Strong Support Zone (Red Box) 🛑
BTC is currently testing the $98,000 - $99,000 support zone.
This level has previously acted as a demand area, meaning buyers might step in.
2️⃣ 200 EMA (Exponential Moving Average) Resistance (Red Line) 📉
The 200 EMA at $100,718 is acting as dynamic resistance.
A break and close above this level would indicate bullish strength.
3️⃣ Key Resistance Levels 🚧
$100,718 (200 EMA Resistance)
$102,884 (Major Horizontal Resistance)
If price breaks these levels, next targets: $104,000 - $106,000.
4️⃣ Key Support Levels 🛠️
$98,000 - $99,000 (Current Demand Zone)
$90,000 - $89,184 (Next Major Support Below)
📈 Possible BTC Price Scenarios:
✅ Bullish Case (Price Bounces from Support) 🟢
If BTC holds above $98,000 - $99,000, a move toward $102,884 and higher is possible.
Breaking above $102,884 could trigger a rally toward $104,000 - $106,000.
Watch for volume increase & bullish candlestick confirmation.
❌ Bearish Case (Break Below Support) 🔴
If BTC breaks below $98,000, we could see a drop to $90,000 - $89,184.
A break below $90,000 could lead to further downside toward $88,000.
Watch for strong selling pressure & breakdown candle.
📊 Final Thoughts: BTC at a Critical Level!
🚨 Decision Point: BTC is at a key support level—will bulls step in, or will bears take control?
🔹 For Bulls: Need to reclaim $100,700+ for bullish continuation.
🔹 For Bears: Losing $98,000 could open the door for a drop toward $90,000.
👀 Keep an eye on price action & volume for the next big move!
🔥 What’s your bias? Bullish 🚀 or Bearish 📉? Let’s discuss!

BTC/USDT 4H Analysis: Bearish Breakdown or Rebound?📉 Bitcoin (BTC/USDT) 4H Chart Analysis
🔴 Overview:
Bitcoin is trading at $101,847 (-0.22%) on the 4-hour timeframe.
The price is moving within a descending wedge/pennant pattern.
Key EMA (200): Currently at $100,781, acting as dynamic support.
📌 Key Levels & Analysis:
Resistance Zone (~$102,000 - $103,000): Price is struggling to break above this level.
Support Zone (~$97,500 - $98,500): A key demand zone where buyers may step in.
⚠️ Potential Scenarios:
Bearish Breakdown ⬇️
If BTC loses the $100,800 EMA support, a drop towards $98,000-$97,500 is likely.
The marked arrow suggests this bearish move.
Bullish Rebound ⬆️
If BTC holds above EMA 200 and reclaims $102,000, a breakout towards $104,000-$106,000 could follow.
🧐 Final Thoughts:
Short-term trend: Bearish bias unless price reclaims resistance.
Watch for a break below $100,800 for further downside.
RSI & Volume Confirmation Needed for stronger signals.

Ethereum (ETH/USDT) at Critical Support – Breakout or Breakdown?📉 Ethereum (ETH/USDT) 4H Chart Analysis
🔴 Current Price: $3,220.06 (-0.95%)
📊 Indicators & Patterns:
Downtrend Resistance: A descending trendline is acting as resistance.
Support Zone: The red highlighted area (~$3,220) is a key support level.
200 EMA: At $3,320, acting as resistance.
🔮 Possible Scenarios
1️⃣ Bullish Case 🚀: If ETH holds the support and breaks the descending trendline ($3,320), it could test higher levels around $3,400 - $3,500.
2️⃣ Bearish Case 📉: A breakdown below the support ($3,220) could trigger a fall towards $3,100 or even $3,000.
🎯 Key Levels to Watch
Resistance: $3,320 (EMA 200), $3,400 (Trendline)
Support: $3,220 (Zone), $3,100 (Next Major Support)
⏳ Conclusion
ETH is at a critical decision point. A bounce could lead to a breakout, but failure to hold could trigger more downside. Watch for a reaction around $3,220! 🚦

BRIEFING Week #5 : Still Patient...Here's your weekly update ! Brought to you each weekend with years of track-record history..
Don't forget to hit the like/follow button if you feel like this post deserves it ;)
That's the best way to support me and help pushing this content to other users.
Kindly,
Phil

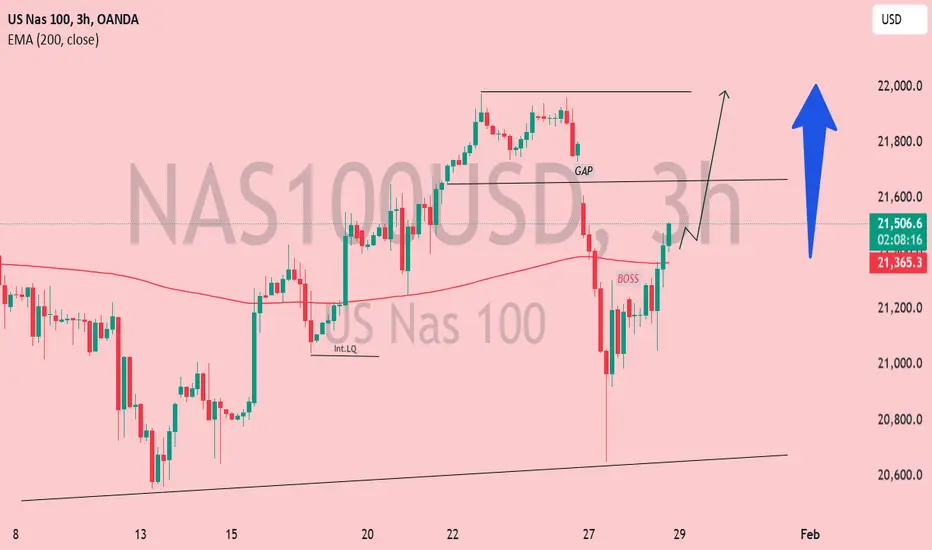
NAS100USD Bullish Reversal: Gap Fill & Upside Target in Focus📢 Title: NAS100USD Bullish Reversal: Gap Fill & Upside Target in Focus 🚀
📊 Current Price Action:
The latest price is 21,490.1 📈, showing a +0.29% gain (+62.3 points) ✅.
The 200 EMA (Exponential Moving Average) 📊 is at 21,365.2, suggesting the price is slightly above this key moving average.
📌 Key Levels & Market Structure:
🔻 BOS (Break of Structure): Indicates a bearish structure break before the current recovery.
📉 GAP: There is a visible gap in the price action, which often acts as a magnet for price movements.
💰 Liquidity & Internal Liquidity (Int. LQ): Suggests areas where institutional interest may have been present.
📈 Trend & Potential Direction:
The price recently bounced off the 200 EMA 🔄, indicating possible bullish momentum 📈.
The ⬆️ arrow projection suggests a bullish outlook, targeting the gap fill and potentially moving higher towards 21,800 - 22,000.
If price holds above 21,365, the bullish thesis remains valid ✅.
🏆 Conclusion:
🐂 Bullish Bias:
Price is recovering from a break of structure (BOS) and pushing higher towards unfilled gaps 📊.
📍 Key Levels to Watch:
🛑 Support: 21,365 (200 EMA) – If it breaks below, downside risk increases ⚠️.
🚧 Resistance: 21,600 (gap area) – Price might struggle before breaking through 🚀.
💡 Trade Idea:
A 📈 long position targeting 21,800+, with a stop loss below 21,365 🔥.