BRIEFING Week #36 : Let's see the summer DashboardHere's your weekly update ! Brought to you each weekend with years of track-record history..
Don't forget to hit the like/follow button if you feel like this post deserves it ;)
That's the best way to support me and help pushing this content to other users.
Kindly,
Phil
Indicators

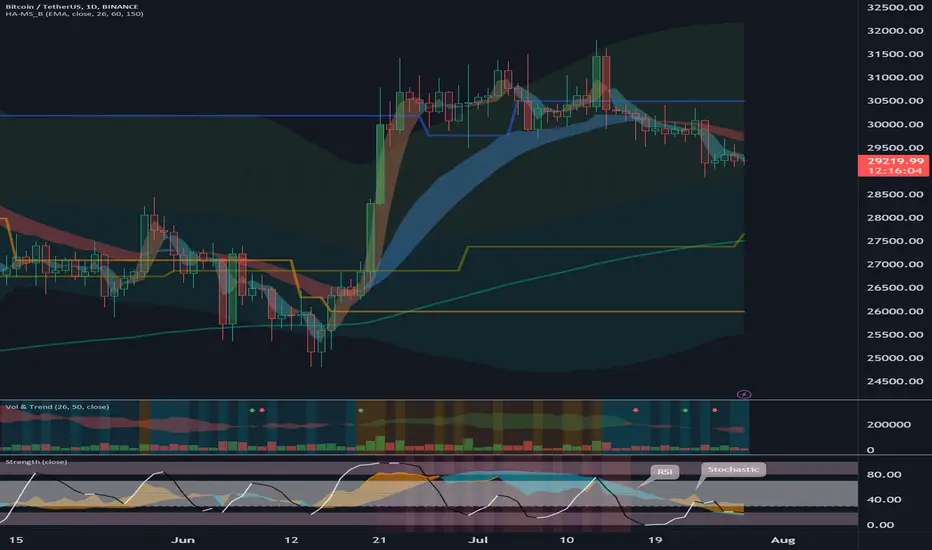
Bitcoin's Next Move: Possible Targets if 25K Support is Broken!Get ready for an exciting Bitcoin adventure! Today, I'll delve into potential targets in case the critical 25K support level is breached.
🎯 Target 1: Closing the Gap - $23,500
When analyzing Bitcoin's price movements, gaps in the Bitcoin Futures market can be significant indicators. My investigation reveals a notable gap around $23,500. Typically, price retraces to fill these gaps. If the 25K support breaks, this becomes a plausible target as traders aim to close the gap.
🎯 Target 2: Retesting Key Support - $21,000
If selling pressure increases after breaching the 25K support, Bitcoin may retest a critical support level near $21,000. Historically, this level has been psychologically and historically important. A drop to this level is likely to attract attention from traders and investors as it presents a significant buying opportunity and tests Bitcoin's overall market sentiment.
🎯 Target 3: Bearish Momentum - $18,000
While it may sound concerning, it's essential to consider all scenarios. If bearish momentum strengthens and selling pressure persists, Bitcoin could potentially drop to around $18,000. Although this target may seem drastic, it aligns with historical price patterns and Bitcoin's volatility in the past.
Remember, these targets indicate potential price levels in the event of the 25K support breaking. Factors such as market dynamics, sentiment, and other influences can affect Bitcoin's trajectory. It's vital to analyze a range of scenarios and make informed trading decisions.

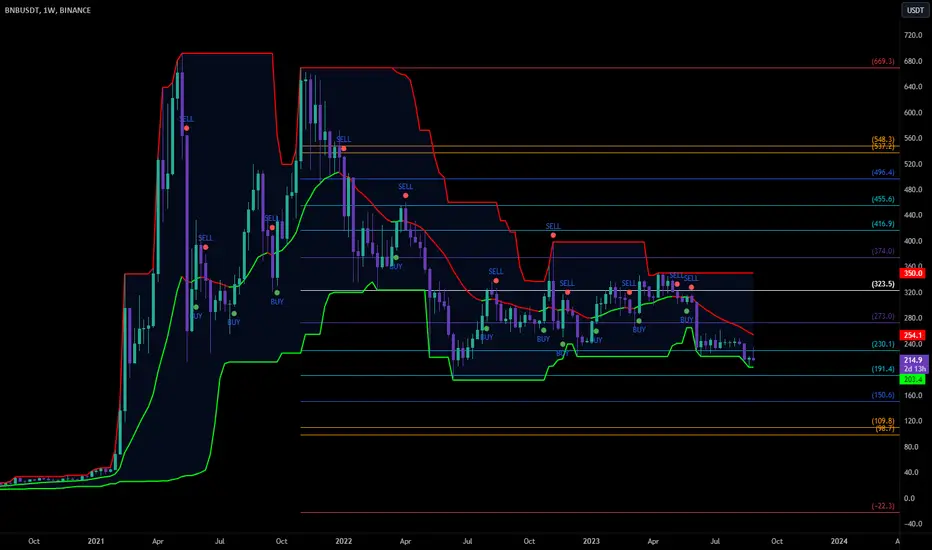
Binance (BNB) Price Analysis: Exploring Possible Targets💥 Target 1: $190 - A Stepping Stone on BNB's Path As Binance Coin faces potential price retracements, our first target lands at $190. This level represents a crucial support zone where #BNB may find stability and attract buying interest. Traders and investors will closely monitor BNB's price action as it approaches this level, seeking opportunities to accumulate or ride the upward momentum.
💥 Target 2: $150 - Seeking Consolidation and Rebounding Should BNB experience a deeper pullback, our second target awaits at the $150 level. This zone has historically acted as a consolidation area, providing a springboard for potential rebounds. Traders will keep a close eye on BNB's market dynamics and indicators for signs of a reversal, aiming to capitalize on a potential bounce from this level.
💥 Target 3: Between $98 and $110 - Unlocking the Golden Pocket Now, let's dive into the exciting concept of the Golden Pocket. This range, extending from $98 to $110, holds immense significance as a potential support zone for BNB. The Golden Pocket, derived from Fibonacci retracement levels, often serves as a turning point that attracts considerable buying interest.
If BNB's price retraces to this zone, it presents an enticing opportunity for traders to enter or add to their positions. The Golden Pocket captures the attention of many market participants, as it historically offers a compelling risk-to-reward ratio for long-term gains.
Fear Index: Potential Investments BTC📉Hey there, fellow crypto enthusiasts! 🚀 Let's dive into the intriguing world of the "Fear Index" and how you can leverage it to make well-informed investment decisions in the realm of Bitcoin. Buckle up as we decode the mysteries behind this index and its impact on your investment strategy.
🔍 Understanding the Fear Index: Imagine having a gauge that measures the level of fear and uncertainty in the market – that's precisely what the Fear Index, also known as the VIX (Volatility Index), does. It's a numerical representation of investor sentiment and market volatility.
📉 Fear as a Market Indicator: The Fear Index is often referred to as the "fear gauge" because it tends to rise during periods of market turmoil and decline during calmer times. It's a reflection of how traders perceive risk and uncertainty in the market.
📊 Using the Fear Index for Bitcoin: While the Fear Index is widely associated with traditional markets, its principles can be applied to Bitcoin investments as well. When the Fear Index is high, it suggests heightened fear and potential market downturns. Conversely, a low Fear Index might indicate a sense of complacency and potential overvaluation.
💡 Investment Strategy: How can you use the Fear Index for your Bitcoin investments? High Fear Index readings can signal potential buying opportunities, as extreme fear often leads to oversold conditions. Conversely, low Fear Index readings might be a time to exercise caution and consider risk management strategies.
🚀 Fear as Your Guide: Remember, the Fear Index isn't a crystal ball, but it provides valuable insights into market sentiment. By incorporating it into your investment toolkit, you can better navigate the waves of uncertainty in the crypto world.
So, what's the bottom line when it comes to using the Fear Index for Bitcoin investments? 📊 It's about recognizing that fear isn't an obstacle; it's a navigational tool that can guide you towards strategic decisions. By understanding market sentiment, you position yourself to make more informed choices.
Stay curious, stay vigilant, and remember – whether it's fear or opportunity, the Fear Index is a resourceful ally in your quest for successful Bitcoin investments! 🚀🛡️

ForexGPT Case Study #2 - CHFJPY LongForexGPT Indicator Explained
The ForexGPT indicator is a specialized tool crafted for traders seeking a refined edge in their trading decisions. Emerging from over 10,000 hours of intensive chart analysis, this indicator identifies a unique pattern in the Forex market that has historically hinted at forthcoming significant price movements.
While the particular nature of the pattern remains proprietary, envision it as a result of distilled insights from exhaustive chart studying, recognizing recurring behaviors, and validating these observations across various time frames and currency pairs.
On spotting this pattern on a chart, the ForexGPT indicator signals a visual alert, such as arrows or markers. Besides, it pinpoints potential entry points, suggesting when traders might contemplate initiating a position. For better risk management, it also highlights potential stop-loss levels.
For traders, the ForexGPT offers:
-A distinctive pattern recognition system built on extensive research.
-Transparent visual cues when the pattern emerges.
-Recommendations on potential entry points and risk containment strategies.
However, it's essential to understand that the ForexGPT is not a magic wand. It's a tool forged from extensive research, but successful trading still necessitates user discernment and adherence to specific rules.
Rules for Using the ForexGPT Indicator:
1. Remain patient until a bullish or bearish signal prints! A bullish signal should ideally appear at the bottom of a range, while a bearish signal at the top.
2. Ensure that the price moves 20 or more pips in the correct direction of the setup WITHOUT violating the suggested red stop-loss line.
3. When the price returns to the recommended entry line, that's your cue to enter the setup. Position your stop-loss at the location of the red line, and earmark your take profit at the most recent opposing high or low in the market.
For those who might not have the luxury of time or expertise to sift through extensive price data, the ForexGPT acts as a valuable ally, presenting insights extracted from profound market scrutiny. But remember, while the tool provides guidance, the trader's skill in interpretation and application is crucial.
The setup on CHFJPY looks pretty good. We have an untapped setup that I spotted already in motion. Let's see what happens :)

BURL Burlington Stores Options Ahead of EarningsAnalyzing the options chain and the chart patterns of BURL Burlington Stores prior to the earnings report this week,
I would consider purchasing the 180usd strike price Calls with
an expiration date of 2023-9-1,
for a premium of approximately $5.90.
If these options prove to be profitable prior to the earnings release, I would sell at least half of them.
Looking forward to read your opinion about it.

BRIEFING Week #34 : Volatility has showed up ! Next ?Here's your weekly update ! Brought to you each weekend with years of track-record history..
Don't forget to hit the like/follow button if you feel like this post deserves it ;)
That's the best way to support me and help pushing this content to other users.
Kindly,
Phil

Dealing with News releasesUse any economic calendar to monitor news releases. (forexfactory, myfxbook).
Below is how I adapt to news when trading my personal edge, including the pairs GBPUSD, EURUSD, AUDUSD and XAUUSD in my times. If you have tested pairs with other currencies, for example with CAD etc, make sure to be aware of related news there too.
Which news do I adapt to:
💀 USD high impact news - I have closed out any trades on any of my pairs before the news release, regardless of if I am in deep profit or loss on the trade. I do not enter trades on any of my pairs within 30 mins before or after a high impact USD news release.
💀 GBP high impact news - I have closed out any trade on a GBP or EUR trade before the news release, regardless of if I am in deep profit or loss on the trade. I do not enter trades on any GBP or EUR pair within 30 mins before or after a high impact USD news release. If the news release is CPI/ Inflation or Interest Rates, I also close out/ don’t enter trades on all my other pairs too.
💀 EUR high impact news - I am not concerned about EUR news as it does not tend to affect my pairs much in my experience. The only EUR news I close out/ do not enter trades on is Inflation/ CPI. Note the EUR news only applies to news on the economic calendar with the European flag next to it - not the random countries within the EU, such as Germany, Italy etc.

Short Dollar Index at Strong Resistance
The US dollar index, technical analysis compared against the seven other major FX currencies(AUD, CAD, JPY, CHF, GBP, EUR, and NZD), is at a strong resistance level, with RSI momentum levels close to being overbought.
Fundamentally and based on the analysis of various economic indicators, the US dollar appears to be leaning towards an inflationary bias, but some conflicting signals suggest potential deflationary pressures. Key points include:
Leading Indicators: PMI and Services PMI indicate a growing economy, potentially leading to inflation. However, momentum is slowing down, which could temper the inflationary outlook.
Money Indicators: M2 is historically low and bouncing higher, coupled with the decreasing interest rates (IRs) and real interest rates (Real IRs) velocity, indicating a possible shift towards looser monetary policy and an inflationary bias.
Inflation Measures: While CPI inflation is now close to average levels, the Core CPI is heading toward normality and decreasing, suggesting some downward pressure on inflation. PPI (Producers Inflation) has shown signs of bouncing higher, indicating potential inflationary tendencies.
Employment: Employment trends point to medium to low inflation expectations, as employment change is within YoY% average levels.
Considering these factors, the ultimate currency bias leans slightly towards an inflationary outlook for the US dollar. However, the mixed nature of the signals suggests a need for continued monitoring of economic indicators and policies to accurately assess the currency's direction.

HASH RIBBONS - Bullish Indicator 📈🐂Understanding the HASH RIBBONS Signal:
The HASH RIBBONS signal is based on the interplay of two essential moving averages: the 30-day Simple Moving Average (SMA) and the 60-day SMA. When these moving averages cross in an upward direction, it generates a bullish HASH RIBBONS signal.
The Strength of HASH RIBBONS Signal on Weekly Time Frame:
The HASH RIBBONS signal's significance amplifies when observed on the weekly time frame. Here's why it's considered a potent bullish indicator:
Confirmation of Bullish Momentum: A bullish HASH RIBBONS signal on the weekly chart confirms the presence of strong bullish momentum. This suggests that the cryptocurrency's price may experience a sustained upward trend.
Long-Term Perspective: The weekly time frame provides a broader view of market trends, filtering out short-term noise. A bullish signal here reflects a potential shift in long-term sentiment, which can be a precursor to a substantial price rise.
Market Sentiment Reversal: A HASH RIBBONS crossover indicates a possible reversal in market sentiment. This shift can attract more buyers, resulting in increased demand and upward price movement.
Conservative Traders' Choice: Many conservative traders rely on signals from longer time frames like the weekly chart to validate their trading decisions. A strong HASH RIBBONS signal can provide the necessary confirmation for these traders.
Potential Entry Point: A bullish HASH RIBBONS signal on the weekly chart often serves as a compelling entry point for traders seeking to ride a prolonged bullish trend.
Conclusion:
The HASH RIBBONS signal on the weekly time frame holds immense potential as a bullish indicator. Its confirmation of bullish momentum, long-term perspective, and ability to signal market sentiment reversals make it a formidable tool for traders and investors alike. However, like all indicators, it's essential to combine the HASH RIBBONS signal with other forms of analysis and maintain proper risk management practices.
As you navigate the dynamic cryptocurrency market, keep in mind that signals provide guidance, but market conditions can change rapidly. Staying informed, adapting your strategies, and using reliable indicators like the HASH RIBBONS on the weekly time frame can empower you to make more informed and confident trading decisions.
❗See related ideas below❗
Follow + Like this post and leave a nice comment, it will allow me to move faster and make more useful content! 💚💚💚

NZDJPY LAST WAVE DROPNZDJPY has been bearish since early July but started the trend with a possible leading diagonal which comprises of 5 waves and 3 sub-waves to it. Considering the diagram above, we are done with the waves 1, 2, 3, and 4 going for the completion of the last wave (wave 5). Wave A and B are done and price also going for wave C after which we can witness a big correction.
For now, lets see ow it plays out with a target of 410 pips from breakout.
WAVE 1 = 5 WAVES
WAVE 2 = 3 WAVES
WAVE 3 = 5 WAVES
WAVE 4 = 3 WAVES
WAVE 5 = 5 WAVES

🚀 Bitcoin ETF: The Next Gold Rush? Predicting a 470% Surge! 📈Introduction:
As the allure of digital assets continues to surge, it's fascinating to compare the impact of ETFs on a traditional asset like gold with the potential of a Bitcoin ETF.
Main Thesis:
After the introduction of the Gold ETF, its price skyrocketed by an astonishing 470%. This influence can be attributed to increased liquidity, accessibility, and heightened institutional focus on the asset. While a Bitcoin ETF hasn't been launched yet, the near future holds strong prospects, especially with big players like BlackRock and Vanguard showing interest.
Arguments:
Institutional Appetite: With growing attention from major financial entities towards cryptocurrencies, expect hefty investments flowing into Bitcoin. 🏦
Boost in Liquidity: The potential launch of an ETF could see trading volumes soar, resulting in enhanced Bitcoin liquidity and a potential price surge. 🌊
Accessibility: ETFs make Bitcoin more accessible to a broader audience, removing some of the direct ownership risks and complexities of crypto. 🌍
Conclusion :
A 470% growth from current values places Bitcoin's price within the $140k - $170k range. These targets align with my forecasts for Bitcoin's next peak in 2025. Although past performance isn't indicative of future results, the anticipated ETF endorsement signals bullish prospects for Bitcoin. 🌟
❗See related ideas below❗
Follow + Like this post and leave a nice comment, it will allow me to move faster and make more useful content! 💚💚💚

Top 10 Trading IndicatorsWelcome to the dynamic world of trading indicators! These meticulously crafted metrics, born from the intersection of mathematics and market psychology, offer traders a distinct advantage by transforming raw market data into actionable intelligence. Join us as we embark on a journey through the top 10 trading indicators, exploring their intricacies, strengths, and applications in deciphering the ever-shifting landscape of global markets. Whether you're a seasoned trader seeking to refine your strategies or a novice investor eager to grasp the essentials, this exploration promises to illuminate the fascinating realm of trading indicators and their pivotal role in the pursuit of financial success.
1. Moving Averages (MA)
The Moving Average often referred to as the SMA (Simple Moving Average), serves as a valuable tool for discerning the prevailing direction of a current price trend, while filtering out short-term price fluctuations. Through a calculated amalgamation of price points over a defined time span, divided by the total data points, the MA indicator presents a singular trend line that encapsulates the overall trajectory.
The timeframe utilized for the MA computation dictates the dataset employed. For instance, a 200-day MA necessitates 200 days' worth of data. By harnessing the insights offered by the MA indicator, one can delve into the realm of support and resistance levels, gaining insights from past price movements and the market's historical evolution. This, in turn, facilitates the anticipation of potential future patterns with enhanced precision.
2. Average True Range (ATR)
The Average True Range (ATR) is a widely used technical indicator designed to measure market volatility and assess potential price movement within a given trading period. Developed by J. Welles Wilder, ATR offers traders insights into the range of price fluctuations, accounting for both intraday price spikes and overnight gaps. Unlike many other indicators, ATR does not provide directional signals but instead focuses on quantifying volatility levels.
ATR is computed by considering the true range for each trading period, which involves calculating the greatest value among three key metrics: the difference between the high and low prices of the current period, the absolute value of the difference between the previous period's high and the current period's close, and the absolute value of the difference between the previous period's low and the current period's close. These true range values are then smoothed over a specified number of periods, often 14, to create the ATR line.
Traders employ the ATR indicator for multiple purposes. It aids in setting stop-loss levels, as larger ATR values suggest increased volatility and the potential for wider price swings. Additionally, ATR can assist in determining position sizing, with lower volatility suggesting smaller trade sizes and vice versa. Overall, ATR provides a valuable quantification of market volatility, enabling traders to adapt their strategies to prevailing market conditions and manage risk more effectively.
3. Stochastic oscillator
The Stochastic Oscillator is a momentum-based technical indicator that offers traders insights into potential trend reversals and overbought or oversold conditions in a market. Developed by George C. Lane, this oscillator compares the most recent closing price of an asset to its price range over a specified period, typically 14 periods. The resulting value, often expressed as a percentage, indicates the relative position of the closing price within that range. The Stochastic Oscillator comprises two lines: %K, the faster line that represents the current price's relationship to the recent range, and %D, a smoothed moving average of %K, providing a more stable signal.
Traders commonly use the Stochastic Oscillator to identify potential turning points in price trends. When the oscillator ventures into the overbought zone (typically above 80), it suggests that the asset might be overvalued, potentially signaling an impending price reversal or correction. Conversely, readings in the oversold zone (typically below 20) indicate potential undervaluation and may signal an upcoming price bounce. By analyzing the crossovers, divergences, and relationships between %K and %D, traders can derive valuable insights into the market's underlying momentum, facilitating more informed trading decisions and strategic entries or exits.
4. Moving average convergence divergence (MACD)
The Moving Average Convergence Divergence (MACD) is a versatile and widely used technical indicator that provides traders with insights into trend direction, momentum shifts, and potential buy or sell signals. Created by Gerald Appel, the MACD consists of two main components: the MACD line and the signal line. The MACD line is derived from the difference between two exponential moving averages (usually 12-period and 26-period EMAs), reflecting the convergence or divergence of short-term and long-term price trends. The signal line, often a 9-period EMA of the MACD line, acts as a trigger for potential trade entries or exits.
Traders leverage the MACD for various purposes. When the MACD line crosses above the signal line, it generates a bullish signal, indicating a potential upward price momentum and suggesting a favorable buying opportunity. Conversely, when the MACD line crosses below the signal line, a bearish signal is generated, suggesting a potential downward trend and a possible selling opportunity. Additionally, traders analyze the MACD histogram, which represents the difference between the MACD line and the signal line, providing insights into the strength and intensity of price momentum. With its ability to capture both short-term and long-term trends, the MACD remains a valuable tool for traders seeking to navigate complex market dynamics and make well-informed trading decisions.
5. Bollinger bands (BB)
Bollinger Bands, a cornerstone of technical analysis, provide traders with a unique perspective on price volatility and potential trend reversals. Created by John Bollinger, this indicator comprises three distinct lines that encapsulate price action: the middle band, typically a simple moving average (SMA), and an upper and lower band, which flank the middle band at a specified standard deviation distance. The width between the upper and lower bands dynamically adjusts according to market volatility, expanding during periods of heightened price swings and contracting during calmer phases.
These bands offer traders invaluable insights into market dynamics. When prices gravitate towards the upper band, it suggests potential overbought conditions, signifying that prices might have risen too far, too fast, potentially foreshadowing a reversal or corrective move. Conversely, when prices approach the lower band, it indicates potential oversold conditions, implying that prices might have fallen excessively and could be due for a rebound. Additionally, traders scrutinize Bollinger Band squeezes, characterized by a contraction of the bands, as they often precede significant price breakouts. By incorporating Bollinger Bands into their analytical toolkit, traders gain a nuanced understanding of price movements and volatility patterns, enabling them to make more informed decisions and better navigate the intricacies of financial markets.
6. Relative Strength Index (RSI)
The Relative Strength Index (RSI) stands as a pivotal momentum oscillator in the realm of technical analysis, offering traders a comprehensive measure of an asset's strength and potential overbought or oversold conditions. Conceived by J. Welles Wilder, the RSI compares the magnitude of recent price gains to losses over a specific time frame, typically 14 periods. This computation yields a value between 0 and 100, with readings above 70 often indicating overbought conditions, implying that the asset may have experienced excessive buying and could be due for a price correction. Conversely, readings below 30 signify potential oversold conditions, suggesting that selling pressure might have driven the asset's price too low and could lead to a rebound.
Traders wield the RSI as a versatile tool to uncover potential trend reversals and assess the underlying strength of an asset. By identifying divergence between the RSI and price movements, traders can pinpoint situations where momentum might be shifting before it becomes evident through price action alone. Moreover, the RSI's ability to generate signals when crossing key thresholds adds an element of decisiveness to trading strategies, guiding traders on when to buy or sell based on the prevailing market sentiment. With its capacity to unveil underlying market dynamics, the RSI empowers traders with a deeper comprehension of asset behavior, enabling them to make more informed decisions and navigate market fluctuations with greater confidence.
7. Fibonacci retracement
Fibonacci analysis, rooted in the pioneering work of Leonardo Fibonacci, has become an essential tool in technical analysis, guiding traders and analysts in deciphering potential price levels, retracements, and extensions within financial markets. The Fibonacci sequence, a mathematical progression where each number is the sum of the two preceding ones (1, 1, 2, 3, 5, 8, 13, and so on), forms the foundation of this technique. In trading, Fibonacci ratios such as 0.618 (Golden Ratio), 0.382, and 0.236 are applied to various price movements to identify significant levels of support and resistance. These ratios, when combined with key price points, create Fibonacci retracement and extension levels that aid in predicting potential price reactions and trend continuations.
Traders utilize Fibonacci analysis to comprehend price patterns, predict reversals, and identify areas of interest for market entry or exit. The technique's widespread application spans across different timeframes and asset classes, making it a versatile tool for both short-term traders seeking precise entries and long-term investors analyzing broader trends. By integrating Fibonacci ratios with chart patterns, trendlines, and other technical indicators, traders can enhance their decision-making processes, improve risk management, and gain a deeper understanding of market psychology as reflected in price movements.
8. Ichimoku Cloud
The Ichimoku Cloud, a distinctive and comprehensive technical indicator developed by Goichi Hosoda, stands as a multifaceted analytical tool that provides traders with a holistic view of an asset's price action and potential trend direction. Comprising five lines and a shaded area, the Ichimoku Cloud offers a layered perspective that transcends traditional technical analysis. At its core, the indicator features the Senkou Span A and Senkou Span B lines, which, when combined, form the cloud-like area on the chart. The cloud serves as a dynamic support and resistance zone, with its thickness reflecting market volatility and potential trend shifts. The Tenkan-sen and Kijun-sen lines, akin to fast- and slow-moving averages, contribute to the indicator's depth by indicating current momentum and trend direction. Finally, the Chikou Span, plotted backward, provides insights into the relationship between current and past prices.
Traders and analysts employ the Ichimoku Cloud for its comprehensive insights into market conditions. The cloud's shifting nature offers early indications of potential trend changes, while crossovers between the Tenkan-sen and Kijun-sen lines provide buy or sell signals. Furthermore, the Ichimoku Cloud accommodates various timeframes, catering to both short-term and long-term trading strategies. Its intricate combination of lines and the cloud presents traders with a holistic picture of price dynamics, enhancing decision-making through a blend of trend analysis, momentum assessment, and support/resistance identification.
9. Standard deviation
The Standard Deviation indicator, a fundamental component of technical analysis, offers traders a quantitative tool for assessing the volatility and dispersion of price data within a given trading period. By quantifying the degree of variability in prices around their average or mean, this indicator aids in comprehending market dynamics and potential price fluctuations. Computed by analyzing the differences between each data point and the mean, squaring these differences, averaging the squared values, and finally taking the square root of the result, the Standard Deviation indicator produces a numerical value that represents the degree of price dispersion. A higher value suggests greater market volatility and potential risk, while a lower value indicates more stable and predictable price movements.
Traders harness the Standard Deviation indicator to achieve a variety of objectives. Firstly, it helps identify periods of heightened market volatility, guiding traders to exercise caution or implement risk management strategies during times of potential turbulence. Secondly, it contributes to the assessment of potential price targets and support/resistance levels. By recognizing how price data typically deviates from the mean, traders can anticipate potential price levels at which reversals or trend changes might occur. Furthermore, the Standard Deviation indicator can be employed in conjunction with other technical tools to fine-tune trading decisions and develop strategies that align with prevailing market conditions. Its quantitative approach to measuring volatility enhances traders' ability to make informed choices and navigate market uncertainty with a greater degree of confidence.
10. Average Directional Index (ADX)
The Average Directional Index (ADX), a pivotal technical indicator, empowers traders with insights into the strength of a prevailing trend and the potential for trend reversals. Developed by J. Welles Wilder, the ADX operates in conjunction with two companion lines, the Positive Directional Index (+DI) and the Negative Directional Index (-DI). The +DI line gauges upward movement's strength, while the -DI line measures downward movement's strength. The ADX itself is a non-directional indicator, designed to quantify the intensity of the trend rather than its direction.
The ADX is particularly valuable for traders seeking to gauge the robustness of trends and assess their suitability for trading strategies. When the ADX value is ascending, it suggests an intensifying trend, while a descending ADX indicates a weakening trend or a market in consolidation. A low ADX reading may signify a lack of trend, while a high ADX reading implies a strong, sustainable trend. Traders often use the ADX alongside other technical indicators, such as moving averages or trendlines, to validate the strength of a trend before executing trades. This versatile indicator plays a vital role in enhancing traders' ability to navigate markets by offering a quantifiable measure of trend strength and aiding in the identification of opportune entry and exit points.

How To Add Indicators & Financials To Your ChartIn this Tradingview tutorial video, we take a look at how to add indicators & financials to your chart.
We'll discuss how to access them, where you can go to learn more about the specific indicator/financial & what you can do in order to customize there appearance and/or location on your chart.
If you have any questions please leave them below & I promise that I'll respond.
See you guys next video!
Akil

BRIEFING Week #32 : Crypto Squeeze in PreparationHere's your weekly update ! Brought to you each weekend with years of track-record history..
Don't forget to hit the like/follow button if you feel like this post deserves it ;)
That's the best way to support me and help pushing this content to other users.
Kindly,
Phil

Continental CON Long term bullish cycleOur probability indicator has observed Long Term BOS (Break-of-Structure) on Daily TF.
Essentially what that means is that we closing in on bearish cycle for XETR:CON and new bullish leg is forming for longterm continuation of new bullish cycle.
We expect further bearish correction to 68.30 - 64.80 zone ( Current Inverse H&S pattern support zone ) where conditions for perfect LONG entry occur.
Take-Profit should be set within High resistance zone 114.50 - 139.30

BRIEFING Week #31 : Big Names Earnings this weekHere's your weekly update ! Brought to you each weekend with years of track-record history..
Don't forget to hit the like/follow button if you feel like this post deserves it ;)
That's the best way to support me and help pushing this content to other users.
Kindly,
Phil

A combination of Stochastic and RSI indicatorsHello?
Traders, welcome.
If you "Follow", you can always get new information quickly.
Please also click "Boost".
Have a good day.
-------------------------------------
(Strength indicator)
The strength indicator will also be explained gradually.
Today, I would like to talk about how to interpret the indicators consisting of the Stochastic indicator and the RSI indicator.
It is set as below.
1. RSI indicator
ta.ema(rsi, 14)
For the setting value of the RSI indicator, we used the most frequently used value of 14.
2. Stochastic indicators
ta.sma(ta.stoch(close, high, low, 20), 12)
As the setting values of the stochastic indicator, as shown in the above formula, the setting values of 20 and 12 were used.
An important way to interpret
1. Stoch > RSI: likely to show an uptrend
2. Stoch < RSI: likely to show a downtrend
but,
1. If the Stoch indicator rises below 30, it is likely to show an uptrend.
2. If the Stoch indicator falls above 70, it is likely to show a downtrend
thus,
1. When Stoch > RSI, start split buying.
2. When Stoch < RSI, start split selling.
In that sense, I used the fill function to make it appear orange (#ff9800) when it is rising, and blue (#00bcd4) when it is falling.
It's best to understand the detailed information about all the indicators and use them, but be careful because if you study too deeply, your thoughts can become trapped in them.
Therefore, unless you are going to create a new indicator by directly utilizing the formula, it is recommended to understand and use only the core interpretation method of the indicator.
Since the stochastic indicator is an indicator of the price position within a certain period of time, it is recommended to use a set value suitable for your investment period, as it can indicate different results depending on how you set the set value.
As I said above, I used the settings of 20, 12.
The RSI indicator is an indicator of strength.
Therefore, when the price enters the overbought zone, the uptrend is at its highest, so once it exits the overbought zone, the likelihood of a downtrend increases.
Conversely, when the price enters the oversold zone, the downtrend is at its highest, so once it exits the oversold zone, it is likely to show an uptrend.
Therefore, it is not recommended to react in advance by thinking that price volatility will inevitably occur when a stock enters an overbought or oversold zone.
The key to the RSI indicator is to respond when it enters the oversold zone and exits the oversold zone, and when it enters the overbought zone and exits the overbought zone.
This is because if a full-fledged uptrend has begun, the RSI indicator may remain in the overbought zone.
Therefore, it is not a good idea to judge the situation based on all indicators alone.
The above is not a big deal, but I think it is a combination of indicators that makes it very intuitive to know whether or not the chart you are looking at is a chart you can start trading with.
We will go into more detail when we discuss how to find support and resistance points for that indicator.
-------------------------------------------------- -------------------------------------------
** All descriptions are for reference only and do not guarantee profit or loss in investment.
** Even if you know other people's know-how, it takes a considerable period of time to make it your own.
** This is a chart created with my know-how.
---------------------------------
Ascending Triangle pattern breakout in CUMMINSINDCUMMINS INDIA LTD
Key highlights: 💡⚡
✅On 1Day Time Frame Stock Showing Breakout of Ascending triangle Pattern .
✅ Strong Bullish Candlestick Form on this timeframe.
✅It can give movement up to the Breakout target of 2050+.
✅Can Go short in this stock by placing a stop loss below 1920-.

LINK ChainLink Growth Thesis | Trading at 52 week low Chainlink (LINK) is currently displaying a bullish signal as it bounces from its last support level. This price action indicates renewed buying interest and suggests a potential upward movement for the cryptocurrency.
Chainlink (LINK) has established numerous partnerships across the blockchain and cryptocurrency ecosystem. Some notable collaborations include:
Google Cloud: Chainlink partnered with Google Cloud to integrate its oracle services and bring real-world data onto smart contracts deployed on the Google Cloud platform.
SWIFT: Chainlink collaborated with SWIFT, the global provider of secure financial messaging services, to explore how Chainlink's decentralized oracle network can enhance SWIFT's cross-border payments infrastructure.
Oracle: Chainlink has a strategic collaboration with Oracle, a leading provider of enterprise-grade software and cloud solutions. This partnership aims to integrate Chainlink's decentralized oracle technology into Oracle's Blockchain Platform, enabling secure and reliable connectivity between smart contracts and external data sources.
Binance: Chainlink partnered with Binance, one of the largest cryptocurrency exchanges globally, to support the development and growth of the decentralized finance (DeFi) ecosystem. This collaboration aims to provide secure and reliable data feeds to power various DeFi applications on the Binance Smart Chain.
Polkadot: Chainlink has integrated with Polkadot, a multi-chain platform that enables interoperability between different blockchains. This partnership allows Chainlink's oracles to provide off-chain data to smart contracts deployed on the Polkadot network.
Hedera Hashgraph: Chainlink collaborated with Hedera Hashgraph, a decentralized public network, to enable developers to leverage Chainlink's oracles for accessing real-world data on the Hedera network. This integration enhances the security and reliability of smart contracts built on Hedera Hashgraph.
Based on this analysis, there is a potential price target of $8.70 for LINK.
Looking forward to read your opinion about it!

The Phenomenon of Alpha DecayIntroduction:
In the realm of cryptocurrency investing, patterns are often perceived, strategies are formed, and indicators are developed to capture potential opportunities. However, there's an underlying factor that traders and investors must be aware of: the concept of alpha decay. Here, we will delve into the nuances of alpha decay, especially in the context of MVRV Z-score, and how market participants have evolved their strategies over various bull cycles.
Alpha Decay in Cryptocurrency Investing:
At its core, alpha represents the excess return of an investment relative to the return of a benchmark index. As certain strategies become popular and more investors adapt them, the advantage (or alpha) of that strategy diminishes. This is referred to as alpha decay. This phenomenon is especially noticeable in markets as dynamic and rapidly evolving as cryptocurrency.
MVRV Z-Score and the Bull Cycles:
MVRV Z-score is a metric that gauges the difference between the market value and realized value of a particular cryptocurrency, typically Bitcoin. Historically, peaks in the MVRV Z-score have coincided with market tops, making it a valuable tool for investors.
2013-2014 Bull Cycle:
The 2013-2014 cycle witnessed a sharp peak in the MVRV Z-score, aligning closely with the market peak. This made it an excellent tool for identifying market tops.
2017-2018 Bull Cycle:
Interestingly, the 2017-2018 bull cycle saw the MVRV Z-score peak slightly earlier than the market peak. This discrepancy suggests that informed traders may have been "front-running" the indicator, leading to alpha decay. As more participants became aware of the indicator and its predictive capabilities, its effectiveness diminished.
2021 Bull Cycle:
The second peak of the 2021 bull cycle again showcased the phenomenon of front-running. The divergence between the MVRV Z-score peak and the market peak was even more pronounced, highlighting the diminishing alpha and adaptation of market participants.
Indicators and Alpha Decay:
While many indicators suffer from alpha decay as market participants adapt, some metrics are inherently protected. A prime example is the unrealized profit/loss metric. This indicator measures the profitability of users, giving insights into the potential behavior of a cohort of traders. As it is based on aggregate behavior rather than predictive patterns, it's less susceptible to front-running and retains its relevance over time.
Conclusion:
As the cryptocurrency market matures, tools and indicators will continuously evolve, and alpha decay will remain an inherent challenge. Investors must be aware of this phenomenon, continuously adapt, and diversify their toolkits. Relying solely on historically reliable indicators can be misleading, and thus, an understanding of the underlying dynamics and broader market behavior becomes paramount.
It's worth noting that as markets evolve and new data emerges, so too will the strategies and tools used to interpret them. Thus, always stay updated, be adaptable, and never rely solely on a single indicator for decision-making.

BRIEFING Week #30 : Central Bank Show !Here's your weekly update ! Brought to you each weekend with years of track-record history..
Don't forget to hit the like/follow button if you feel like this post deserves it ;)
That's the best way to support me and help pushing this content to other users.
Kindly,
Phil

The Fundamental Concepts of Technical IndicatorsTrading indicators are essential tools used by traders and investors to analyze price data, identify trends, and make informed decisions in financial markets. They provide valuable insights into market dynamics, helping market participants gain a competitive edge. This comprehensive explainer will delve into what trading indicators are, how they are utilized, and the differences between two prominent strategies: trend following and mean reversion. Additionally, we will explore the importance of using binary and discrete indicators together to enhance trading effectiveness.
Part 1: Understanding Trading Indicators
1.1 Definition of Trading Indicators
Trading indicators are mathematical calculations based on price, volume, or open interest data that provide graphical representations of market conditions. These calculations help traders visualize price trends, momentum, volatility, and potential reversals. Indicators serve as a supplementary layer of analysis, offering a structured and objective approach to interpreting market behavior.
1.2 Types of Trading Indicators
Trend Indicators: Identify the direction and strength of prevailing trends, such as Moving Averages (MA), Moving Average Convergence Divergence (MACD), and Ichimoku Cloud.
Oscillators: Measure overbought and oversold conditions, such as Relative Strength Index (RSI), Stochastic Oscillator, and Commodity Channel Index (CCI).
Volume Indicators: Assess trading volume to confirm price movements, like On-Balance Volume (OBV) and Volume Weighted Average Price (VWAP).
Volatility Indicators: Gauge the level of price fluctuations, including Bollinger Bands and Average True Range (ATR).
Part 2: Utilizing Trading Indicators
2.1 Trend Following Strategy
Trend following is a popular trading strategy that capitalizes on the continuation of established trends. Traders using this approach seek to identify uptrends or downtrends and ride them for extended periods. Trend following indicators are ideally suited for identifying the direction of a trend and capturing profits during strong market movements.
Example of Trend Following Indicator: Fourier Smoothed Stochastic (FSTOCH)
(Indicators like the FSTOCH help traders reveal underlying trends in the market)
The Fourier Smoothed Stochastic is an advanced tool that utilizes the Stochastic Oscillator in combination with Fourier Transform analysis to identify and ride prevailing trends. By providing smoother signals, it helps traders stay on course with the established trend, allowing for more accurate entries and exits. Its ability to filter out market noise makes it an ideal choice for trend followers seeking a clearer view of market momentum, enabling them to capitalize on prolonged price movements.
2.2 Mean Reversion Strategy
Mean reversion is a counter-trend strategy that assumes prices will revert to their average or mean over time. Traders using this approach aim to profit from price reversals when an asset's price deviates significantly from its historical average. Mean reversion indicators are ideal for identifying overbought and oversold conditions and anticipating potential reversals.
Example of Mean Reversion Indicator: Bollinger Bands Percentile (BBPct)
(The BBPct indicator marks out price extremes which may lead to potential reversals)
The BBPct (Bollinger Bands Percent) is an indicator designed for mean reversion trading strategies. It utilizes Bollinger Bands to determine overbought and oversold conditions in the market. The indicator calculates the percentage of the current price's position within the Bollinger Bands' upper and lower boundaries. When the price is near the upper band, it suggests an overbought condition, indicating a potential mean reversion towards the lower band. Conversely, when the price is close to the lower band, it indicates an oversold condition, suggesting a possible mean reversion towards the upper band. Traders can use this information to identify potential reversal points and make informed decisions to capture price movements back towards the mean.
Part 3: Trend Following vs. Mean Reversion
3.1 Key Differences
Direction: Trend following aims to identify and ride established trends, while mean reversion seeks to capitalize on price reversals.
Risk Profile: Trend following strategies typically involve higher risk, as traders enter positions in the direction of the trend, which may be challenging to time accurately. Mean reversion strategies are often considered less risky as traders expect price reversals to occur relatively soon after significant deviations from the mean.
Market Conditions: Trend following tends to perform well in trending markets, while mean reversion thrives in ranging or sideways markets.
3.2 Combining Trend Following and Mean Reversion
While trend following and mean reversion strategies have distinct approaches, they can complement each other when used in confluence. Combining both strategies can provide a more comprehensive view of the market and reduce reliance on a single indicator. For example:
Confirming Trend Reversals: Mean reversion indicators can be used to confirm potential trend reversals identified by trend-following indicators, increasing the probability of successful entries and exits.
Managing Risk: Trend following indicators can help traders stay in trends longer and avoid premature exits when using mean reversion strategies.
Identifying Range-Bound Markets: Mean reversion strategies can be employed during periods of low volatility or when the market lacks a clear trend, while trend following indicators can be set aside until a new trend emerges.
Part 4: Binary and Discrete Indicators
4.1 Binary Indicators
(The Super Schaff gives out binary signals when it detects a potential change in trend)
Binary indicators provide straightforward, yes-or-no signals, indicating the presence or absence of a particular condition. Examples include Moving Average Crossovers and Super Schaff, which produce buy (long) or sell (short) signals when specific conditions are met.
4.2 Discrete Indicators
(The Volume-Trend Sentiment displays the overall implied sentiment based on volume and price action)
Discrete indicators generate signals based on a range of values or levels. These indicators offer more nuanced insights into market conditions, allowing traders to interpret the strength or weakness of signals. Examples include RSI and VTS.
Part 5: The Importance of Using Both
5.1 Diverse Perspectives
Combining binary and discrete indicators provides traders with diverse perspectives on market conditions. Binary indicators offer clear entry and exit signals, while discrete indicators offer a finer understanding of price trends and potential turning points.
5.2 Enhanced Decision-Making
Using both types of indicators helps traders make more informed and confident decisions. By cross-referencing binary and discrete signals, traders can filter out false signals and identify high-probability trading opportunities.
Conclusion:
Trading indicators play a vital role in modern financial markets, providing traders and investors with valuable insights into price trends, momentum, and market conditions. Trend following and mean reversion strategies offer distinct approaches to trading, each with its unique advantages and risk profiles. However, combining these strategies and utilizing both binary and discrete indicators can provide a comprehensive and powerful toolkit for traders seeking consistent success in the dynamic world of finance.
Check out the indicators mentioned in this post:
