BRIEFING Week #25 : the Liquidity Will Decide Now !Here's your weekly update ! Brought to you each weekend with years of track-record history..
Don't forget to hit the like/follow button if you feel like this post deserves it ;)
That's the best way to support me and help pushing this content to other users.
Kindly,
Phil
Indicators

Ninja Talks EP 15: Indicators Vs Naked( Warning - May cause offense and distress)
It's a tale as old as the markets themselves - to use indicators or to not use indicators, that is the question.
And to bring the answers you so desire it's none other than yours unruly - me, Ninja Nick! So buckle up because my way is totally biased, based, unapologetic and of course 100% correct forever and always.
Now on with the show...
I'd like to take this opportunity to apologize to absolutely nobody! The pure price action specialist does whatever the fook he wants.
I hope that answers the question of what side I'm on - for those that didn't get the Conor McGregor reference, I'm against trading indicators - with one caveat...
* ...I understand that people can make them work, I'm not saying they're useless, but for me in my over 10 years of experience I'm yet to see one that jumps out at me like a supermodel in the street.
So with that said, here are some reasons I personally loathe, hate and despise (most) trading indicators:
(1) They're BS marketing techniques - case in point, the founder of the MACD said he gave it an acronym name because acronym products create more mystery and sell better. And he's not wrong, but still, BS marketing technique.
(2) Too many variables to take into consideration before placing a trade and for someone that practices KISS (Keep it Simple Stupid) I find it's complexity more offensive than putting ketchup on a steak.
(3) Your charts look like an A.I rendition of a Pablo Picasso painting, so for that brilliant reason I'm out.
(4) The data is lagging - we already get the milk skimmed off out Tea by complex algorithms so why would I outsource my decision making further to baby Terminator? Not on my watch - I won't be back.
(5) I love pure price action and I don't know why, I've tried everything over my vast learning curve from financial filings, indicators, depth of market trading, algorithms, you name it I've fumbled with it and I can confidently say without a shadow of a doubt that my genius would be nothing without a pure virgin chart as my canvas.
So that's all for this episode, if you liked this then follow and drop a like for the algo (the good kind).
And always remember, keep your blades sharp Ninja!
Nick

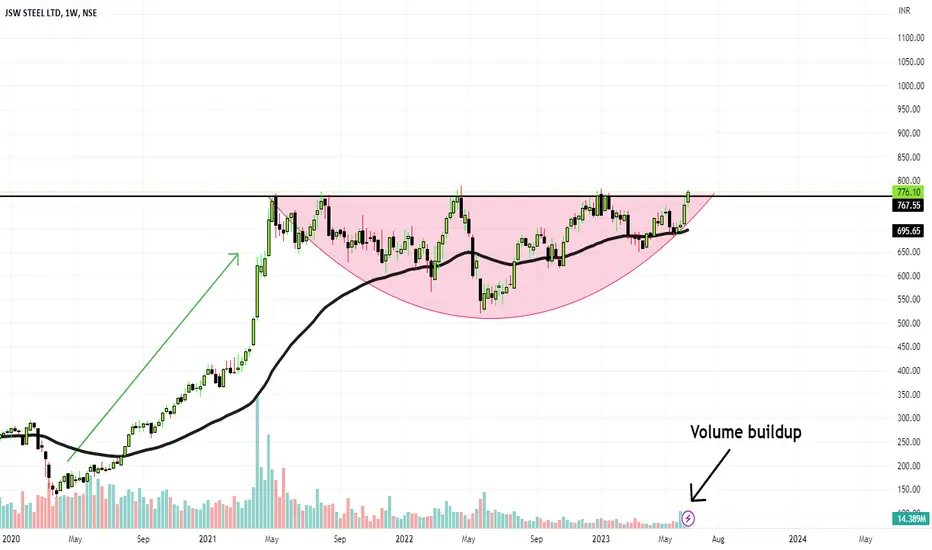
JSW Weekly Review After a long Time Breakout Happened in JSW
1.Strong Volume Buildup
2. market stand at breakout area
CYBR CyberArk Software and the Cyber WarfareCyberArk focuses on privileged access security solutions, helping organizations protect against cyber threats targeting privileged accounts and credentials.
In light of the recent news regarding cyberattacks on multiple U.S. government agencies, it is reasonable to expect an increased focus on cybersecurity measures, which could potentially benefit cybersecurity stocks in the market. These attacks highlight the vulnerabilities present in the software systems used by government entities, underscoring the urgent need for robust cybersecurity solutions.
The fact that the U.S. Cybersecurity and Infrastructure Security Agency is actively investigating the breach indicates the seriousness of the situation and the government's commitment to addressing these security threats. As such, there may be a heightened emphasis on strengthening cybersecurity infrastructure and investing in advanced technologies to defend against future attacks.
The reported involvement of a Russian-speaking hacking group known as CLOP in previous attacks serves as a reminder of the persistent and evolving nature of cyber warfare. This continuous threat landscape necessitates ongoing innovation and investment in cybersecurity.
Considering these factors, cybersecurity stocks have the potential to experience an upward trajectory. Companies specializing in threat intelligence, network security, endpoint protection, and data encryption could be in high demand as organizations and governments seek to fortify their defenses against cyber threats.
My Price Target for CYBR is $163 by the end of the year.
Looking forward to read your opinion about it!

Manage Input variables with Pine Script v5Welcome to this new tutorial that helps traders and investors better understand the powerful Pine Script programming language v5.
In this tutorial, we will program together three Input variables:
Color type Input: a color input is a parameter that allows specifying a custom color for the indicator or script. It can be used to set the color of lines, areas, texts, or other graphical components in the indicator.
Float type Input: a float input is a parameter that allows specifying a floating-point numerical value for the indicator or script. It can be used to set parameters such as threshold levels, indicator sizes, or any other numerical value that requires decimal precision.
Integer type Input: an integer input is a parameter that allows specifying an integer numerical value for the indicator or script. It can be used to set parameters such as moving average periods, length of a time interval, or any other integer numerical value.
IMPORTANT: The code used in this tutorial has been created purely for educational purposes.
Our indicator is a simple indicator that plots the close data of the underlying asset on the chart in a weighted manner. The displayed data is the sum of the close price plus 20%. The goal of the indicator is to provide a fully dynamic tool that can vary its parameters from the user interface and update automatically.
Here is the complete code for this tutorial:
//@version=5
indicator("Input Tutorial", overlay = false)
pond = input.float(defval = 0.20, title = "Float", minval = 0.10, maxval = 1, step = 0.10)
color_indicator = input.color(defval = color.red, title = "Color")
data = close + (close * pond)
linewidth_feature = input.int(defval = 1, title = "Integer", minval = 1, maxval = 10, step = 1)
plot(close, color = color_indicator, linewidth = linewidth_feature)
//@version=5
Indicates the version of the Pine Script language used in the code.
indicator("Input Tutorial", overlay = false)
Set the name of the indicator as "Input Tutorial", and overlay=false indicates that the indicator should not overlap the main chart.
pond = input.float(defval = 0.20, title = "Float", minval = 0.10, maxval = 1, step = 0.10)
Create a float input called "pond" with a default value of 0.20. The input title is "Float", and the minimum value is 0.10, the maximum value is 1, and the step is 0.10.
color_indicator = input.color(defval = color.red, title = "Color")
Create a color input called "color_indicator" with a default value of red color. The input title is "Color".
data = close + (close * pond)
Calculate a new value "data" by adding the closing price value with the closing price multiplied by the "pond" input.
linewidth_feature = input.int(defval = 1, title = "Integer", minval = 1, maxval = 10, step = 1)
Create an integer input called "linewidth_feature" with a default value of 1. The input title is "Integer", and the minimum value is 1, the maximum value is 10, and the step is 1.
plot(close, color = color_indicator, linewidth = linewidth_feature)
Plot the chart of the closing value with the color specified by the "color_indicator" input and the line width specified by the "linewidth_feature" input.

BRIEFING Week #24 : The Central Banks Show... Again !Here's your weekly update ! Brought to you each weekend with years of track-record history..
Don't forget to hit the like/follow button if you feel like this post deserves it ;)
That's the best way to support me and help pushing this content to other users.
Kindly,
Phil

The panpanXBT Bitcoin risk IndicatorHi Fellow Traders and Investors,
Today, I want to look into this brand new hot off the presses indicator, THE BITCOIN RISK. The focus of this indicator is the risk levels of bitcoin in real time.
It's color coded and fairly straight forward and simple. it's best use is for long term investors not so much for day trading. It can be coupled with other indicators to make confluence and confirmation. for example the RSI and this indicator are very powerful when coupled together from what I have seen. As we can see it is still very early in the bull run and still a very good time to be making purchases. How accurate this indicator will be going forward? Unfortunately, only time will tell, as I'm fairly sure it's been retro fit in some way to work.
I have no affiliation with the creator and have no personal gain. I found this indicator, was granted use of it and found it useful, so, I am passing it along. If you are interested in it, you have to get a hold of the creator. Down below is an overview in the words of the creator.
Here is a quick explanation from the creator himself...
Here's a quick overview of what the model is based on and how it can provide value:
"The panpanXBT Bitcoin Risk Metric is powered by regressing 'fair value' data. The errors are adjusted to account for diminishing returns using a fitted exponential curve. The result is a channel that Bitcoin price has historically bounced between.
Users can quickly identify periods of extreme under and overvaluation, which could present great investing opportunities."

BRIEFING Week #23 : Ticking TimeBomb on CryptosHere's your weekly update ! Brought to you each weekend with years of track-record history..
Don't forget to hit the like/follow button if you feel like this post deserves it ;)
That's the best way to support me and help pushing this content to other users.
Kindly,
Phil

Next Steps: Introduction to Pine ScriptWelcome back, traders! In our previous video, we took our first steps into Pine Script™ and learned about creating indicators. Today, we're going to dive deeper into the Pine Script™ landscape and provide some valuable pointers to guide you on your journey of mastering Pine Script™. So let's get started!
The first important distinction we need to make is between "indicators" and "strategies" in Pine Script™. Indicators are primarily used for calculations and displaying information on charts. They are lightweight and don't require the broker emulator, making them faster to execute. You can use indicators to analyze market data and generate visual representations of technical analysis tools, such as moving averages, oscillators, and custom calculations. Indicators are a great choice when you don't need to backtest your strategies.
On the other hand, strategies are used for backtesting and forward testing. They include trade order functionality and can simulate trade executions. With strategies, you can define entry and exit conditions, apply risk management rules, and evaluate the performance of your trading ideas. Strategies provide detailed backtest results in the "Strategy Tester" tab, located next to the "Pine Script™ Editor" tab. They allow you to assess the historical performance of your trading strategy before deploying it in live markets.
Now, let's talk about how scripts are executed in Pine Script™. Unlike traditional programming languages, Pine Script™ runs in a loop-like fashion, executing once on each bar of the chart from left to right. Historical bars refer to those that have already closed when the script executes on them, while the last bar, known as the realtime bar, remains open. The script then executes whenever a price or volume change is detected and once again when the realtime bar closes. This execution model enables real-time monitoring of market conditions and the opportunity to react to price and volume movements.
It's important to note that the script doesn't recalculate on historical bars during realtime execution. This optimization improves efficiency by avoiding unnecessary calculations on past data that have already been processed. Pine Script™ provides this performance enhancement by storing the calculated values of historical bars, allowing the script to focus on updating the current and future bars efficiently.
In Pine Script™, a fundamental concept is the time series. Time series are data structures that hold values for each bar the script executes on. They continuously expand as the script progresses through more bars. By using the history-referencing operator, which is denoted by square brackets , you can access past values of a time series. For example, close refers to the close value on the preceding bar, close refers to the close value two bars ago, and so on. This powerful feature allows you to incorporate historical data into your calculations and create complex trading algorithms.
It's crucial to understand the time series and how they differ from traditional arrays. While the indexing mechanism may resemble arrays, thinking in terms of arrays can be detrimental to understanding this key Pine Script™ concept. Time series in Pine Script™ expand dynamically with each bar, and their values are automatically updated as new data becomes available. This dynamic nature enables you to create adaptive and responsive trading strategies that take into account changing market conditions.
Moving on, let's discuss script publishing. TradingView is a vibrant community of Pine Script™ programmers and traders from around the world. Once you become proficient in Pine Script™, you have the option to share your scripts with others. Before publishing, ensure your scripts are original and well-documented. All publicly published scripts undergo analysis by TradingView's moderators and must comply with Script Publishing Rules. These rules maintain the quality and integrity of the scripts available on the platform.
If you prefer to use your Pine scripts for personal use, you can simply write them in the Pine Script™ Editor and add them to your charts without publishing them. However, if you want to share your scripts with a select group of individuals, you can publish them privately and provide your friends with the browser link to your private publication. This way, you can collaborate with others and receive valuable feedback on your scripts.
To navigate the Pine Script™ documentation effectively, it's essential to spend time exploring the available resources. Our main documentation sources are the Pine Script™ v5 User Manual and the Pine Script™ v5 Reference Manual. The User Manual provides comprehensive explanations and examples to help you grasp the fundamentals of Pine Script™. The Reference Manual serves as a detailed reference guide, documenting the functions, variables, and keywords available in Pine Script™. It's a valuable tool for every Pine Script™ programmer and is essential for writing scripts of reasonable complexity.
Remember to consult the documentation corresponding to the version of Pine Script™ you are working with. It's crucial to stay up to date with the latest advancements and improvements in Pine Script™ by regularly checking the Release Notes.
That wraps up our introduction to Pine Script™ and its landscape. We hope you found these insights helpful in your journey to become a proficient Pine Script™ programmer and trader. Remember to practice, explore, and experiment with the concepts we discussed today. By combining time series with the built-in functions designed to handle them efficiently, you'll be amazed at what you can accomplish with just a few lines of Pine Script™ code.
Thank you for joining us today, and we wish you success in mastering Pine Script™ and achieving your trading goals!

First Steps: Introduction to Pine Script Welcome back, fellow traders, to another exciting episode of our Pine Script™ journey! In our previous video, we explored how to use existing scripts and indicators on TradingView. Today, we'll take the next step and dive into the fascinating world of reading and writing Pine Script™.
In this episode, we'll focus on the fundamental aspects of reading Pine Script™ code and understanding its structure. By studying the code written by talented programmers, we can gain valuable insights and improve our own understanding of the language.
Reading code written by proficient programmers is the most effective way to enhance your knowledge of any programming language, and Pine Script™ is no exception. Luckily, there are numerous reliable sources for high-quality code on TradingView.
To start, you can explore the built-in indicators provided by TradingView. These indicators serve as excellent examples of well-written code. Simply load an indicator on your chart and hover over its name to access the "Source code" icon. Clicking on this icon will open the Pine Script™ Editor, where you can view the indicator's code.
The Pine Script™ Editor allows you to explore and modify the code. If you want to experiment with a specific indicator, you can make a copy of the code by selecting "Make a copy" from the "More" menu. This way, you can freely modify and save your changes without affecting the original indicator.
Another fantastic resource for reading code is the vast collection of Community Scripts on TradingView. These scripts, created by talented traders and programmers like yourself, offer a wealth of inspiration and knowledge. When browsing through Community Scripts, look for scripts without a gray or red "lock" icon, indicating that they are open-source.
Opening a script's page allows you to view its source code. By examining different scripts, you can gain insights into various trading strategies and techniques. This exposure to different coding styles will broaden your understanding of Pine Script™ and help you improve your own coding skills.
Now that we've explored reading code, it's time to unleash our creativity and start writing our own Pine Script™ scripts. Whether you're a beginner or an experienced programmer, Pine Script™ provides a user-friendly yet powerful platform for developing indicators, strategies, and even libraries.
Pine Script™ empowers us to write three types of scripts: indicators, strategies, and libraries. Indicators, like RSI and MACD, help us analyze market data. Strategies, on the other hand, include trading logic and can be backtested and forward-tested. Lastly, libraries enable advanced programmers to create reusable functions for other scripts.
I invite you all to embark on this exciting journey of writing your first indicator. With Pine Script™, we have a language that is both approachable for beginners and flexible enough for advanced traders. Let's unlock our creativity and develop trading tools tailored to our unique strategies.
Thank you for joining me today as we explored the art of reading and writing Pine Script™. Stay tuned for the next episode, where we'll dive deeper into writing indicators and unleash the full potential of this remarkable language. Until then, keep trading with passion and continue honing your coding skills!

Solana SOL and the US Debt CeilingNegotiators from Democratic and Republican parties finalized an agreement on Sunday night.
Instead of raising the limit to a specific level, they have opted to suspend it entirely until 2025. This strategic move ensures that their bills can be paid until that date, while also guaranteeing that the next battle to raise the ceiling will not coincide with the upcoming presidential election.
The resolution of the debt ceiling issue brings optimism and stability to the financial landscape, which has a positive ripple effect on the cryptocurrency market.
Bitcoin and the broader crypto market stand to benefit from increased investor confidence, reinforced safe-haven status, enhanced institutional adoption, regulatory clarity, and the overall positive impact on global markets.
SOL/USDT
Entry Range: $19 - 21
Take Profit 1: $23
Take Profit 2: $25
Take Profit 3: $27
Stop Loss: $17

Cardano ADA and the US Debt CeilingNegotiators from Democratic and Republican parties finalized an agreement on Sunday night.
Instead of raising the limit to a specific level, they have opted to suspend it entirely until 2025. This strategic move ensures that their bills can be paid until that date, while also guaranteeing that the next battle to raise the ceiling will not coincide with the upcoming presidential election.
The resolution of the debt ceiling issue brings optimism and stability to the financial landscape, which has a positive ripple effect on the cryptocurrency market.
Bitcoin and the broader crypto market stand to benefit from increased investor confidence, reinforced safe-haven status, enhanced institutional adoption, regulatory clarity, and the overall positive impact on global markets.
ADA/USDT short
Entry Range: $0.35 - 0.37
Take Profit 1: $0.40
Take Profit 2: $0.43
Take Profit 3: $0.46
Stop Loss: $0.32

And now some cautionary chartsTraders,
Though my post yesterday reflected more bullish sentiment, I would be remiss not to acknowledge a few of the contrarian indications that I am also spotting on various charts which suggest we could still experience more of a drawback in crypto before Bitcoin crosses to the topside of that all-pervasive $30,500 resistance overhead. Let’s take a look at a few of the charts which seem to suggest this possibility.
#1. DXY
The dollar is now expected to continue moving up in strength. I see the next line of resistance at 105.6. Dollar UP + VIX UP = Stocks DOWN (generally).
#2. VIX
The fear index (VIX) is at a multi-year low. Considering all that is going on in the world recently, it is highly likely that the VIX will spike again soon taking us back above our 200 day moving average. Dollar UP + VIX UP = Stocks DOWN (generally).
#3. US500
I have been using our US500 chart to pattern what the rest of the market might do on a swing scale timeframe. I have been calling for a break down from the ascending red wedge. Should this occur, crypto is likely to follow.
#4. Bitcoin CME Futures
A new gap was created below us on the Bitcoin CME futures chart. 99% of all gaps are filled …usually sooner rather than later.
#5. Bitcoin (see current chart above)
Yesterday, I pointed out more than a few bullish indications for Bitcoin. But I also want to remind you that we’re not out of the woods yet.
One, I already mentioned that we have not defeated our overhead resistance, that big orange area above us along with the $30,500 mark.
Two, we have not confirmed a move above our orange neckline area.
Three, I was expecting more of a test in that green area below us which is the neckline of our larger Cup and Handle pattern. I was surprised that we did not get more of a test in that area. But, we still may.
I do not plan on selling my current trades, which are all in the profit, just yet. But should BTC dip back below that black trendline it is currently using for support, I just may.
Stew

BRIEFING Week #22 : Crypto Volatility ExpectedHere's your weekly update ! Brought to you each weekend with years of track-record history..
Don't forget to hit the like/follow button if you feel like this post deserves it ;)
That's the best way to support me and help pushing this content to other users.
Kindly,
Phil

How to use HA-Low and HA-High indicatorsHello?
Traders, welcome.
If you "Follow", you can always get new information quickly.
Please also click "Boost".
Have a good day.
-------------------------------------
(BTCUSD chart)
The HA-Low and HA-High indicators are paired indicators.
When supported by the HA-Low indicator, it corresponds to the time to buy, and when it rises to the vicinity of the HA-High indicator, it corresponds to the time to sell.
This is a basic principle of indicator design.
The HA-Low and HA-High indicators are indicators created for trading, so you can trade based on whether you are supported or resisted by these indicators.
In addition to the basic design mentioned above, support in each indicator, HA-Low and HA-High, corresponds to the time to buy, and resistance corresponds to the time to sell.
The basic design method is less psychologically burdensome, so it is easier than conducting transactions.
When you try to buy because it shows support in the HA-High indicator, it is likely to be a point near the recent high, so you actually have a psychological burden.
Therefore, for mechanical trading, it is best to choose a method of buying when supported near the HA-Low indicator and selling when it rises near the HA-High indicator as the basic design method.
Both HA-Low and HA-High indicators exist on each time frame chart.
Therefore, you can proceed with trading by looking at the time frame chart corresponding to the investment period according to your investment style.
The length of the horizontal line on the HA-Low and HA-High indicators will tell you if the current trend is up or down.
If the horizontal line of the HA-Low indicator is longer than the horizontal line of the HA-High indicator (HA-Low > HA-High), then the trend is likely to be up.
In the opposite case (HA-Low < HA-High ), it is likely to be in a downtrend.
Therefore, if you look at the 1M chart, you can interpret it as an overall downtrend.
On the other hand, if you look at the 1W chart, you can interpret it as an all-out upward trend.
Since it is judged to be in an upward trend on the 1W chart, what matters now is whether the HA-High indicator on the 1M chart falls and the length of the horizontal line becomes shorter than the HA-Low indicator.
Therefore, from a long-term perspective, the time to buy in earnest is when the HA-High indicator on the 1M chart declines and shows support at the point where it was created.
Looking at the relationship between the HA-Low and HA-High indicators on the 1D chart, it can be interpreted that there is a downward trend because the horizontal line of the falling HA-High indicator is longer than the horizontal line of the HA-Low indicator (HA-Low < HA-High). there is.
Therefore, in order to turn into an uptrend, the HA-High indicator on the 1D chart must be moved and created.
If not, even if it rises above 30215.26, the current HA-High indicator point on the 1D chart, the phenomenon of moving the HA-High indicator by shaking it up and down will eventually appear.
This is a necessary move to sustain the uptrend, as it is inevitable.
This concludes the method of trading using the HA-Low and HA-High indicators that I have been talking about for several months.
Regardless of which indicator is used, the most important thing is how long the movement has been confirmed, so the reliability of the indicator can be obtained.
Therefore, no matter which indicator is used to create a trading strategy, a long period of confirmation work must be done to suit the key interpretation method of that indicator.
-------------------------------------------------- -------------------------------------------
** All descriptions are for reference only and do not guarantee profit or loss in investment.
** Even if you know other people's know-how, it takes a considerable period of time to make it your own.
** This is a chart created with my know-how.
---------------------------------


EUR/USD - DO WE KEEP PUSHING DOWN?Hello everyone, what is EUR/USD next move? On higher TF's we see a big push to the downside but eventually the market is getting exhausted. We are waiting till the market makes a pushback to our 0.786 FIB level or just in between the 1 and the 0.7. If the bulls cant keep the market up we should get a push back further to the downside at our lower support zone.
UPDATES COMING SOON!
All information found here, including any ideas, opinions, views, predictions, suggestions. are for informational entertainment or educational purposes only and should not be construed as personal investment advice.

K.I.S.S or Keep it simple stupid In the markets, traders and investors frequently search for the optimal software tool that will produce reliable profits over the long term. Many traders believe that in order to get the best and most reliable signals they need to, find the perfect tool would need to include as many indications as feasible. The truth, however, is far different. let's explore this subject in more detail.
More is not better
Technical analysis is not a magical science that can provide traders with precise entry and exit signals with immediate gains. Trading is not an easy industry. Being a continuously effective trader needs persistence, fortitude, and frequently the capacity to endure times when things are not going well. It is just unavoidable for traders to avoid loses, and even a long-term lucrative approach cannot shield them from these situations. There is no such thing as trading with zero losses, as any seasoned trader is aware. Despite this, a lot of traders are still searching for the one simple answer that will, in their opinion, guarantee the most transactions that are successful while decreasing the number of trades that are losses.
Some people fear losses like the devil and would stop at nothing to prevent them. They believe that adding additional indicators and other tools with the primary objective of eliminating losing trades is the best course of action rather than starting from the beginning and attempting to comprehend what is really happening in the markets.
The individual indicators themselves are not problematic, but if traders begin mixing an excessive number of them with various lines and curves, things can quickly spiral out of control and produce a disorienting jumble.
Why traders do this ?
The desire to discover some "holy grail" solution, which will invariably result in winning trades with little to no losses (preferably none), is, of course the most popular motivation. Another factor could be the variety of seminars and training sessions available, or the current craze for social media videos. And after a few losses, novice traders start adding more and more indicators that should "improve" the original strategy but ends up leading to more loses down the line
The concept is that the more market indicators that support an entry signal, the more probable it is that the trade will be profitable is completely false.
Understand that the only "holy grail" that can assist a trader get greater results is to become adept at the psychological, fundamental and technical aspects of trading and to approach these activities as uncomplicatedly as possible. Inexperienced traders are typically duped by a variety of indicators and oscillators, which are meant to give the appearance that they are sophisticated tools made for experienced traders. They might function, but only to a certain extent. The price itself, which represents what is taking place in the market, should serve as the basis for a trader's decisions. As a trader you are better off keeping it simple(KISS)using robust and proven methodologies

BRIEFING Week #21 : Let's do our Regular Update !Here's your weekly update ! Brought to you each weekend with years of track-record history..
Don't forget to hit the like/follow button if you feel like this post deserves it ;)
That's the best way to support me and help pushing this content to other users.
Kindly,
Phil

Top 4 Secrets of Using Technical Indicators
Hey traders,
Technical indicators are an essential part of technical analysis .
With multiple different indicators on a chart, the trader aims to spot oversold/overbought conditions of the market and make a profit on that.
Though, I don't consider myself to be an expert in indicators trading, here are the great tips that will help you dramatically improve your trading with them.
#1️⃣ Do not overload your chart with indicators.
There is a fallacy among so many traders:
more indicators on the chart lead to an increase in trading performance.
Following this statement, traders add dozens of technical indicators to their charts.
The chart becomes not readable and messy.
The trader gets lost and makes wrong trading decisions.
Instead, add 1-2 indicators to your chart. That will be enough for you to make correct judgments. Do not overload your chart and try to make it clean: your task is to analyze the price action first and only then look for additional clues reading the indicators.
#2️⃣ Learn what exactly the indicator shows
The data derived from technical indicator must make sense to you.
You must understand the logic behind its algorithm.
You must know exactly what it shows to you.
Confidence in your actions plays a key role in trading.
During the periods of losing streaks and drawdowns, many traders drop their trading strategies. It happens because they lose their confidence.
You will be able to overcome negative trading periods only by being confident in your actions.
Only knowing exactly what you do, what do you rely on and why you can proceed even in dark times.
#3️⃣ Use the indicators that compliment each other
Many indicators are based on the same algorithms.
Most of the time, the only difference between them is a minor change in its input variables.
For that reason, such indicators leave very similar clues.
In order to improve your trading, try to rely on indicators based on absolutely different algorithms. They must complement each other,
not show you the same thing.
#4️⃣ Price action first!
Remember that your trading strategy must be based primarily on a price action. Trend analysis and structure analysis must go first.
You must know the way to make predictions relying on a naked chart.
The indicators must be applied as the confirmation signals only.
They must support the trading strategy but not be its core.
❗️Remember that the indicators won't do all the work for you.
Indicator is just a tool in your toolbox that must be applied properly and in strict combination with other tools.
Would you add some other tips in this list?
❤️Please, support my work with like, thank you!❤️

#PERSISTENT... looking good 17.05.23#PERSISTENT.. ✅▶️
Intraday as well as swing trade
All levels given in charts ...
IF good potential seen then we work in options also
if activate then possible a huge movement Keep eye on this ...
We take trade only when it activates...
Possible to give good target
TRADING FACTS

BRIEFING Week #20 : Still Waiting for a Price SignalHere's your weekly update ! Brought to you each weekend with years of track-record history..
Don't forget to hit the like/follow button if you feel like this post deserves it ;)
That's the best way to support me and help pushing this content to other users.
Kindly,
Phil

Decoding Bitcoin: Indicators & Chart Analysis + EducationalWhen we look at Bitcoin's current price of $26,821, it's above two significant indicators: the middle Bollinger Band at $24,644 and the EMA 50 at $25,677. These two indicators are used to understand the trend of the price. If Bitcoin's price is above these levels, it generally means the trend is upward or bullish.
Now, the Fibonacci levels offer insight into potential future movement. Currently, Bitcoin's price is nearer to the 0 levels ($15,525), suggesting it has the potential to rise before meeting the next significant resistance at the 0.5 level ($42,250). However, market movements are unpredictable, and they might not necessarily reach or surpass this level.
RSI and Stochastic Oscillators are typically used to identify overbought and oversold conditions. With RSI at 55 and Stochastic Oscillators at 64, they're more or less neutral but leaning towards overbought. This suggests Bitcoin has been in demand recently, and we might soon see some selling pressure as traders decide to secure their profits.
The MACD, sitting at 1831, is an indicator of trend strength and direction. A positive MACD suggests the current trend is upward, but it's crucial to monitor it closely for any potential shifts in momentum.
Lastly, we have the OBV at 229K and the volume oscillator at -20%, which gives us information about the trading volume. A high OBV suggests strong buying pressure, but a negative volume oscillator indicates that trading activity has been lower recently. This presents a mixed signal, implying that the trend, while backed by some volume, is not experiencing robust trading activity.
So, what does all this mean for you as a trader? It's about understanding and interpreting these signals together. The Bollinger Bands and EMA tell you about the ongoing trend, while Fibonacci levels help identify potential future resistance and support levels. RSI and Stochastic Oscillators offer a sense of whether Bitcoin is currently in demand or not, and MACD provides insight into the trend's strength. OBV and volume oscillator, on the other hand, show the volume backing the trend.
Each indicator should be used in conjunction with others to get a comprehensive view of the market. Also, staying updated with market news and events is crucial as it can affect prices. This way, you can make more informed trading decisions.
Why are we using a weekly chart for this analysis?
One major advantage of checking in on weekly charts is gaining perspective on long-term trends. These charts are like taking a step back to get a broader view of the landscape. They can help you see if the market is generally moving in a bullish or bearish direction over time. This comprehensive view is something you might miss if you're only focusing on daily or even hourly fluctuations.
Another benefit of weekly charts is their ability to reduce market "noise." In the world of trading, noise refers to random fluctuations that can be distracting or even misleading. Because weekly charts consolidate more data into each point, they smooth out these erratic movements and give a clearer picture of the overall trend.
Then, there's the advantage of time management. Not every trader can, or wants to, monitor the markets on a daily basis. If you're one of them, then weekly charts are your friend. They give you the flexibility to keep track of market trends without the need to constantly monitor every minor price movement.
Furthermore, weekly charts are quite handy for strategic planning, especially for long-term investments. If you're thinking about where to enter or exit the market, weekly charts can provide valuable insights. They can help you spot potential opportunities that align with larger market trends, which can be especially useful for swing traders or investors.
However, it's not all sunshine and rainbows with weekly charts. There are a few potential drawbacks to be aware of.
One of the challenges with weekly charts is that they can be a bit slow in reflecting sudden market changes. For example, if there's a significant event that impacts the market within the week, the effect might not be immediately visible on the weekly chart.
Also, if you rely exclusively on weekly charts, you might miss out on some lucrative short-term trading opportunities. Day traders or scalpers, who thrive on making multiple trades within a day, might find weekly charts too broad for their needs.
And finally, if the market moves against your position, you might experience longer periods of drawdown when basing your decisions on weekly charts. Because these charts focus on a longer timeframe, it can take longer for them to reflect a change in trend.
In conclusion, while weekly charts are an important tool for long-term trend analysis, they should be used in conjunction with other timeframes and indicators to ensure a well-rounded view of the market. This will help balance the benefits of long-term trend analysis with the agility to respond to short-term market movements.
Pros:
- Perspective on Long-Term Trends: Weekly charts provide a broader view of the market, showing long-term trends that are crucial for understanding the overall market direction.
- Reduced Noise: Weekly charts can help filter out the noise of daily fluctuations, offering a smoother perspective of price movement.
- Effective Time Management: For those who can't or don't want to monitor charts daily, weekly charts require less frequent checking and still provide a solid understanding of market trends.
- Strategic Planning: Weekly charts can assist in planning long-term investment strategies, helping to determine good entry and exit points based on long-term trends.
Cons:
- Delayed Information: Because weekly charts are less granular, they might not reflect sudden market changes quickly.
- Reduced Trading Opportunities: If you're only relying on weekly charts, you might miss out on short-term trading opportunities that daily or hourly charts could reveal.
- Risk of Longer Drawdown Periods: If the market moves against your position, weekly charts could potentially result in longer drawdown periods because decisions are based on a longer timeframe.
Remember to use weekly charts in conjunction with other timeframes and indicators to get a comprehensive view of the market. This way, you can balance the advantages of long-term trend analysis with the ability to respond to short-term market movements.
