MARA Holdings Options Ahead of EarningsIf you haven`t bought MARA before the recent rally:
Now analyzing the options chain and the chart patterns of MARA Holdings prior to the earnings report this week,
I would consider purchasing the 13usd strike price Calls with
an expiration date of 2025-5-30,
for a premium of approximately $1.38.
If these options prove to be profitable prior to the earnings release, I would sell at least half of them.
Indicators

KODK Eastman Kodak Company Options Ahead of EarningsIf you haven`t bought KODK before the previous earnings:
Now analyzing the options chain and the chart patterns of KODK Eastman Kodak prior to the earnings report this week,
I would consider purchasing the 7.5usd strike price Calls with
an expiration date of 2026-1-16,
for a premium of approximately $0.92.
If these options prove to be profitable prior to the earnings release, I would sell at least half of them.

RKT Rocket Companies Options Ahead of EarningsIf you haven`t bought RKT before the previous earnings:
Now analyzing the options chain and the chart patterns of RKT Rocket Companies prior to the earnings report this week,
I would consider purchasing the 13usd strike price Calls with
an expiration date of 2026-1-16,
for a premium of approximately $1.37.
If these options prove to be profitable prior to the earnings release, I would sell at least half of them.

WULF TeraWulf Options Ahead of EarningsIf you haven`t bought WULF before the rally:
Now analyzing the options chain and the chart patterns of WULF TeraWulf prior to the earnings report this week,
I would consider purchasing the 2usd strike price Puts with
an expiration date of 2026-1-16,
for a premium of approximately $0.43.
If these options prove to be profitable prior to the earnings release, I would sell at least half of them.

S&P 500 Bearish Reversal Setup: Short Entry Below Key ResistanceEntry Point: Around 5,678.79
Stop Loss: Around 5,833.61 (above recent resistance zone)
Target Point: Around 4,831.37 (indicating a bearish target)
2. Technical Patterns:
The price hit a resistance zone (highlighted in purple) and reversed—this is often a bearish signal.
The trendline break (marked with the orange dot and blue arrow down) suggests a potential trend reversal.
The moving averages (likely 50 EMA and 200 EMA) indicate the price is still above the support zone but weakening.
3. Risk/Reward Ratio:
Risk (Stop Loss – Entry): ~154.82 points
Reward (Entry – Target): ~847.42 points
Risk/Reward Ratio: Approximately 1:5.5, which is favorable for shorting.
4. Trade Sentiment:
Bearish bias based on the breakdown from the resistance zone and confirmation from chart patterns.
If the price fails to hold above 5,682.87, a short trade may be validated with the target at 4,831.37.

XAUUSD Bullish Continuation Setup (read-caption)📊 Chart Overview:
Asset: Unspecified (likely XAUUSD or a crypto asset).
Timeframe: Looks like 4H or Daily.
Tools Used:
EMA 50 (🔴 Red Line) — 3,283.978
EMA 200 (🔵 Blue Line) — 3,185.603
Resistance & Support Zones (🔴 Highlighted boxes)
Price: 3,335.415
🔍 Technical Analysis:
🟩 Trend Direction:
📈 Uptrend Confirmed: Price is above both EMA 50 and EMA 200 → Strong bullish momentum.
✅ Golden Cross: EMA 50 is above EMA 200, confirming long-term bullish bias.
📌 Key Levels:
🧱 Main Support Zone (🟥 Bottom Box - ~2,950–3,050):
Historical strong bounce zone.
Acts as a bullish base in case of a deeper pullback.
🔄 Mid Resistance/Support (~3,180–3,260):
Now acting as support after price bounced above it.
Also aligns with EMA 200 ➕🟦 – adds confluence.
📌 Main Resistance Zone (~3,300–3,380):
Current area of consolidation.
If broken, price likely to retest upper resistance.
🚧 Top Resistance Zone (~3,450–3,500):
Target area if bullish breakout continues.
✈️ Next take-profit zone for bulls.
🧭 Market Forecast:
🔁 Retest Expected: Price might pull back slightly to the main resistance area (~3,300), retesting previous resistance as support.
🚀 Upside Potential: Upon successful retest, price is projected to head toward the upper resistance (~3,480).
📉 Bearish Scenario: If price breaks back below 3,260 and EMA 50, expect a dip toward 3,180 or even the main support zone.
📈 Summary:
Bias: ✅ Bullish
Watch for:
🔍 Retest of 3,300 zone
✅ Breakout above 3,380
❌ Breakdown below 3,260 invalidates bullish scenario

Silver Analysis: Bearish Continuation Toward $31 Support ?🧠 Chart Context & Setup
Chart Type: Candlestick
Timeframe: Likely 4H or Daily
Indicators Used:
EMA 50 (Red) — 32.814
EMA 200 (Blue) — 32.559
🔍 Key Technical Levels
Resistance Zone: 33.600 – 33.950
Price faced repeated rejection in this zone, confirming it as a valid supply/resistance area.
Support Zone: 30.600 – 31.100
Marked as the next potential demand zone, aligning with previous accumulation and reaction levels.
Current Price: ~32.618
Just below the 50 EMA and slightly above the 200 EMA.
🔄 Market Structure
The market experienced a strong bearish impulse in early April, followed by a bullish correction that reclaimed the 200 EMA.
Multiple internal liquidity (INT.LQ) sweeps were taken before forming a potential lower high (LH) at the resistance zone.
The recent bearish move broke below the EMAs and previous structure, indicating a possible shift back to bearish momentum.
📉 Bearish Scenario Outlook (Most Probable as of Now)
The chart shows a projected lower high formation, likely leading into a continuation of the bearish move.
If price fails to break back above 32.800–32.900, we could expect a sell-off toward the support zone (30.600–31.100).
This move aligns with:
Breakdown below EMAs
Failed bullish continuation
Rejection from a strong resistance zone
🧭 EMA Analysis
EMA 50 > EMA 200, but the price is now sandwiched and showing signs of weakness.
If price sustains below both EMAs, momentum is likely to favor bears in the short to medium term.
⚠️ Risk Factors to Watch
Any strong bullish engulfing candle reclaiming the 33.000 zone could invalidate the bearish thesis.
Fundamentals like USD volatility, inflation data, or geopolitical tension could impact Silver drastically.
✅ Conclusion
The chart currently suggests a bearish continuation setup, with the potential for price to revisit the $31.00–$30.60 support zone after rejecting resistance. A retest of broken structure around 32.700–32.800 might provide an ideal entry for sellers.

Silver – Bearish Move Toward Support🧠 Market Overview:
Instrument: Likely Silver (based on file name).
Chart Context: The price is currently trading below both the 50 EMA (red) and 200 EMA (blue), indicating bearish momentum and a possible shift in market structure.
📊 Key Technical Components:
🔹 Exponential Moving Averages (EMA):
50 EMA (32.614) is above the 200 EMA (32.526) but both are above the current price.
This crossover is recent and could indicate the beginning of a larger downtrend if confirmed by continued price action below both EMAs.
🔹 Market Structure:
POI (Point of Interest) marks a previous swing high where selling pressure emerged.
The chart shows internal liquidity (INT.LQ) sweeps both above and below consolidation areas, hinting at smart money manipulation to grab liquidity before making a move.
🔹 Resistance Zone:
Clearly defined between approx. 33.4–34.0, where price was rejected after a failed attempt to break higher.
Multiple rejections from this zone show strong selling pressure.
🔹 Support Zone:
Sitting between approx. 30.8–31.2.
Price previously consolidated here before a bullish move, making it a likely target for a return test or a potential bounce.
📉 Bearish Scenario & Projection:
The price broke below a short-term structure and failed to hold above EMAs.
The current price action shows a bearish pullback likely to form a Lower High (LH).
The projected path shows a pullback to previous support-turned-resistance, followed by a breakdown targeting the support zone.
✅ Bias:
Short-term bias: Bearish
Medium-term bias: Bearish, unless price reclaims the 200 EMA and consolidates above the resistance zone.
🔍 Confluences Supporting Bearish Outlook:
Price below EMAs (dynamic resistance).
Failed higher highs with liquidity sweeps (indicating smart money selling).
Clear market structure shift to the downside.
Anticipated retest of support zone around 30.8–31.2.

XAU/USD Market Outlook – Key Levels & Scenarios (May 2025)📊 Market Overview
Asset: XAU/USD (Gold vs. USD) – likely
Timeframe: 🕒 4H or Daily
EMAs:
🔴 50 EMA = 3,281 (short-term trend)
🔵 200 EMA = 3,179 (long-term trend)
🧱 Key Zones
🔺 Main Resistance Zone (🚫 Supply Area)
📍 ~3,320–3,400
🔍 Observation: Strong rejection zone with multiple failed attempts. 🚧 Price struggles to break and hold above here.
⚖️ Mid Support & Resistance Zone
📍 ~3,200–3,250
🧭 Current Action: Price is consolidating here. This is a key decision zone. A bounce or breakdown will likely decide the next big move. 🤔
🟦 Main Support Zone
📍 ~2,980–3,030
🛑 Observation: Major demand zone. If price falls here, it might attract buyers 👥 for a potential rebound.
📉 EMA Analysis
🔴 50 EMA is above 🔵 200 EMA → Trend still technically bullish ✅
🟡 BUT: Price is currently below 50 EMA, showing short-term weakness ⚠️
⚡️ 200 EMA is nearby (~3,179): Acting as dynamic support — a critical bounce zone! 🛡️
🔮 Scenarios
🐂 Bullish Path
✅ If price bounces from 3,200 support zone and reclaims 🔴 50 EMA:
🎯 Target: Retest of 3,320–3,400 🔺 zone
📈 Confirmation: Strong candle closing above 3,281 🔴 EMA
🐻 Bearish Path
🚨 If price breaks below 3,200 & 200 EMA:
🕳️ Expect drop towards 2,980–3,030 🟦 zone
📉 Confirmation: Candle closes below 3,179 with weak retest
✅ Conclusion
📍 Key Level to Watch: 3,200
⚖️ Market Sentiment: Neutral → Bearish bias unless price reclaims 50 EMA
🔒 Risk Tip: Avoid longs until price confirms bullish structure again 🔐

EUR/AUD Bearish Channel with Key Support Ahead📉 Market Structure Analysis (Bearish Bias)
Current Trend:
The pair is trading within a well-defined descending channel, indicating a bearish trend. Price action is forming lower highs and lower lows, adhering to the channel boundaries.
Moving Averages (EMA):
EMA 50 (Red) at 1.77491 is above the price, acting as dynamic resistance.
EMA 200 (Blue) at 1.73338 is close to current price, likely to act as a support area in the short term.
The bearish crossover between the 50 EMA and current price supports the continuation of downward momentum.
🔍 Key Zones:
Weak Resistance Zone:
Located around 1.7740 – 1.8000, previously a support area, now acting as resistance.
Price rejection from this zone multiple times indicates sellers' strength.
Support Zone:
Located around 1.6950 – 1.7100, where demand may return.
This zone coincides with the lower boundary of the descending channel, making it a likely reaction zone.
📊 Forecast / Expectation:
The chart projects a bear flag / corrective pullback before another leg downward toward the support zone.
If price breaks and sustains below the EMA 200, it will likely accelerate bearish pressure.
The descending channel suggests potential continuation to the downside unless price breaks out of the upper boundary with momentum.
✅ Trade Implications:
Bearish Setup:
Look for short opportunities on intraday pullbacks near the resistance or EMA 50.
Bullish Invalidations:
A breakout above the descending channel and sustained move above 1.7800 would invalidate the bearish outlook.
Conclusion:
This chart presents a technically clean bearish setup. The confluence of a descending channel, EMA rejection, and defined resistance/support zones suggests the EUR/AUD may continue lower, especially if it loses the 1.7300 level decisively.

(XAU/USD) Bullish Trade Setup – Targeting $3,506.52 with Entry aEntry Point: $3,221.19
Stop Loss: $3,169.80
Resistance Zone: Around $3,277.98 to $3,280.64
Target (TP) Point: $3,506.52 (Approx. 9.05% upside)
📊 Technical Indicators and Markings:
Moving Averages:
Likely a 50-period (blue) and 200-period (red) moving average.
Price is currently below both MAs, signaling a short-term downtrend.
Support & Resistance Zones:
Strong support around $3,207.67–$3,221.19 (entry area).
Resistance at $3,244.25–$3,280.64.
Stop-loss is strategically placed below support to limit downside risk.
Target Area:
Projected upside target is $3,506.52, with a potential 9.05% gain from the entry.
This is marked as the EA (Expert Advisor) Target Point, possibly suggesting this is a strategy from an automated trading system.
Orange Circles:
Likely indicate swing highs and lows, used to identify trend patterns and potential reversal points.
📈 Trading Idea Summary:
Bullish Setup: Buying at support, aiming for breakout above resistance to reach target.
Risk-Reward Ratio: Favorable, assuming price holds above $3,207.
Watch for Confirmation: Price needs to break above resistance around $3,280 for momentum continuation.

BRIEFING Week #18 : Waiting for RotationHere's your weekly update ! Brought to you each weekend with years of track-record history..
Don't forget to hit the like/follow button if you feel like this post deserves it ;)
That's the best way to support me and help pushing this content to other users.
Kindly,
Phil

Bearish Rejection at Resistance – Potential Drop Incoming🔍 Chart Analysis Summary
1. Key Zones
Resistance Zone: ~$3,340 – $3,360
Price has been rejected multiple times from this area, showing strong selling pressure.
Support Zone: ~$3,200 – $3,240
Strong historical support level, previously held during a pullback after the last rally.
2. Moving Averages
EMA 50 (Red): Currently at ~$3,340
Price is fluctuating around it, indicating short-term indecision or a possible retest.
EMA 200 (Blue): Currently at ~$3,300
Acting as a mid-term support level. Price previously bounced from this region.
3. Pattern and Price Action
Fakeout Potential:
The chart suggests a possible false breakout above the resistance followed by a sharp drop—highlighted by the arrow. This is a common bull trap setup.
Bearish Outlook Indicated:
The projected path suggests a rejection from resistance and a drop to the support zone (~$3,200). This would create a lower high, a bearish sign.
4. Trading Bias
Bearish Setup if:
Price fails to hold above $3,340 (EMA50).
Price gets rejected from the resistance zone and breaks below $3,300 (EMA200).
Bullish Invalidated if:
Price closes convincingly above the $3,360 resistance with volume, flipping it into support.
📉 Potential Trade Idea
Short Entry: Around $3,350–$3,355
Stop Loss: Above $3,365 (above resistance zone)
Target: $3,220–$3,230 (support zone)

Bearish Reversal Setup: Resistance Rejection Targeting Key Chart Overview:
Asset: Unspecified (likely XAU/USD or an index based on price levels)
Indicators:
EMA 50 (red) — currently around 3,306.84
EMA 200 (blue) — currently around 3,300.54
Key Zones:
Resistance Zone: ~3,320 to 3,360
Support Zone: ~3,190 to 3,240
Technical Analysis:
Trend Context:
The asset previously had a strong bullish run, peaking above 3,400.
After the peak, it shifted into a lower high structure, indicating potential distribution.
Price is currently fluctuating below the resistance zone but above the support zone, suggesting range-bound conditions.
Moving Averages (EMA Analysis):
The 50 EMA is currently below the 200 EMA, signaling short-term bearish pressure.
Price is hovering around these EMAs, suggesting indecision and the possibility of a breakout or breakdown.
Resistance Behavior:
Price is projected to retest the resistance zone (~3,340–3,360) before a major drop.
The resistance zone has already acted as a strong supply area multiple times, reinforcing its significance.
Support Expectation:
After rejection from the resistance zone, price is expected to decline sharply toward the support zone (~3,200).
The drawn arrows suggest an expectation of a rapid sell-off after the final fake-out at resistance.
Structure and Price Action:
The forecasted scenario shows a liquidity grab above resistance (fake breakout) followed by a strong bearish reversal.
This is typical in a "distribution phase" where market makers induce breakout traders before reversing the move.
Summary:
Primary Bias: Bearish
Setup: Short from resistance rejection after liquidity sweep.
Target: Support zone around 3,200.
Invalidation: A clean breakout and retest above the resistance zone (~3,360) would invalidate the bearish idea.
Risk Management: Ensure proper stop loss above resistance to mitigate risk in case of a genuine breakout.

CAD/JPY at Key Decision Zone: Breakout or Rejection?🕵️♂️ Chart Overview:
Instrument: CAD/JPY
Chart Type: Candlestick
Time Frame: Appears to be intraday (possibly 1H or 4H)
EMAs Used:
50 EMA (Red): 102.814
200 EMA (Blue): 102.710
📊 Key Zones Identified:
1. Immediate Zone (103.30 - 103.50)
Marked as: “Resistance + Support”
This is a key decision zone. Price has tested this region multiple times, showing it holds dual roles — a flip zone.
Price is currently testing this zone again. A break and retest above could confirm bullish momentum.
2. Upper Resistance Zone (104.80 - 105.50)
A broader supply area where previous strong selling pressure occurred.
This is the next logical target if price breaks and holds above 103.50.
3. Lower Support (101.29)
Strong horizontal support, clearly defined from previous lows.
If the price fails to break above the current zone, a rejection could lead to a move back down toward this support.
📈 Bullish Scenario:
Break above 103.50, with a successful retest confirming new support.
Momentum could carry price toward the 105.00–105.50 resistance.
Supported by 50 EMA crossing above 200 EMA (early sign of bullish crossover — Golden Cross).
📉 Bearish Scenario:
Rejection from the 103.30–103.50 zone could signal continuation of range-bound or bearish pressure.
Break below 102.00, followed by momentum towards 101.29 key support.
Would invalidate short-term bullish structure.
📌 Additional Technical Notes:
The chart shows consolidation between 102.00 and 103.50 — likely accumulation or re-accumulation phase.
EMAs are tightening, indicating a potential volatility expansion move is near.
Volume is not visible but would be useful to confirm breakout strength.
📍Conclusion:
CAD/JPY is currently at a critical decision zone. The next few candles will be key. Monitor:
Breakout direction
Retest confirmations
Momentum and volume indicators (if available)

LUMN Lumen Technologies Options Ahead of EarningsAnalyzing the options chain and the chart patterns of LUMN Lumen Technologies prior to the earnings report this week,
I would consider purchasing the 3.50usd strike price Calls with
an expiration date of 2025-5-30,
for a premium of approximately $0.41.
If these options prove to be profitable prior to the earnings release, I would sell at least half of them.
Disclosure: I am part of Trade Nation's Influencer program and receive a monthly fee for using their TradingView charts in my analysis.

BBAI BigBear ai Holdings Options Ahead of EarningsIf you haven`t bought BBAI before the massive rally:
Now analyzing the options chain and the chart patterns of BBAI BigBear ai Holdings prior to the earnings report this week,
I would consider purchasing the 3usd strike price Calls with
an expiration date of 2025-12-19,
for a premium of approximately $1.35.
If these options prove to be profitable prior to the earnings release, I would sell at least half of them.

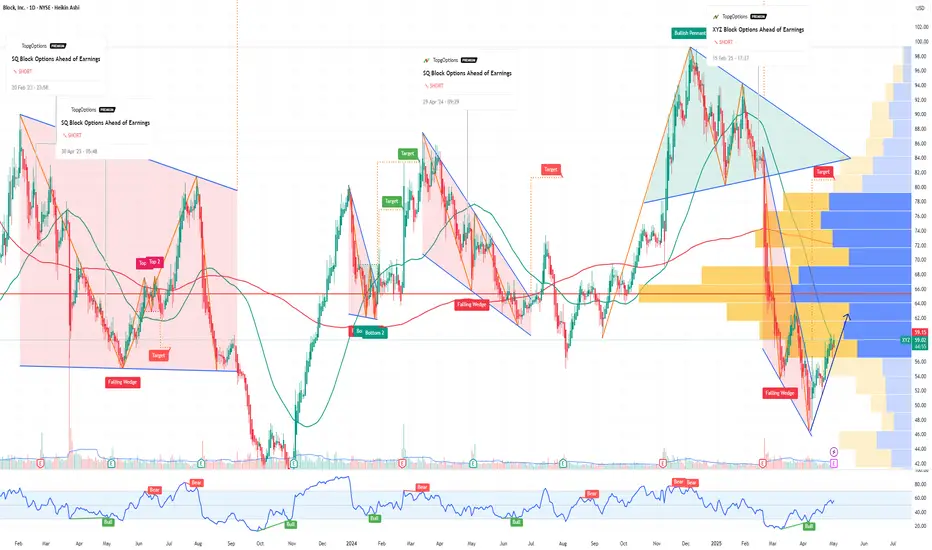
XYZ Block Options Ahead of EarningsIf you haven`t sold XYZ before the previous earnings:
Now analyzing the options chain and the chart patterns of XYZ Block prior to the earnings report this week,
I would consider purchasing the 58usd strike price Calls with
an expiration date of 2025-5-2,
for a premium of approximately $3.40.
If these options prove to be profitable prior to the earnings release, I would sell at least half of them.
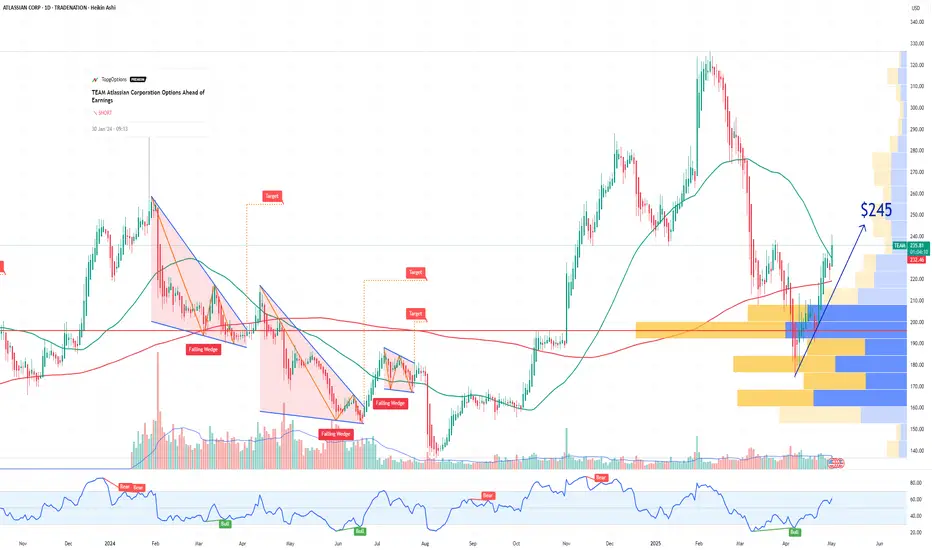
TEAM Atlassian Corporation Options Ahead of EarningsIf you haven`t sold TEAM on this top:
Now analyzing the options chain and the chart patterns of TEAM Atlassian Corporation prior to the earnings report this week,
I would consider purchasing the 245usd strike price Calls with
an expiration date of 2025-5-2,
for a premium of approximately $8.70.
If these options prove to be profitable prior to the earnings release, I would sell at least half of them.
Disclosure: I am part of Trade Nation's Influencer program and receive a monthly fee for using their TradingView charts in my analysis.
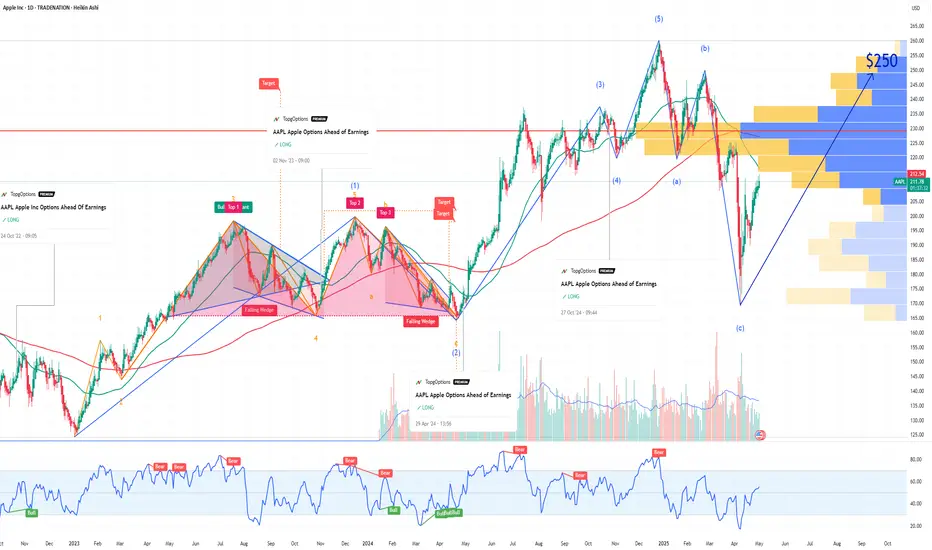
AAPL Apple Options Ahead of EarningsIf you haven`t bought AAPL before the previous rally:
Now analyzing the options chain and the chart patterns of AAPL Apple prior to the earnings report this week,
I would consider purchasing the 255usd strike price Calls with
an expiration date of 2026-1-16,
for a premium of approximately $7.30.
If these options prove to be profitable prior to the earnings release, I would sell at least half of them.
Disclosure: I am part of Trade Nation's Influencer program and receive a monthly fee for using their TradingView charts in my analysis.
Gold (XAU/USD) Intraday Buy Setup with High Reward-to-Risk Ratio1. Entry Point Zone: Around 3,271.79 USD
This is identified as a potential buy entry area, marked in purple.
2. Stop Loss: Below the entry point at 3,257.71 USD
Risk management level in case the trade moves against the setup.
3. Target Point One: Between 3,313.75 and 3,317.07 USD
A short-term take-profit level, likely based on previous resistance.
4. Final Target (EA Target Point): Around 3,373.04 USD
A more ambitious take-profit, possibly based on a major resistance level or Fibonacci extension.
5. Trade Range:
Risk: 3,271.79 - 3,257.71 = 14.08 USD
Reward to First Target: ~42 USD

(XAU/USD) 1H Chart: Long Setup Targeting 3,500 with Key Support Entry Point: Suggested near 3,301.51 USD (marked with the purple support zone).
Stop Loss Zone: Below 3,266.87 to 3,221.67 USD (marked in blue and purple). This is where you limit your loss if the trade goes wrong.
First Target (Target Point One): 3,376.65 USD.
Final Target (EA Target Point): 3,523.55 USD (~8.26% potential gain from entry).
Main Setup Idea:
The price is consolidating around the support zone.
There's a plan to buy (go long) at the purple zone (Entry Point) and aim for the two target points

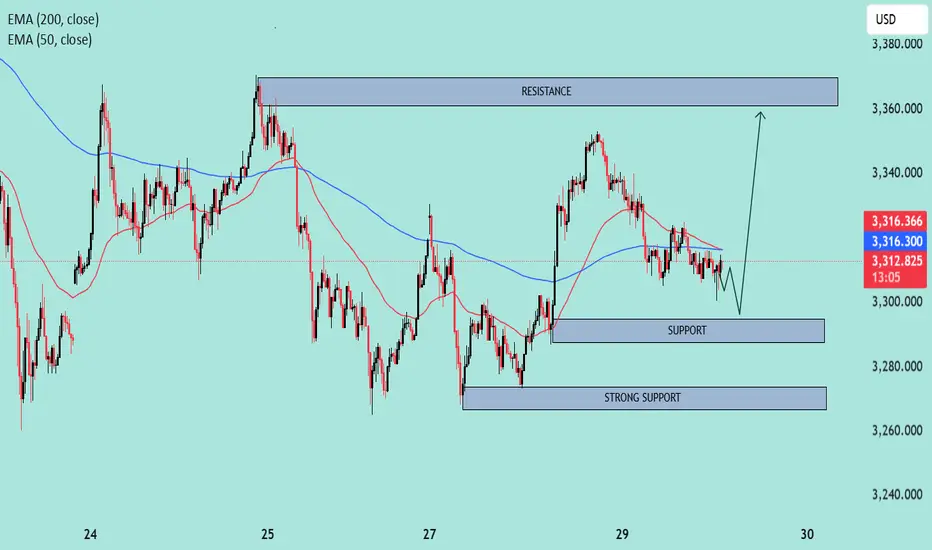
XAUUSD – Bullish Reversal Setup Near Support🟦 Chart Context:
Type: Intraday (likely 15m or 1h timeframe).
Indicators Used:
EMA 50 (Red): 3,316.497
EMA 200 (Blue): 3,316.332
Current Price: 3,312.650
🔍 Technical Analysis:
1. Trend & Moving Averages:
EMA Crossover (Bearish): The 50 EMA is slightly above the 200 EMA, but both are flat and converging, suggesting a neutral to slightly bearish short-term sentiment.
Price below both EMAs indicates bearish pressure in the immediate term.
2. Key Zones:
Resistance Zone: 3,355 – 3,370
Price was previously rejected from this zone, indicating strong supply and likely sell orders.
Support Zone: 3,295 – 3,305
Price has bounced here multiple times, suggesting active buyers.
Strong Support: 3,265 – 3,275
A broader and more historically respected area that could lead to a significant reversal if tested.
3. Price Action:
Currently forming lower highs and lower lows, which is a classic sign of short-term weakness.
A small descending triangle appears to be forming near the support level (bearish bias), but the drawn forecast suggests a potential fakeout breakdown followed by a bullish reversal.
4. Expected Scenario (as per chart projection):
Price might dip briefly into the 3,295–3,305 support, triggering liquidity grab (stop hunts).
A potential bullish rally towards the 3,355–3,370 resistance zone is expected.
This suggests a buy-the-dip strategy near support with tight risk management.
📈 Trade Outlook:
🟢 Bullish Bias:
If the support at 3,295–3,305 holds and price reclaims the 200 EMA convincingly.
Target: 3,355–3,370 resistance zone.
🔴 Bearish Bias:
If price breaks below the strong support (3,265), expect continuation lower.
Downside targets would then extend towards 3,240–3,250.
✅ Conclusion:
Current bias: Neutral to short-term bearish unless the lower support holds.
Key action zone: Watch price reaction around 3,295.
Strategy suggestion: Monitor for a bullish reversal signal at support; avoid chasing trades in the middle of the range.