Teva wk longsTeva wk showing great price action to go long. We can wait for the price to take day trades.
Good luck
Indices

FTSE 100 H4 | Pullback resistance at 61.8% Fibonacci retracementFTSE 100 (UK100) is rising towards a pullback resistance and could potentially reverse off this level to drop lower.
Sell entry is at 8,251.42 which is a pullback resistance that aligns with the 61.8% Fibonacci retracement level.
Stop loss is at 8,344.00 which is a level that sits above the 78.6% Fibonacci retracement and a swing-high resistance.
Take profit is at 8,144.36 which is a pullback support.
High Risk Investment Warning
Trading Forex/CFDs on margin carries a high level of risk and may not be suitable for all investors. Leverage can work against you.
Stratos Markets Limited (www.fxcm.com):
CFDs are complex instruments and come with a high risk of losing money rapidly due to leverage. 64% of retail investor accounts lose money when trading CFDs with this provider. You should consider whether you understand how CFDs work and whether you can afford to take the high risk of losing your money.
Stratos Europe Ltd (www.fxcm.com):
CFDs are complex instruments and come with a high risk of losing money rapidly due to leverage. 66% of retail investor accounts lose money when trading CFDs with this provider. You should consider whether you understand how CFDs work and whether you can afford to take the high risk of losing your money.
Stratos Trading Pty. Limited (www.fxcm.com):
Trading FX/CFDs carries significant risks. FXCM AU (AFSL 309763), please read the Financial Services Guide, Product Disclosure Statement, Target Market Determination and Terms of Business at www.fxcm.com
Stratos Global LLC (www.fxcm.com):
Losses can exceed deposits.
Please be advised that the information presented on TradingView is provided to FXCM (‘Company’, ‘we’) by a third-party provider (‘TFA Global Pte Ltd’). Please be reminded that you are solely responsible for the trading decisions on your account. There is a very high degree of risk involved in trading. Any information and/or content is intended entirely for research, educational and informational purposes only and does not constitute investment or consultation advice or investment strategy. The information is not tailored to the investment needs of any specific person and therefore does not involve a consideration of any of the investment objectives, financial situation or needs of any viewer that may receive it. Kindly also note that past performance is not a reliable indicator of future results. Actual results may differ materially from those anticipated in forward-looking or past performance statements. We assume no liability as to the accuracy or completeness of any of the information and/or content provided herein and the Company cannot be held responsible for any omission, mistake nor for any loss or damage including without limitation to any loss of profit which may arise from reliance on any information supplied by TFA Global Pte Ltd.
The speaker(s) is neither an employee, agent nor representative of FXCM and is therefore acting independently. The opinions given are their own, constitute general market commentary, and do not constitute the opinion or advice of FXCM or any form of personal or investment advice. FXCM neither endorses nor guarantees offerings of third-party speakers, nor is FXCM responsible for the content, veracity or opinions of third-party speakers, presenters or participants.

S&P500 Potential UpsidesHey Traders, in this week we are monitoring US500 for a buying opportunity around 5650 zone, S&P500 is trading in an uptrend and currently is in a correction phase in which it is approaching the trend at 5650 support and resistance area.
Trade safe, Joe.

Hang Seng Index H1 | Falling to overlap supportThe Hang Seng Index (HKG33) is falling towards an overlap support and could potentially bounce off this level to climb higher.
Buy entry is at 19,905.23 which is an overlap support that aligns with the 50.0% Fibonacci retracement.
Stop loss is at 19,540.00 which is a level that sits under a multi-swing-low support.
Take profit is at 20,522.59 which is a multi-swing-high resistance that aligns close to the 50.0% Fibonacci retracement.
High Risk Investment Warning
Trading Forex/CFDs on margin carries a high level of risk and may not be suitable for all investors. Leverage can work against you.
Stratos Markets Limited (www.fxcm.com):
CFDs are complex instruments and come with a high risk of losing money rapidly due to leverage. 64% of retail investor accounts lose money when trading CFDs with this provider. You should consider whether you understand how CFDs work and whether you can afford to take the high risk of losing your money.
Stratos Europe Ltd (www.fxcm.com):
CFDs are complex instruments and come with a high risk of losing money rapidly due to leverage. 66% of retail investor accounts lose money when trading CFDs with this provider. You should consider whether you understand how CFDs work and whether you can afford to take the high risk of losing your money.
Stratos Trading Pty. Limited (www.fxcm.com):
Trading FX/CFDs carries significant risks. FXCM AU (AFSL 309763), please read the Financial Services Guide, Product Disclosure Statement, Target Market Determination and Terms of Business at www.fxcm.com
Stratos Global LLC (www.fxcm.com):
Losses can exceed deposits.
Please be advised that the information presented on TradingView is provided to FXCM (‘Company’, ‘we’) by a third-party provider (‘TFA Global Pte Ltd’). Please be reminded that you are solely responsible for the trading decisions on your account. There is a very high degree of risk involved in trading. Any information and/or content is intended entirely for research, educational and informational purposes only and does not constitute investment or consultation advice or investment strategy. The information is not tailored to the investment needs of any specific person and therefore does not involve a consideration of any of the investment objectives, financial situation or needs of any viewer that may receive it. Kindly also note that past performance is not a reliable indicator of future results. Actual results may differ materially from those anticipated in forward-looking or past performance statements. We assume no liability as to the accuracy or completeness of any of the information and/or content provided herein and the Company cannot be held responsible for any omission, mistake nor for any loss or damage including without limitation to any loss of profit which may arise from reliance on any information supplied by TFA Global Pte Ltd.
The speaker(s) is neither an employee, agent nor representative of FXCM and is therefore acting independently. The opinions given are their own, constitute general market commentary, and do not constitute the opinion or advice of FXCM or any form of personal or investment advice. FXCM neither endorses nor guarantees offerings of third party speakers, nor is FXCM responsible for the content, veracity or opinions of third-party speakers, presenters or participants.

DJIA H4 | Falling to swing-low supportDJIA (US30) is falling towards a swing-low support and could potentially bounce off this level to climb higher.
Buy entry is at 42,153.14 which is a swing-low support.
Stop loss is at 41,650.00 which is a level that sits under the 127.2% Fibonacci extension and a swing-low support.
Take profit is at 43,042.34 which is an overlap resistance.
High Risk Investment Warning
Trading Forex/CFDs on margin carries a high level of risk and may not be suitable for all investors. Leverage can work against you.
Stratos Markets Limited (www.fxcm.com):
CFDs are complex instruments and come with a high risk of losing money rapidly due to leverage. 64% of retail investor accounts lose money when trading CFDs with this provider. You should consider whether you understand how CFDs work and whether you can afford to take the high risk of losing your money.
Stratos Europe Ltd (www.fxcm.com):
CFDs are complex instruments and come with a high risk of losing money rapidly due to leverage. 66% of retail investor accounts lose money when trading CFDs with this provider. You should consider whether you understand how CFDs work and whether you can afford to take the high risk of losing your money.
Stratos Trading Pty. Limited (www.fxcm.com):
Trading FX/CFDs carries significant risks. FXCM AU (AFSL 309763), please read the Financial Services Guide, Product Disclosure Statement, Target Market Determination and Terms of Business at www.fxcm.com
Stratos Global LLC (www.fxcm.com):
Losses can exceed deposits.
Please be advised that the information presented on TradingView is provided to FXCM (‘Company’, ‘we’) by a third-party provider (‘TFA Global Pte Ltd’). Please be reminded that you are solely responsible for the trading decisions on your account. There is a very high degree of risk involved in trading. Any information and/or content is intended entirely for research, educational and informational purposes only and does not constitute investment or consultation advice or investment strategy. The information is not tailored to the investment needs of any specific person and therefore does not involve a consideration of any of the investment objectives, financial situation or needs of any viewer that may receive it. Kindly also note that past performance is not a reliable indicator of future results. Actual results may differ materially from those anticipated in forward-looking or past performance statements. We assume no liability as to the accuracy or completeness of any of the information and/or content provided herein and the Company cannot be held responsible for any omission, mistake nor for any loss or damage including without limitation to any loss of profit which may arise from reliance on any information supplied by TFA Global Pte Ltd.
The speaker(s) is neither an employee, agent nor representative of FXCM and is therefore acting independently. The opinions given are their own, constitute general market commentary, and do not constitute the opinion or advice of FXCM or any form of personal or investment advice. FXCM neither endorses nor guarantees offerings of third party speakers, nor is FXCM responsible for the content, veracity or opinions of third-party speakers, presenters or participants.

DAX H4 | Falling to overlap supportDAX (GER30) is falling towards an overlap support and could potentially bounce off this level to climb higher.
Buy entry is at 19,678.29 which is an overlap support that aligns with the 50.0% Fibonacci retracement level.
Stop loss is at 19,446.00 which is a level that lies underneath a pullback support and the 61.8% Fibonacci retracement level.
Take profit is at 20,002.09 which is an overlap resistance that aligns with the 38.2% Fibonacci retracement level.
High Risk Investment Warning
Trading Forex/CFDs on margin carries a high level of risk and may not be suitable for all investors. Leverage can work against you.
Stratos Markets Limited (www.fxcm.com):
CFDs are complex instruments and come with a high risk of losing money rapidly due to leverage. 64% of retail investor accounts lose money when trading CFDs with this provider. You should consider whether you understand how CFDs work and whether you can afford to take the high risk of losing your money.
Stratos Europe Ltd (www.fxcm.com):
CFDs are complex instruments and come with a high risk of losing money rapidly due to leverage. 66% of retail investor accounts lose money when trading CFDs with this provider. You should consider whether you understand how CFDs work and whether you can afford to take the high risk of losing your money.
Stratos Trading Pty. Limited (www.fxcm.com):
Trading FX/CFDs carries significant risks. FXCM AU (AFSL 309763), please read the Financial Services Guide, Product Disclosure Statement, Target Market Determination and Terms of Business at www.fxcm.com
Stratos Global LLC (www.fxcm.com):
Losses can exceed deposits.
Please be advised that the information presented on TradingView is provided to FXCM (‘Company’, ‘we’) by a third-party provider (‘TFA Global Pte Ltd’). Please be reminded that you are solely responsible for the trading decisions on your account. There is a very high degree of risk involved in trading. Any information and/or content is intended entirely for research, educational and informational purposes only and does not constitute investment or consultation advice or investment strategy. The information is not tailored to the investment needs of any specific person and therefore does not involve a consideration of any of the investment objectives, financial situation or needs of any viewer that may receive it. Kindly also note that past performance is not a reliable indicator of future results. Actual results may differ materially from those anticipated in forward-looking or past performance statements. We assume no liability as to the accuracy or completeness of any of the information and/or content provided herein and the Company cannot be held responsible for any omission, mistake nor for any loss or damage including without limitation to any loss of profit which may arise from reliance on any information supplied by TFA Global Pte Ltd.
The speaker(s) is neither an employee, agent nor representative of FXCM and is therefore acting independently. The opinions given are their own, constitute general market commentary, and do not constitute the opinion or advice of FXCM or any form of personal or investment advice. FXCM neither endorses nor guarantees offerings of third-party speakers, nor is FXCM responsible for the content, veracity or opinions of third-party speakers, presenters or participants.

Bearish drop?S&P500 (US500) is reacting off the pivot and could drop to the 1st support which has been identified as an overlap support.
Pivot: 6,027.45
1st Support: 5,869.16
1st Resistance: 6,182.03
Risk Warning:
Trading Forex and CFDs carries a high level of risk to your capital and you should only trade with money you can afford to lose. Trading Forex and CFDs may not be suitable for all investors, so please ensure that you fully understand the risks involved and seek independent advice if necessary.
Disclaimer:
The above opinions given constitute general market commentary, and do not constitute the opinion or advice of IC Markets or any form of personal or investment advice.
Any opinions, news, research, analyses, prices, other information, or links to third-party sites contained on this website are provided on an "as-is" basis, are intended only to be informative, is not an advice nor a recommendation, nor research, or a record of our trading prices, or an offer of, or solicitation for a transaction in any financial instrument and thus should not be treated as such. The information provided does not involve any specific investment objectives, financial situation and needs of any specific person who may receive it. Please be aware, that past performance is not a reliable indicator of future performance and/or results. Past Performance or Forward-looking scenarios based upon the reasonable beliefs of the third-party provider are not a guarantee of future performance. Actual results may differ materially from those anticipated in forward-looking or past performance statements. IC Markets makes no representation or warranty and assumes no liability as to the accuracy or completeness of the information provided, nor any loss arising from any investment based on a recommendation, forecast or any information supplied by any third-party.

BEarish drop?Dow Jones (US30) is reacting off the pivot and could drop to the pullback support.
Pivot: 43,358.90
1st Support: 41,883.16
1st Resistance: 44,074.83
Risk Warning:
Trading Forex and CFDs carries a high level of risk to your capital and you should only trade with money you can afford to lose. Trading Forex and CFDs may not be suitable for all investors, so please ensure that you fully understand the risks involved and seek independent advice if necessary.
Disclaimer:
The above opinions given constitute general market commentary, and do not constitute the opinion or advice of IC Markets or any form of personal or investment advice.
Any opinions, news, research, analyses, prices, other information, or links to third-party sites contained on this website are provided on an "as-is" basis, are intended only to be informative, is not an advice nor a recommendation, nor research, or a record of our trading prices, or an offer of, or solicitation for a transaction in any financial instrument and thus should not be treated as such. The information provided does not involve any specific investment objectives, financial situation and needs of any specific person who may receive it. Please be aware, that past performance is not a reliable indicator of future performance and/or results. Past Performance or Forward-looking scenarios based upon the reasonable beliefs of the third-party provider are not a guarantee of future performance. Actual results may differ materially from those anticipated in forward-looking or past performance statements. IC Markets makes no representation or warranty and assumes no liability as to the accuracy or completeness of the information provided, nor any loss arising from any investment based on a recommendation, forecast or any information supplied by any third-party.

S&P 500 Daily Chart Analysis For Week of Dec 27, 2024Technical Analysis and Outlook:
During this short trading week, the S&P 500 made significant gains and is approaching our main target, Key Resistance at 6090. This movement is expected to support the next phase of the interim rebound, with the goal of breaking through the Key Resistance level at 6090 and continuing the bullish trend. However, it's important to acknowledge that a retest of the Mean Support at 5870 is still a likely scenario.

LALPATHLAB ready to Blast !!This is Weekly chart of LALPATHLAB
Stock is currently around law of Polarity
Stock has given no return from 2021 and currently given breakout around 2700
Stock has pending targets of 4000-4100 in weeks to come
Thank You !!

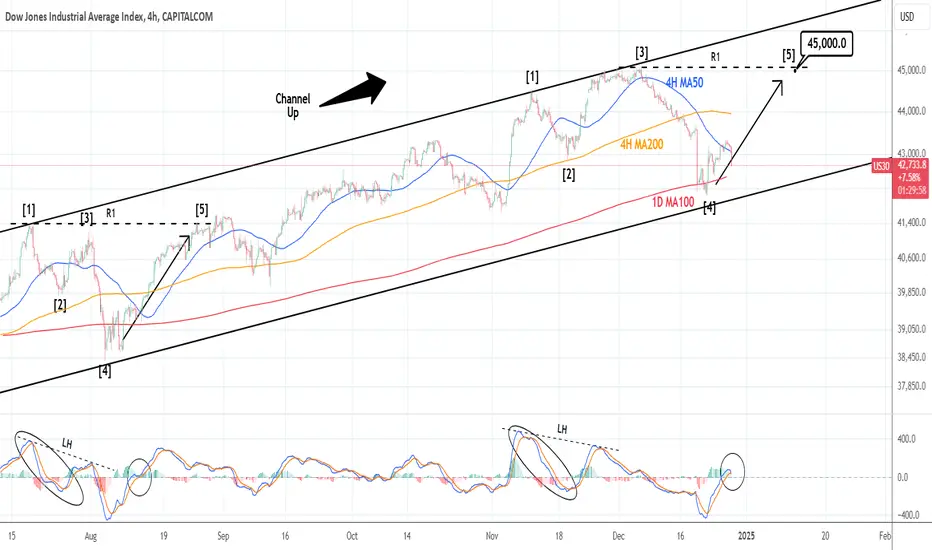
DOW JONES: Ignore the pullback, this is a new bullish wave.Dow Jones turned bearish again on its 1D technical outlook (RSI = 41.280, MACD = -138.420, ADX = 33.278) as it failed to hold the 4H MA50 as support today and crossed under it. The 1D MA100 is coming in as the next level of support, which formed the Dec 18th-19th low. According to the 4H MACD, the index formed during those 2 days a bottom similar to of August 5th. As long as the 1D MA100 holds, it is more likely to see a bounce above the 4H MA50 again like August 13th. Our goal is a wave, so we're targeting the R1 level (TP = 45,000).
## If you like our free content follow our profile to get more daily ideas. ##
## Comments and likes are greatly appreciated. ##
NASDAQ: Technical pullback presenting a buy opportunityNasdaq got oversold on 1H due to the strong selling on opening but remains neutral on its 1D technical outlook (RSI = 51.372, MACD = 205.380, ADX = 49.545) as it is still over the 1D MA50. More specifically, it was the rebound on the latter last Friday (Dec 20th) that has initiated the current bullish wave. This is the 5th bullish wave inside the 5 month Channel Up and as long as the 1D MA50 continues to support, we are expecting a new High. As with the prior Highs, we are targeting the 2.382 Fibonacci extension (TP = 22,550).
See how our prior idea has worked out:
## If you like our free content follow our profile to get more daily ideas. ##
## Comments and likes are greatly appreciated. ##

DXY Potential UpsidesHey Traders, in today's trading session we are monitoring DXY for a buying opportunity around 107.800 zone, DXY is trading in an uptrend and currently is in a correction phase in which it is approaching the trend at 107.800 support and resistance area.
Trade safe, Joe.

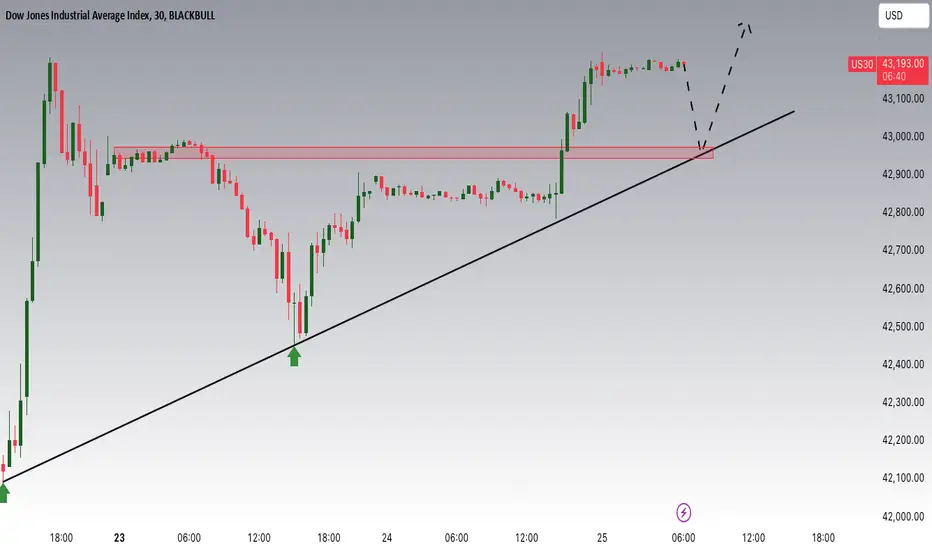
US30 Potential UpsidesHey Traders, in today's trading session we are monitoring US30 for a buying opportunity around 43,000 zone, USOIL is trading in an uptrend and currently is in a correction phase in which it is approaching the trend at 43,000 support and resistance area.
Trade safe, Joe.
US2000 H4 | Heading into a pullback resistanceUS2000 is rising towards a pullback resistance and could potentially reverse off this level to drop lower.
Sell entry is at 2,284.62 which is a pullback resistance.
Stop loss is at 2,353.00 which is a level that sits above the 50.0% Fibonacci retracement and an overlap resistance.
Take profit is at 2,193.65 which is a multi-swing-low support.
High Risk Investment Warning
Trading Forex/CFDs on margin carries a high level of risk and may not be suitable for all investors. Leverage can work against you.
Stratos Markets Limited (www.fxcm.com):
CFDs are complex instruments and come with a high risk of losing money rapidly due to leverage. 64% of retail investor accounts lose money when trading CFDs with this provider. You should consider whether you understand how CFDs work and whether you can afford to take the high risk of losing your money.
Stratos Europe Ltd (www.fxcm.com):
CFDs are complex instruments and come with a high risk of losing money rapidly due to leverage. 66% of retail investor accounts lose money when trading CFDs with this provider. You should consider whether you understand how CFDs work and whether you can afford to take the high risk of losing your money.
Stratos Trading Pty. Limited (www.fxcm.com):
Trading FX/CFDs carries significant risks. FXCM AU (AFSL 309763), please read the Financial Services Guide, Product Disclosure Statement, Target Market Determination and Terms of Business at www.fxcm.com
Stratos Global LLC (www.fxcm.com):
Losses can exceed deposits.
Please be advised that the information presented on TradingView is provided to FXCM (‘Company’, ‘we’) by a third-party provider (‘TFA Global Pte Ltd’). Please be reminded that you are solely responsible for the trading decisions on your account. There is a very high degree of risk involved in trading. Any information and/or content is intended entirely for research, educational and informational purposes only and does not constitute investment or consultation advice or investment strategy. The information is not tailored to the investment needs of any specific person and therefore does not involve a consideration of any of the investment objectives, financial situation or needs of any viewer that may receive it. Kindly also note that past performance is not a reliable indicator of future results. Actual results may differ materially from those anticipated in forward-looking or past performance statements. We assume no liability as to the accuracy or completeness of any of the information and/or content provided herein and the Company cannot be held responsible for any omission, mistake nor for any loss or damage including without limitation to any loss of profit which may arise from reliance on any information supplied by TFA Global Pte Ltd.
The speaker(s) is neither an employee, agent nor representative of FXCM and is therefore acting independently. The opinions given are their own, constitute general market commentary, and do not constitute the opinion or advice of FXCM or any form of personal or investment advice. FXCM neither endorses nor guarantees offerings of third party speakers, nor is FXCM responsible for the content, veracity or opinions of third-party speakers, presenters or participants.

Nasdaq - It All Comes Down To This Month!Nasdaq ( TVC:NDQ ) is at a crucial breakout level:
Click chart above to see the detailed analysis👆🏻
The Nasdaq rallied an incredible +25% over the past couple of months and is now actually also breaking a major resistance trendline towards the upside. This could still turn into a false breakout but if it doesn't, we will most likely see a flourishing stock market year of 2025
Levels to watch: $21.000, $28.000
Keep your long term vision,
Philip (BasicTrading)

Potential bullish rise?S&P500 has reacted off the resistance level which is an overlap resistance and could rise from this level to our take profit.
Entry: 5,995.10
Why we like it:
There is an overlap resistance level.
Stop loss: 5,936.66
Why we like it:
There is an overlap support level.
Take profit: 6,110.04
Why we like it:
There is a pullback resistance level that lies up with the 100% Fibonacci projection.
Enjoying your TradingView experience? Review us!
Please be advised that the information presented on TradingView is provided to Vantage (‘Vantage Global Limited’, ‘we’) by a third-party provider (‘Everest Fortune Group’). Please be reminded that you are solely responsible for the trading decisions on your account. There is a very high degree of risk involved in trading. Any information and/or content is intended entirely for research, educational and informational purposes only and does not constitute investment or consultation advice or investment strategy. The information is not tailored to the investment needs of any specific person and therefore does not involve a consideration of any of the investment objectives, financial situation or needs of any viewer that may receive it. Kindly also note that past performance is not a reliable indicator of future results. Actual results may differ materially from those anticipated in forward-looking or past performance statements. We assume no liability as to the accuracy or completeness of any of the information and/or content provided herein and the Company cannot be held responsible for any omission, mistake nor for any loss or damage including without limitation to any loss of profit which may arise from reliance on any information supplied by Everest Fortune Group.

S&P500: Recovery mode activated. Next stop 6,200.S&P500 turned neutral on its 1D technical outlook (RSI = 54.702, MACD = 16.670, ADX = 24.717) as it rebounded near the 1D MA100, which happened to be just under the bottom of the long term Channel Up and has recovered more than 50% of last week's correction. In the meantime, the 1D RSI is making a bullish reversal idential to the last two bottoms. The two prior bullish waves of the Channel Up topped on the 1.786 Fibonacci extension. That is our target (TP = 6,200).
## If you like our free content follow our profile to get more daily ideas. ##
## Comments and likes are greatly appreciated. ##

DJIA H4 | Potential bearish reversalDJIA (US30) is rising towards an overlap resistance and could potentially reverse off this level to drop lower.
Sell entry is at 43,058.41 which is an overlap resistance that aligns close to a 38.2% Fibonacci retracement.
Stop loss is at 43,850.00 which is a level that sits above the 50.0% Fibonacci retracement and a pullback resistance.
Take profit is at 42,139.85 which is a swing-low support.
High Risk Investment Warning
Trading Forex/CFDs on margin carries a high level of risk and may not be suitable for all investors. Leverage can work against you.
Stratos Markets Limited (www.fxcm.com):
CFDs are complex instruments and come with a high risk of losing money rapidly due to leverage. 64% of retail investor accounts lose money when trading CFDs with this provider. You should consider whether you understand how CFDs work and whether you can afford to take the high risk of losing your money.
Stratos Europe Ltd (www.fxcm.com):
CFDs are complex instruments and come with a high risk of losing money rapidly due to leverage. 66% of retail investor accounts lose money when trading CFDs with this provider. You should consider whether you understand how CFDs work and whether you can afford to take the high risk of losing your money.
Stratos Trading Pty. Limited (www.fxcm.com):
Trading FX/CFDs carries significant risks. FXCM AU (AFSL 309763), please read the Financial Services Guide, Product Disclosure Statement, Target Market Determination and Terms of Business at www.fxcm.com
Stratos Global LLC (www.fxcm.com):
Losses can exceed deposits.
Please be advised that the information presented on TradingView is provided to FXCM (‘Company’, ‘we’) by a third-party provider (‘TFA Global Pte Ltd’). Please be reminded that you are solely responsible for the trading decisions on your account. There is a very high degree of risk involved in trading. Any information and/or content is intended entirely for research, educational and informational purposes only and does not constitute investment or consultation advice or investment strategy. The information is not tailored to the investment needs of any specific person and therefore does not involve a consideration of any of the investment objectives, financial situation or needs of any viewer that may receive it. Kindly also note that past performance is not a reliable indicator of future results. Actual results may differ materially from those anticipated in forward-looking or past performance statements. We assume no liability as to the accuracy or completeness of any of the information and/or content provided herein and the Company cannot be held responsible for any omission, mistake nor for any loss or damage including without limitation to any loss of profit which may arise from reliance on any information supplied by TFA Global Pte Ltd.
The speaker(s) is neither an employee, agent nor representative of FXCM and is therefore acting independently. The opinions given are their own, constitute general market commentary, and do not constitute the opinion or advice of FXCM or any form of personal or investment advice. FXCM neither endorses nor guarantees offerings of third party speakers, nor is FXCM responsible for the content, veracity or opinions of third-party speakers, presenters or participants.

Overlap resistance ahead?Dow Jones (US30) is rising towards the pivot which has been identified as an overlap resistance and could drop to the 1st support which is a pullback support.
Pivot: 43,351.87
1st Support: 41,852.98
1st Resistance: 44,363.95
Risk Warning:
Trading Forex and CFDs carries a high level of risk to your capital and you should only trade with money you can afford to lose. Trading Forex and CFDs may not be suitable for all investors, so please ensure that you fully understand the risks involved and seek independent advice if necessary.
Disclaimer:
The above opinions given constitute general market commentary, and do not constitute the opinion or advice of IC Markets or any form of personal or investment advice.
Any opinions, news, research, analyses, prices, other information, or links to third-party sites contained on this website are provided on an "as-is" basis, are intended only to be informative, is not an advice nor a recommendation, nor research, or a record of our trading prices, or an offer of, or solicitation for a transaction in any financial instrument and thus should not be treated as such. The information provided does not involve any specific investment objectives, financial situation and needs of any specific person who may receive it. Please be aware, that past performance is not a reliable indicator of future performance and/or results. Past Performance or Forward-looking scenarios based upon the reasonable beliefs of the third-party provider are not a guarantee of future performance. Actual results may differ materially from those anticipated in forward-looking or past performance statements. IC Markets makes no representation or warranty and assumes no liability as to the accuracy or completeness of the information provided, nor any loss arising from any investment based on a recommendation, forecast or any information supplied by any third-party.

S&P 500 Daily Chart Analysis For Week of Dec 20, 2024Technical Analysis and Outlook:
During this week's trading, the S&P 500 index exhibited considerable volatility after reaching our critical support level of Mean Support 5870. Subsequently, it demonstrated a robust upward recovery. This development is anticipated to facilitate the impending phase of the renewed interim rebound, with the objective of retesting the Key Resistance level at 6090, thereby paving the way for continuing the bullish trend. However, it is crucial to recognize that a retest of the Mean Support 5870 remains a great possibility.

S&P500 5 month Channel Up bottomed. Bullish reversal started.S&P500 / US500 is trading inside a Channel Up since the August 5th bottom.
Wednesday's Fed fueled correction crossed under the 1day MA50 but stabilized yesterday and today found support over the 1day MA100 and rebounded.
This low is very close to the bottom of the Channel Up and the 1day MA100 was the level that supported the early September pull back.
The 1day RSI is also reversing, and the 3 times it posted a similar pattern inside the Channel Up, it was a bottom.
Buy and target 6200 (+7.10% from the bottom).
Previous chart:
Follow us, like the idea and leave a comment below!!

NASDAQ Is Close To The Main Trend And Support!Hey Traders, in today's trading session we are monitoring NAS100 for a buying opportunity around 20,500 zone, NASDAQ is trading in an uptrend and currently is in a correction phase in which it is approaching the trend at 20500 support and resistance area.
Trade safe, Joe.
