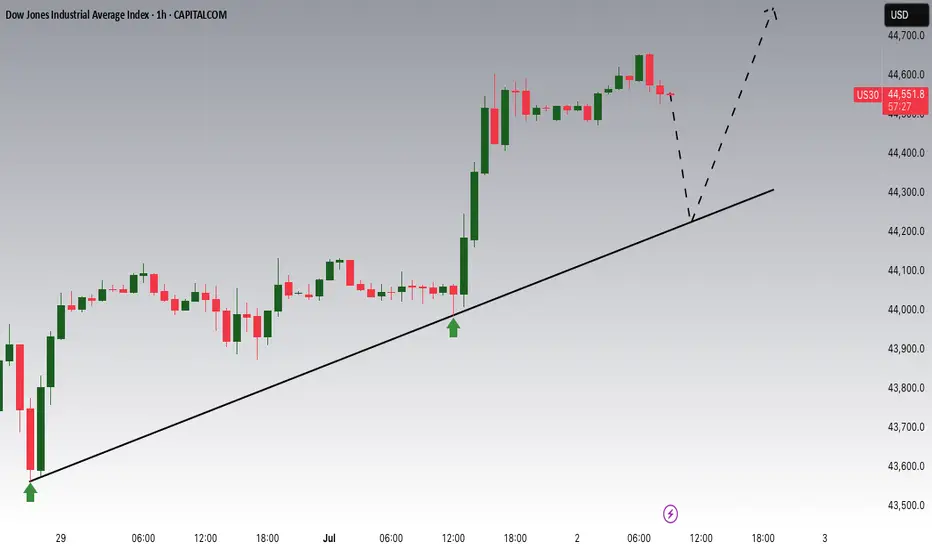
US30 Potential UpsidesHey Traders, in today's trading session we are monitoring US30 for a buying opportunity around 44,230 zone, Dow Jones is trading in an uptrend and currently is in a correction phase in which it is approaching the trend at 44,230 support and resistance area.
Trade safe, Joe.
Indices
S&P500: Once it breaks the 1W MA50, it doesn't look back.S&P500 has turned overbought on its 1D technical outlook (RSI = 75.570, MACD = 96.940, ADX = 23.950) and rightly so as it is extending the rally after crossing above the 1W MA50. The Channel Up since late 2011 shows that when the index crosses above its 1W MA50, it tends to spend a notable time over it (and every contact is a buy opportunity), with the most recent example being the March 2023 - December 2024 period. The shortest such period has been in 2019, which was suddently disrupted by the black Swan event of COVID. We may have gotten out of a similar situation as Trump's tariffs disrupted the uptrend earlier this year with a huge, unexpected correction. There 1W MA200 supported and this brings us to a new 'above the 1W MA50 bullish phase', which even if it is as short as 2019, it can still target 7,000.
See how our prior idea has worked out:
## If you like our free content follow our profile to get more daily ideas. ##
## Comments and likes are greatly appreciated. ##

FTSE100 H1 | Approaching a multi-swing-high resistanceThe FTSE100 (UK100) is rising towards a multi-swing-high resistance and could potentially reverse off this level to drop lower.
Sell entry is at 8,825.21 which is a multi-swing-high resistance.
Stop loss is at 8,855.00 which is a level that sits above the 127.2% Fibonacci extension and a swing-high resistance.
Take profit is at 8,791.98 which is a pullback support.
High Risk Investment Warning
Trading Forex/CFDs on margin carries a high level of risk and may not be suitable for all investors. Leverage can work against you.
Stratos Markets Limited (tradu.com ):
CFDs are complex instruments and come with a high risk of losing money rapidly due to leverage. 63% of retail investor accounts lose money when trading CFDs with this provider. You should consider whether you understand how CFDs work and whether you can afford to take the high risk of losing your money.
Stratos Europe Ltd (tradu.com ):
CFDs are complex instruments and come with a high risk of losing money rapidly due to leverage. 63% of retail investor accounts lose money when trading CFDs with this provider. You should consider whether you understand how CFDs work and whether you can afford to take the high risk of losing your money.
Stratos Global LLC (tradu.com ):
Losses can exceed deposits.
Please be advised that the information presented on TradingView is provided to Tradu (‘Company’, ‘we’) by a third-party provider (‘TFA Global Pte Ltd’). Please be reminded that you are solely responsible for the trading decisions on your account. There is a very high degree of risk involved in trading. Any information and/or content is intended entirely for research, educational and informational purposes only and does not constitute investment or consultation advice or investment strategy. The information is not tailored to the investment needs of any specific person and therefore does not involve a consideration of any of the investment objectives, financial situation or needs of any viewer that may receive it. Kindly also note that past performance is not a reliable indicator of future results. Actual results may differ materially from those anticipated in forward-looking or past performance statements. We assume no liability as to the accuracy or completeness of any of the information and/or content provided herein and the Company cannot be held responsible for any omission, mistake nor for any loss or damage including without limitation to any loss of profit which may arise from reliance on any information supplied by TFA Global Pte Ltd.
The speaker(s) is neither an employee, agent nor representative of Tradu and is therefore acting independently. The opinions given are their own, constitute general market commentary, and do not constitute the opinion or advice of Tradu or any form of personal or investment advice. Tradu neither endorses nor guarantees offerings of third-party speakers, nor is Tradu responsible for the content, veracity or opinions of third-party speakers, presenters or participants.

Nikkei 225 H1 | Potential bullish bounceThe Nikkei 225 (JPN225) is falling towards an overlap support and could potentially bounce off this level to climb higher.
Buy entry is at 39,552.68 which is an overlap support that aligns with the 50% Fibonacci retracement.
Stop loss is at 38,850.00 which is a level that lies underneath an overlap support and the 61.8% Fibonacci retracement.
Take profit is at 40,453.12 which is an overlap resistance that aligns with the 61.8% Fibonacci retracement.
High Risk Investment Warning
Trading Forex/CFDs on margin carries a high level of risk and may not be suitable for all investors. Leverage can work against you.
Stratos Markets Limited (tradu.com ):
CFDs are complex instruments and come with a high risk of losing money rapidly due to leverage. 63% of retail investor accounts lose money when trading CFDs with this provider. You should consider whether you understand how CFDs work and whether you can afford to take the high risk of losing your money.
Stratos Europe Ltd (tradu.com ):
CFDs are complex instruments and come with a high risk of losing money rapidly due to leverage. 63% of retail investor accounts lose money when trading CFDs with this provider. You should consider whether you understand how CFDs work and whether you can afford to take the high risk of losing your money.
Stratos Global LLC (tradu.com ):
Losses can exceed deposits.
Please be advised that the information presented on TradingView is provided to Tradu (‘Company’, ‘we’) by a third-party provider (‘TFA Global Pte Ltd’). Please be reminded that you are solely responsible for the trading decisions on your account. There is a very high degree of risk involved in trading. Any information and/or content is intended entirely for research, educational and informational purposes only and does not constitute investment or consultation advice or investment strategy. The information is not tailored to the investment needs of any specific person and therefore does not involve a consideration of any of the investment objectives, financial situation or needs of any viewer that may receive it. Kindly also note that past performance is not a reliable indicator of future results. Actual results may differ materially from those anticipated in forward-looking or past performance statements. We assume no liability as to the accuracy or completeness of any of the information and/or content provided herein and the Company cannot be held responsible for any omission, mistake nor for any loss or damage including without limitation to any loss of profit which may arise from reliance on any information supplied by TFA Global Pte Ltd.
The speaker(s) is neither an employee, agent nor representative of Tradu and is therefore acting independently. The opinions given are their own, constitute general market commentary, and do not constitute the opinion or advice of Tradu or any form of personal or investment advice. Tradu neither endorses nor guarantees offerings of third-party speakers, nor is Tradu responsible for the content, veracity or opinions of third-party speakers, presenters or participants.

DAX H4 | Heading into a swing-high resistanceThe DAX (GER30) is rising towards a swing-high resistance and could potentially reverse off this level to drop lower.
Sell entry is at 24,104.89 which is a swing-high resistance that aligns closely with the 78.6% Fibonacci retracement.
Stop loss is at 24,380.00 which is a level that sits above the 127.2% Fibonacci extension and a swing-high resistance.
Take profit is at 23,714.12 which is an overlap support.
High Risk Investment Warning
Trading Forex/CFDs on margin carries a high level of risk and may not be suitable for all investors. Leverage can work against you.
Stratos Markets Limited (tradu.com ):
CFDs are complex instruments and come with a high risk of losing money rapidly due to leverage. 63% of retail investor accounts lose money when trading CFDs with this provider. You should consider whether you understand how CFDs work and whether you can afford to take the high risk of losing your money.
Stratos Europe Ltd (tradu.com ):
CFDs are complex instruments and come with a high risk of losing money rapidly due to leverage. 63% of retail investor accounts lose money when trading CFDs with this provider. You should consider whether you understand how CFDs work and whether you can afford to take the high risk of losing your money.
Stratos Global LLC (tradu.com ):
Losses can exceed deposits.
Please be advised that the information presented on TradingView is provided to Tradu (‘Company’, ‘we’) by a third-party provider (‘TFA Global Pte Ltd’). Please be reminded that you are solely responsible for the trading decisions on your account. There is a very high degree of risk involved in trading. Any information and/or content is intended entirely for research, educational and informational purposes only and does not constitute investment or consultation advice or investment strategy. The information is not tailored to the investment needs of any specific person and therefore does not involve a consideration of any of the investment objectives, financial situation or needs of any viewer that may receive it. Kindly also note that past performance is not a reliable indicator of future results. Actual results may differ materially from those anticipated in forward-looking or past performance statements. We assume no liability as to the accuracy or completeness of any of the information and/or content provided herein and the Company cannot be held responsible for any omission, mistake nor for any loss or damage including without limitation to any loss of profit which may arise from reliance on any information supplied by TFA Global Pte Ltd.
The speaker(s) is neither an employee, agent nor representative of Tradu and is therefore acting independently. The opinions given are their own, constitute general market commentary, and do not constitute the opinion or advice of Tradu or any form of personal or investment advice. Tradu neither endorses nor guarantees offerings of third-party speakers, nor is Tradu responsible for the content, veracity or opinions of third-party speakers, presenters or participants.

NASDAQ: Almost overbought but with no stop on this uptrend.Nasdaq is about to turn overbought on its 1D technical outlook (RSI = 68.420, MACD = 402.410, ADX = 22.800) but the current bullish wave shows no signs of stopping yet. The Channel Up since the April bottom indicates that a +9.50% rise is very likely before the next technical pullback, especially as long as the 1D MA50 is holding. Stay long, TP = 23,400.
## If you like our free content follow our profile to get more daily ideas. ##
## Comments and likes are greatly appreciated. ##

Russell 2000 H4 | Falling toward a pullback supportThe Russell 2000 (US2000) is falling towards a pullback support and could potentially bounce off this level to climb higher.
Buy entry is at 2,163.07 which is a pullback support that aligns with the 23.6% Fibonacci retracement.
Stop loss is at 2,130.00 which is a level that lies underneath an overlap support and the 50% Fibonacci retracement.
Take profit is at 2,215.08 which is an overlap resistance.
High Risk Investment Warning
Trading Forex/CFDs on margin carries a high level of risk and may not be suitable for all investors. Leverage can work against you.
Stratos Markets Limited (tradu.com ):
CFDs are complex instruments and come with a high risk of losing money rapidly due to leverage. 63% of retail investor accounts lose money when trading CFDs with this provider. You should consider whether you understand how CFDs work and whether you can afford to take the high risk of losing your money.
Stratos Europe Ltd (tradu.com ):
CFDs are complex instruments and come with a high risk of losing money rapidly due to leverage. 63% of retail investor accounts lose money when trading CFDs with this provider. You should consider whether you understand how CFDs work and whether you can afford to take the high risk of losing your money.
Stratos Global LLC (tradu.com ):
Losses can exceed deposits.
Please be advised that the information presented on TradingView is provided to Tradu (‘Company’, ‘we’) by a third-party provider (‘TFA Global Pte Ltd’). Please be reminded that you are solely responsible for the trading decisions on your account. There is a very high degree of risk involved in trading. Any information and/or content is intended entirely for research, educational and informational purposes only and does not constitute investment or consultation advice or investment strategy. The information is not tailored to the investment needs of any specific person and therefore does not involve a consideration of any of the investment objectives, financial situation or needs of any viewer that may receive it. Kindly also note that past performance is not a reliable indicator of future results. Actual results may differ materially from those anticipated in forward-looking or past performance statements. We assume no liability as to the accuracy or completeness of any of the information and/or content provided herein and the Company cannot be held responsible for any omission, mistake nor for any loss or damage including without limitation to any loss of profit which may arise from reliance on any information supplied by TFA Global Pte Ltd.
The speaker(s) is neither an employee, agent nor representative of Tradu and is therefore acting independently. The opinions given are their own, constitute general market commentary, and do not constitute the opinion or advice of Tradu or any form of personal or investment advice. Tradu neither endorses nor guarantees offerings of third-party speakers, nor is Tradu responsible for the content, veracity or opinions of third-party speakers, presenters or participants.

July Seasonality Patterns For Index, Metals and ForexSeasonality can be a useful tool if used wisely (and in context) with current sentiment and news flows. Seasonality really is a backwards looking indicator that can easily be overpowered by key macro drivers. But its strength comes in to play when seasonality aligns with the macro landscape.
With that in mind, I share my seasonality matrix for indices, metals and USD FX pairs to highlight potential patterns for July, then wrap up with an update on my Nasdaq 100 analysis.
Matt Simpson, Market Analyst at City Index and Forex.com.

DOW JONES: Final phase of bullish wave has started.Dow is practically overbought on its 1D technical outlook (RSI = 69.306, MACD = 518.450, ADX = 36.217) but that should little affect the heavily bullish price action on the long term. The reason is that after the April bounce on the 1W MA200, Dow entered the final phase of the Bull Cycle that started on the October 2022 bottom and according to all prior bullish waves inside the 16 year Channel Up, it should rise by a minimum of +71%. That gives a TP = 49,000.
## If you like our free content follow our profile to get more daily ideas. ##
## Comments and likes are greatly appreciated. ##

Bullish momentum to extend?DJ30 is falling towards the support level which is a pullback support and could bounce from this level to our take profit.
Entry: 42,853.55
Why we like it:
There is a pullback support level.
Stop loss: 41,577.28
Why we like it:
There is a pullback support level.
Take profit: 45,132.60
Why we like it:
There is a pullback resistance that lines up with the 61.8% Fibonacci projection.
Enjoying your TradingView experience? Review us!
Please be advised that the information presented on TradingView is provided to Vantage (‘Vantage Global Limited’, ‘we’) by a third-party provider (‘Everest Fortune Group’). Please be reminded that you are solely responsible for the trading decisions on your account. There is a very high degree of risk involved in trading. Any information and/or content is intended entirely for research, educational and informational purposes only and does not constitute investment or consultation advice or investment strategy. The information is not tailored to the investment needs of any specific person and therefore does not involve a consideration of any of the investment objectives, financial situation or needs of any viewer that may receive it. Kindly also note that past performance is not a reliable indicator of future results. Actual results may differ materially from those anticipated in forward-looking or past performance statements. We assume no liability as to the accuracy or completeness of any of the information and/or content provided herein and the Company cannot be held responsible for any omission, mistake nor for any loss or damage including without limitation to any loss of profit which may arise from reliance on any information supplied by Everest Fortune Group.

DAX H4 | Bullish uptrend to extend further?The DAX (GER30) could fall towards a pullback support and potentially bounce off this level to climb higher.
Buy entry is at 24,077.90 which is a pullback support.
Stop loss is at 23,850.00 which is a level that lies underneath a pullback support and a Fibonacci confluence zone identified by the 23.6% and 38.2% retracements.
Take profit is at 24,369.51 which is a multi-swing-high resistance.
High Risk Investment Warning
Trading Forex/CFDs on margin carries a high level of risk and may not be suitable for all investors. Leverage can work against you.
Stratos Markets Limited (tradu.com ):
CFDs are complex instruments and come with a high risk of losing money rapidly due to leverage. 63% of retail investor accounts lose money when trading CFDs with this provider. You should consider whether you understand how CFDs work and whether you can afford to take the high risk of losing your money.
Stratos Europe Ltd (tradu.com ):
CFDs are complex instruments and come with a high risk of losing money rapidly due to leverage. 63% of retail investor accounts lose money when trading CFDs with this provider. You should consider whether you understand how CFDs work and whether you can afford to take the high risk of losing your money.
Stratos Global LLC (tradu.com ):
Losses can exceed deposits.
Please be advised that the information presented on TradingView is provided to Tradu (‘Company’, ‘we’) by a third-party provider (‘TFA Global Pte Ltd’). Please be reminded that you are solely responsible for the trading decisions on your account. There is a very high degree of risk involved in trading. Any information and/or content is intended entirely for research, educational and informational purposes only and does not constitute investment or consultation advice or investment strategy. The information is not tailored to the investment needs of any specific person and therefore does not involve a consideration of any of the investment objectives, financial situation or needs of any viewer that may receive it. Kindly also note that past performance is not a reliable indicator of future results. Actual results may differ materially from those anticipated in forward-looking or past performance statements. We assume no liability as to the accuracy or completeness of any of the information and/or content provided herein and the Company cannot be held responsible for any omission, mistake nor for any loss or damage including without limitation to any loss of profit which may arise from reliance on any information supplied by TFA Global Pte Ltd.
The speaker(s) is neither an employee, agent nor representative of Tradu and is therefore acting independently. The opinions given are their own, constitute general market commentary, and do not constitute the opinion or advice of Tradu or any form of personal or investment advice. Tradu neither endorses nor guarantees offerings of third-party speakers, nor is Tradu responsible for the content, veracity or opinions of third-party speakers, presenters or participants.

S&P500 Potential UpsidesHey Traders, in today's trading session we are monitoring US500 for a buying opportunity around 6,075 zone, S&P500 is trading in an uptrend and currently is in a correction phase in which it is approaching the trend at 6,075 support and resistance area.
Trade safe, Joe.

NASDAQ Potential UpsidesHey Traders, in today's trading session we are monitoring NAS100 for a buying opportunity around 22,380 zone, NASDAQ is trading in an uptrend and currently is in a correction phase in which it is approaching the trend at 22,380 support and resistance area.
Trade safe, Joe.

S&P 500 Daily Chart Analysis For Week of June 27, 2025Technical Analysis and Outlook:
During the current trading week, the S&P 500 Index has predominantly demonstrated an upward trajectory, surpassing the Mean Resistance level of 6046, the Outer Index Rally target of 6073, and the critical Key Resistance threshold of 6150. Currently, the index is exhibiting a bullish trend, indicating potential movement towards the Outer Index Rally objective of 6235. However, it is essential to note that there is a substantial probability that prices may retract from their current levels to test the Mean Support at 6136 before experiencing a resurgence.

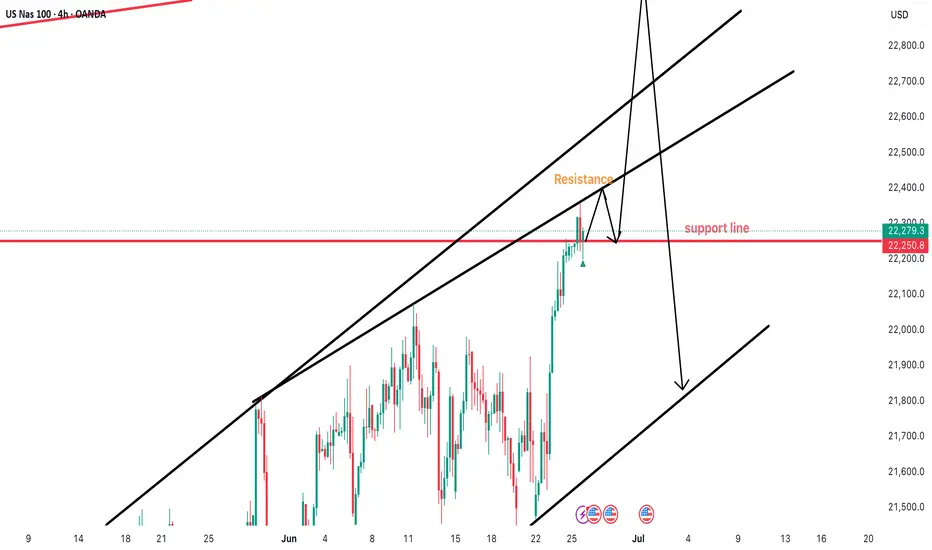
Nasdaq100OANDA:NAS100USD
3. And Then price will begin to push down strong. This will happen only if there will be a very strong spike meaning an incredible amount of sells pushing the price down.

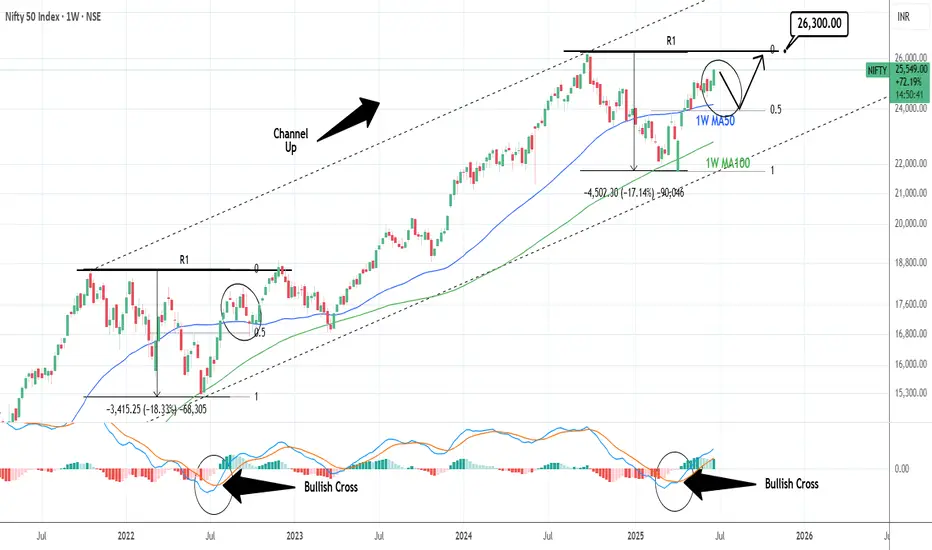
NIFTY: One more opportunity to buy lower.Nifty is on excellent bullish levels on its 1D technical outlook (RSI = 66.330, MACD = 172.380, ADX = 16.480), extending the bullish wave of the 4 year Channel Up. Being close to the R1 already, a pullback to the 0.5 Fib and the 1W MA50 isn't unlikely, as it is what happened in September 2022. That will be our final opportunity to buy low and target the R1 level (TP = 26,300).
## If you like our free content follow our profile to get more daily ideas. ##
## Comments and likes are greatly appreciated. ##
DOW JONES: Technical pullback possible but 43,700 target remainsDow Jones is bullish on its 1D technical outlook (RSI = 62.550, MACD = 276.720, ADX = 11.070), extending the bullish wave of the 1 month Channel Up. This is only the second such wave of this pattern and its first pulled back to the 0.5 Fiboancci retracement level after making a +3.75% rise. It is possible to see such a retrace start either now or tomorrow but on the medium term the bullish target on the 1.236 Fibonacci extension is intact (TP = 43,700).
## If you like our free content follow our profile to get more daily ideas. ##
## Comments and likes are greatly appreciated. ##

DAX H4 | Potential bearish reversalThe DAX (GER30) is rising towards a swing-high resistance and could potentially reverse off this level to drop lower.
Sell entry is at 23,740.18 which is a swing-high resistance.
Stop loss is at 23,960.00 which is a level that sits above the 61.8% Fibonacci retracement and an overlap resistance.
Take profit is at 23,341.19 which is a pullback support that aligns with the 61.8% Fibonacci retracement.
High Risk Investment Warning
Trading Forex/CFDs on margin carries a high level of risk and may not be suitable for all investors. Leverage can work against you.
Stratos Markets Limited (tradu.com ):
CFDs are complex instruments and come with a high risk of losing money rapidly due to leverage. 63% of retail investor accounts lose money when trading CFDs with this provider. You should consider whether you understand how CFDs work and whether you can afford to take the high risk of losing your money.
Stratos Europe Ltd (tradu.com ):
CFDs are complex instruments and come with a high risk of losing money rapidly due to leverage. 63% of retail investor accounts lose money when trading CFDs with this provider. You should consider whether you understand how CFDs work and whether you can afford to take the high risk of losing your money.
Stratos Global LLC (tradu.com ):
Losses can exceed deposits.
Please be advised that the information presented on TradingView is provided to Tradu (‘Company’, ‘we’) by a third-party provider (‘TFA Global Pte Ltd’). Please be reminded that you are solely responsible for the trading decisions on your account. There is a very high degree of risk involved in trading. Any information and/or content is intended entirely for research, educational and informational purposes only and does not constitute investment or consultation advice or investment strategy. The information is not tailored to the investment needs of any specific person and therefore does not involve a consideration of any of the investment objectives, financial situation or needs of any viewer that may receive it. Kindly also note that past performance is not a reliable indicator of future results. Actual results may differ materially from those anticipated in forward-looking or past performance statements. We assume no liability as to the accuracy or completeness of any of the information and/or content provided herein and the Company cannot be held responsible for any omission, mistake nor for any loss or damage including without limitation to any loss of profit which may arise from reliance on any information supplied by TFA Global Pte Ltd.
The speaker(s) is neither an employee, agent nor representative of Tradu and is therefore acting independently. The opinions given are their own, constitute general market commentary, and do not constitute the opinion or advice of Tradu or any form of personal or investment advice. Tradu neither endorses nor guarantees offerings of third-party speakers, nor is Tradu responsible for the content, veracity or opinions of third-party speakers, presenters or participants.

Bullish bounce for the Dow Jones?The price is falling towards the pivot which has been identified as an overlap support and could bounce from this level to our take profit.
Pivot: 42,588.80
1st Support: 42,119.27
1st Resistance: 43,222.33
Risk Warning:
Trading Forex and CFDs carries a high level of risk to your capital and you should only trade with money you can afford to lose. Trading Forex and CFDs may not be suitable for all investors, so please ensure that you fully understand the risks involved and seek independent advice if necessary.
Disclaimer:
The above opinions given constitute general market commentary, and do not constitute the opinion or advice of IC Markets or any form of personal or investment advice.
Any opinions, news, research, analyses, prices, other information, or links to third-party sites contained on this website are provided on an "as-is" basis, are intended only to be informative, is not an advice nor a recommendation, nor research, or a record of our trading prices, or an offer of, or solicitation for a transaction in any financial instrument and thus should not be treated as such. The information provided does not involve any specific investment objectives, financial situation and needs of any specific person who may receive it. Please be aware, that past performance is not a reliable indicator of future performance and/or results. Past Performance or Forward-looking scenarios based upon the reasonable beliefs of the third-party provider are not a guarantee of future performance. Actual results may differ materially from those anticipated in forward-looking or past performance statements. IC Markets makes no representation or warranty and assumes no liability as to the accuracy or completeness of the information provided, nor any loss arising from any investment based on a recommendation, forecast or any information supplied by any third-party.

Bullish bounce off 50% Fibonacci support?DAX40 (DE40) is falling towards the pivot and could bounce to the 1st resistance.
Pivot: 23,409.26
1st Support: 23,261.27
1st Resistance: 23,759.37
Risk Warning:
Trading Forex and CFDs carries a high level of risk to your capital and you should only trade with money you can afford to lose. Trading Forex and CFDs may not be suitable for all investors, so please ensure that you fully understand the risks involved and seek independent advice if necessary.
Disclaimer:
The above opinions given constitute general market commentary, and do not constitute the opinion or advice of IC Markets or any form of personal or investment advice.
Any opinions, news, research, analyses, prices, other information, or links to third-party sites contained on this website are provided on an "as-is" basis, are intended only to be informative, is not an advice nor a recommendation, nor research, or a record of our trading prices, or an offer of, or solicitation for a transaction in any financial instrument and thus should not be treated as such. The information provided does not involve any specific investment objectives, financial situation and needs of any specific person who may receive it. Please be aware, that past performance is not a reliable indicator of future performance and/or results. Past Performance or Forward-looking scenarios based upon the reasonable beliefs of the third-party provider are not a guarantee of future performance. Actual results may differ materially from those anticipated in forward-looking or past performance statements. IC Markets makes no representation or warranty and assumes no liability as to the accuracy or completeness of the information provided, nor any loss arising from any investment based on a recommendation, forecast or any information supplied by any third-party.

nasdaq100OANDA:NAS100USD
has reached the previous highest level.
We see that the trendline has made a high possibility of the nasdaq 100 to reach a new high level because the price has gone above the previous high level, and came back to test it.
Now the price is going back up. It is fascinating as to what nasdaq100 will do next and how
other indices will be affected, including Gold and forex...
My opinion on nasdaq100:
1. It has made a different move compared to the previous high levels when they reached this level. Previously when the price reached the horizontal line (the resistance level) price began to push down and create very long spikes.
2. Nasdaq100 will go way too high and spike on that highest trendline. Spike from that level thereby create a new resistance level.
3. And then price will begin to push down strong. This will happen only if there will be a very strong spike meaning an incredible amount of sells pushing the price down.
NASDAQ: Short-lived pullback ahead of major breakout.Nasdaq has entered strong bullish territory on its 1D technical outlook (RSI = 66.290, MACD = 331.080, ADX = 18.600). Despite that, it remains inside a slow moving Channel Up for the past month in contrast to the more aggressive bullish waves of the Channel Up in April and May. The 4H RSI peak may be similar to May 12th and April 24th. We believe that at least a +9.69% rally will emerge to approach the top of this 3 month Channel Up. Stay bullish, TP = 23,400.
## If you like our free content follow our profile to get more daily ideas. ##
## Comments and likes are greatly appreciated. ##

S&P500: Channel Up targeting 6,170.S&P500 is bullish on its 1D technical outlook (RSI = 65.737, MACD = 75.400, ADX = 16.727), unfolding the new bullish wave of the 1 month Channel Up, after a bottom near the 4H MA200. The first bullish wave one reached +4.35%, we expect to repeat that so for a few more candles we will remain bullish, TP = 6,170.
## If you like our free content follow our profile to get more daily ideas. ##
## Comments and likes are greatly appreciated. ##
