Why the 'record high' on Dow Jones underwhelms...Another day, another record high for a US stock market. Only the one seen on the Dow Jones underwhelms given it is not backed up by its own futures market, let alone its peers. We're also approaching end-of-month flows (which can prompt fickle price action). And keep an eye on the Nvidia earnings report on Wednesday (US) which can single-handedly drive sentiment on Wall Street.
Indices

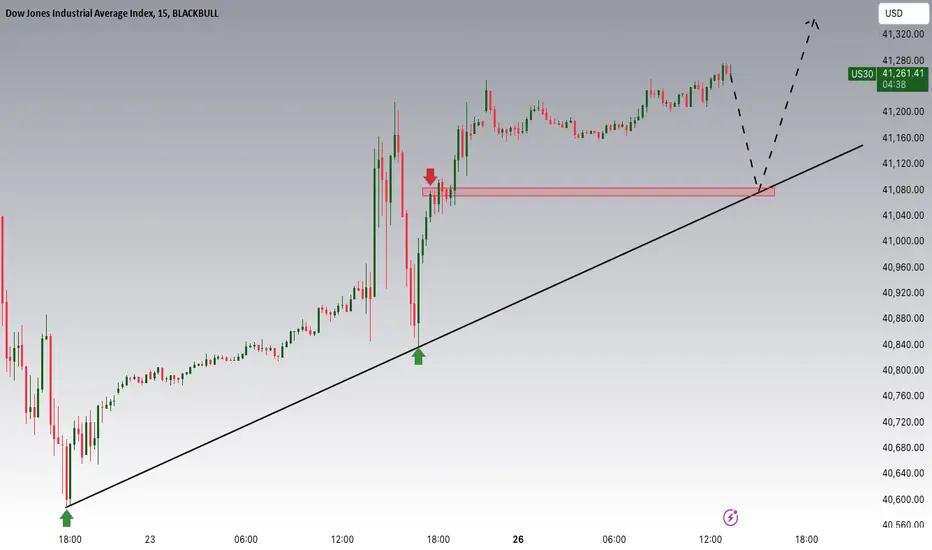
Dow Jones Potential UpsidesHey Traders, in today's trading session we are monitoring US30 for a buying opportunity around 41000 zone, Dow Jones is trading in an uptrend and currently is in a correction phase in which it is approaching the trend at 41000 support and resistance area.
Trade safe, Joe.
SPX500 H4 | Approaching all-time highSPX500 is rising towards a swing-high resistance and could potentially reverse off this level to drop lower.
Sell entry is at 5,673.64 which is a swing-high resistance that aligns close to the all-time high.
Stop loss is at 5,710.00 which is a level that sits above the 127.2% Fibonacci extension level and the all-time high.
Take profit is at 5,579.72 which is an overlap support level.
High Risk Investment Warning
Trading Forex/CFDs on margin carries a high level of risk and may not be suitable for all investors. Leverage can work against you.
Stratos Markets Limited (www.fxcm.com):
CFDs are complex instruments and come with a high risk of losing money rapidly due to leverage. 68% of retail investor accounts lose money when trading CFDs with this provider. You should consider whether you understand how CFDs work and whether you can afford to take the high risk of losing your money.
Stratos Europe Ltd, previously FXCM EU Ltd (www.fxcm.com):
CFDs are complex instruments and come with a high risk of losing money rapidly due to leverage. 73% of retail investor accounts lose money when trading CFDs with this provider. You should consider whether you understand how CFDs work and whether you can afford to take the high risk of losing your money.
Stratos Trading Pty. Limited (www.fxcm.com):
Trading FX/CFDs carries significant risks. FXCM AU (AFSL 309763), please read the Financial Services Guide, Product Disclosure Statement, Target Market Determination and Terms of Business at www.fxcm.com
Stratos Global LLC (www.fxcm.com):
Losses can exceed deposits.
Please be advised that the information presented on TradingView is provided to FXCM (‘Company’, ‘we’) by a third-party provider (‘TFA Global Pte Ltd’). Please be reminded that you are solely responsible for the trading decisions on your account. There is a very high degree of risk involved in trading. Any information and/or content is intended entirely for research, educational and informational purposes only and does not constitute investment or consultation advice or investment strategy. The information is not tailored to the investment needs of any specific person and therefore does not involve a consideration of any of the investment objectives, financial situation or needs of any viewer that may receive it. Kindly also note that past performance is not a reliable indicator of future results. Actual results may differ materially from those anticipated in forward-looking or past performance statements. We assume no liability as to the accuracy or completeness of any of the information and/or content provided herein and the Company cannot be held responsible for any omission, mistake nor for any loss or damage including without limitation to any loss of profit which may arise from reliance on any information supplied by TFA Global Pte Ltd.
The speaker(s) is neither an employee, agent nor representative of FXCM and is therefore acting independently. The opinions given are their own, constitute general market commentary, and do not constitute the opinion or advice of FXCM or any form of personal or investment advice. FXCM neither endorses nor guarantees offerings of third-party speakers, nor is FXCM responsible for the content, veracity or opinions of third-party speakers, presenters or participants.

DOWJOANSDow Jones 4-hour time frame analysis
It can move up to 44000 in case of breaking the zone ceiling.

NASDAQ => Pullback Phase Approaching The Trend!!Hey Traders, in today's trading session we are monitoring NAS100 for a buying opportunity around 19150 zone, NASDAQ is trading in an uptrend and currently is in a correction phase in which it is approaching the trend at 19150 support and resistance area.
Trade safe, Joe.

DXY4-hour time frame DXY analysis
The price is near the zoned swap area.
We have to wait to see if he gives approvals for the climb or not.

DXY Potential Longs from 100.200 back upMy current bias for the dollar is very much bearish, as price has broken structure to the downside once again. While I don’t trade the dollar directly, I use it as a confluence to confirm trade ideas for other pairs like GBP/USD (GU) and EUR/USD (EU). Since I’m looking to short both pairs right now, this bearish outlook on the dollar makes sense.
In scenario (B), I can see the price heading to the 9-hour demand zone, where it might accumulate and then shoot back up to the next supply zone. With the recent break of structure (BOS), a nicely formed 4-hour demand zone is also in play.
Since price is currently in a supply zone, I’ll stick with this bias until the dollar "shows its hand." However, if the dollar slows down and begins to accumulate on Monday, we might see some promising opportunities this week.
Given that this is a counter-trend trade, I’ll be cautious, aiming for high risk-reward ratios while keeping an eye on the nearest demand zone for entries.
Happy trading, guys!

S&P 500 Daily Chart Analysis For Week of Aug 23, 2024Technical Analysis and Outlook:
Throughout the current week's trading session, the S&P 500 Index has demonstrated notable resilience, surpassing the Mean Resistance level of 5564 and positioning itself beneath the attained Inner Index Rally at 5666. The prevailing price action indicates a sustained upward momentum aimed at retesting the completed Interim Index Rally at 5666, with an eye on the subsequent upside objectives represented by the Inner Index Rally at 5745 and the ultimate Outer Index Rally at 5840. It is important to note that the attainment of these targets is likely to prompt a selling price action.

DAX H4 | Approaching pullback resistanceDAX (GER30) is rising towards a pullback resistance and could potentially reverse off this level to drop lower.
Sell entry is at 18,579.74 which is a pullback resistance.
Stop loss is at 18,700.00 which is a level that sits above a swing-high resistance.
Take profit is at 18,302.64 which is a pullback support.
High Risk Investment Warning
Trading Forex/CFDs on margin carries a high level of risk and may not be suitable for all investors. Leverage can work against you.
Stratos Markets Limited (www.fxcm.com):
CFDs are complex instruments and come with a high risk of losing money rapidly due to leverage. 68% of retail investor accounts lose money when trading CFDs with this provider. You should consider whether you understand how CFDs work and whether you can afford to take the high risk of losing your money.
Stratos Europe Ltd, previously FXCM EU Ltd (www.fxcm.com):
CFDs are complex instruments and come with a high risk of losing money rapidly due to leverage. 73% of retail investor accounts lose money when trading CFDs with this provider. You should consider whether you understand how CFDs work and whether you can afford to take the high risk of losing your money.
Stratos Trading Pty. Limited (www.fxcm.com):
Trading FX/CFDs carries significant risks. FXCM AU (AFSL 309763), please read the Financial Services Guide, Product Disclosure Statement, Target Market Determination and Terms of Business at www.fxcm.com
Stratos Global LLC (www.fxcm.com):
Losses can exceed deposits.
Please be advised that the information presented on TradingView is provided to FXCM (‘Company’, ‘we’) by a third-party provider (‘TFA Global Pte Ltd’). Please be reminded that you are solely responsible for the trading decisions on your account. There is a very high degree of risk involved in trading. Any information and/or content is intended entirely for research, educational and informational purposes only and does not constitute investment or consultation advice or investment strategy. The information is not tailored to the investment needs of any specific person and therefore does not involve a consideration of any of the investment objectives, financial situation or needs of any viewer that may receive it. Kindly also note that past performance is not a reliable indicator of future results. Actual results may differ materially from those anticipated in forward-looking or past performance statements. We assume no liability as to the accuracy or completeness of any of the information and/or content provided herein and the Company cannot be held responsible for any omission, mistake nor for any loss or damage including without limitation to any loss of profit which may arise from reliance on any information supplied by TFA Global Pte Ltd.
The speaker(s) is neither an employee, agent nor representative of FXCM and is therefore acting independently. The opinions given are their own, constitute general market commentary, and do not constitute the opinion or advice of FXCM or any form of personal or investment advice. FXCM neither endorses nor guarantees offerings of third-party speakers, nor is FXCM responsible for the content, veracity or opinions of third-party speakers, presenters or participants.

Short Trade of EURUSD1- The Euro Index is reaching a resistance and then falling down
2- The dollar index is reaching its support line and then going up
*** which means EURUSD will be downtrend
TP: 100% of the previous correction swing will be at least the profit
ST: First resistance of the price near above and close to it

I can only see more buys on NASHello everyone, hope we're all having a good day !.
There's not much to be said here, price keeps breaking highs but where price is right now, it needs to do a short pullback to the order block there in my buy tool before it continues the buy...that's pretty much what I'm seeing, nothing much to do.
Use proper risk and money management...kindly wait for NYSE open tomorrow before you start looking for buys around that order block i placed my buy tool and make sure you have your own confirmations as extra confluences !.

Could price reverse from here?Dow Jones (US30) is rising towards the pivot which acts as a pullback resistance and could revers to the 23.6% Fibonacci support.
Pivot: 41,036.40
1st Support: 40,643.17
1st Resistance: 41,405.66
Risk Warning:
Trading Forex and CFDs carries a high level of risk to your capital and you should only trade with money you can afford to lose. Trading Forex and CFDs may not be suitable for all investors, so please ensure that you fully understand the risks involved and seek independent advice if necessary.
Disclaimer:
The above opinions given constitute general market commentary, and do not constitute the opinion or advice of IC Markets or any form of personal or investment advice.
Any opinions, news, research, analyses, prices, other information, or links to third-party sites contained on this website are provided on an "as-is" basis, are intended only to be informative, is not an advice nor a recommendation, nor research, or a record of our trading prices, or an offer of, or solicitation for a transaction in any financial instrument and thus should not be treated as such. The information provided does not involve any specific investment objectives, financial situation and needs of any specific person who may receive it. Please be aware, that past performance is not a reliable indicator of future performance and/or results. Past Performance or Forward-looking scenarios based upon the reasonable beliefs of the third-party provider are not a guarantee of future performance. Actual results may differ materially from those anticipated in forward-looking or past performance statements. IC Markets makes no representation or warranty and assumes no liability as to the accuracy or completeness of the information provided, nor any loss arising from any investment based on a recommendation, forecast or any information supplied by any third-party.

DOLLAR INDEX - DOUBLE TOP Hello Traders !
Previously, The Dollar index formed a bearish double top pattern.
Currently, The price broke the support level (101.770 - 102.075).
So, I expect a bearish move 📉
________________
TARGET: 101.000🎯

US30Dow Jones 4-hour time frame analysis
I expect the price to start correcting from this area until the swap zone is determined.
By seeing confirmation in these areas, we can expect price correction.

US30 shortsConfirmations:
1. Bearish 4hr 1hr Structure, 15 min and 5 min chart
2. Liquidity swept in 4hr 886 zone on 1hr
3.15 min institutional candle in 4hr 886 zone
4. Liquidity was taken on 1hr and trend line liquidity trend line target
5. 4hr imbalance as targets

DJIA H4 | Heading into swing-high resistanceDJIA (US30) is rising towards a swing-high resistance and could potentially reverse off this level to drop lower.
Sell entry is at 41,032.64 which is a swing-high resistance.
Stop loss is at 41,523.00 which is a level that sits above a swing-high resistance at the all-time high.
Take profit is at 40,417.18 which is a pullback support.
High Risk Investment Warning
Trading Forex/CFDs on margin carries a high level of risk and may not be suitable for all investors. Leverage can work against you.
Stratos Markets Limited (www.fxcm.com):
CFDs are complex instruments and come with a high risk of losing money rapidly due to leverage. 68% of retail investor accounts lose money when trading CFDs with this provider. You should consider whether you understand how CFDs work and whether you can afford to take the high risk of losing your money.
Stratos Europe Ltd, previously FXCM EU Ltd (www.fxcm.com):
CFDs are complex instruments and come with a high risk of losing money rapidly due to leverage. 73% of retail investor accounts lose money when trading CFDs with this provider. You should consider whether you understand how CFDs work and whether you can afford to take the high risk of losing your money.
Stratos Trading Pty. Limited (www.fxcm.com):
Trading FX/CFDs carries significant risks. FXCM AU (AFSL 309763), please read the Financial Services Guide, Product Disclosure Statement, Target Market Determination and Terms of Business at www.fxcm.com
Stratos Global LLC (www.fxcm.com):
Losses can exceed deposits.
Please be advised that the information presented on TradingView is provided to FXCM (‘Company’, ‘we’) by a third-party provider (‘TFA Global Pte Ltd’). Please be reminded that you are solely responsible for the trading decisions on your account. There is a very high degree of risk involved in trading. Any information and/or content is intended entirely for research, educational and informational purposes only and does not constitute investment or consultation advice or investment strategy. The information is not tailored to the investment needs of any specific person and therefore does not involve a consideration of any of the investment objectives, financial situation or needs of any viewer that may receive it. Kindly also note that past performance is not a reliable indicator of future results. Actual results may differ materially from those anticipated in forward-looking or past performance statements. We assume no liability as to the accuracy or completeness of any of the information and/or content provided herein and the Company cannot be held responsible for any omission, mistake nor for any loss or damage including without limitation to any loss of profit which may arise from reliance on any information supplied by TFA Global Pte Ltd.
The speaker(s) is neither an employee, agent nor representative of FXCM and is therefore acting independently. The opinions given are their own, constitute general market commentary, and do not constitute the opinion or advice of FXCM or any form of personal or investment advice. FXCM neither endorses nor guarantees offerings of third-party speakers, nor is FXCM responsible for the content, veracity or opinions of third-party speakers, presenters or participants.

Bullish momentum to extend?DJ30 is falling towards the support level which is a pullback support that lines up with the 23.6% Fibonacci retracement and could bounce from this level to our take profit.
Entry: 40,513.44
Why we like it:
There is a pullback support that lines up with the 23.6% Fibonacci retracement.
Stop loss: 40,044.69
Why we like it:
There is a support level which aligns with the 50% Fibonacci retracement.
Take profit: 41,097.91
Why we like it:
There is a pullback resistance.
Please be advised that the information presented on TradingView is provided to Vantage (‘Vantage Global Limited’, ‘we’) by a third-party provider (‘Everest Fortune Group’). Please be reminded that you are solely responsible for the trading decisions on your account. There is a very high degree of risk involved in trading. Any information and/or content is intended entirely for research, educational and informational purposes only and does not constitute investment or consultation advice or investment strategy. The information is not tailored to the investment needs of any specific person and therefore does not involve a consideration of any of the investment objectives, financial situation or needs of any viewer that may receive it. Kindly also note that past performance is not a reliable indicator of future results. Actual results may differ materially from those anticipated in forward-looking or past performance statements. We assume no liability as to the accuracy or completeness of any of the information and/or content provided herein and the Company cannot be held responsible for any omission, mistake nor for any loss or damage including without limitation to any loss of profit which may arise from reliance on any information supplied by Everest Fortune Group.

DXY => Recession Risks and Potential UpsidesHey Traders, in tomorrow's trading session we are monitoring DXY for a buying opportunity around 102.150 zone, DXY is trading in an uptrend and currently is in a correction phase in which it is approaching the trend at 102.150 support and resistance area.
Trade safe, Joe.

ASX futures snap 9-day streak, further downside loomsYesterday I outlined why I was suspicious of the ASX 200 rally, and today I see it has now retraced. The ASX 200 futures market snapped an 11-day streak after forming a bearish pinbar perfectly at a 78.6% Fibonacci level, below the 8,000 handle. Volumes have been declining during the entire ‘rally’ which shows a lack of bullish enthusiasm, and potentially points to a deeper pullback.
A bearish trend has developed on the 1-hour chart, and the support zone ~7917/25 has now been respected as resistance. The bias is to fade into rallies towards that resistance zone in anticipation of a move down to 7860.

GER30 H1 | Potential bullish bounceGER30 is falling towards a pullback support and could potentially bounce off this level to climb higher.
Buy entry is at 18,367.33 which is a pullback support.
Stop loss is at 18,200.00 which is a level that lies underneath a pullback support.
Take profit is at 18,582.14 which is a pullback resistance.
High Risk Investment Warning
Trading Forex/CFDs on margin carries a high level of risk and may not be suitable for all investors. Leverage can work against you.
Stratos Markets Limited (www.fxcm.com):
CFDs are complex instruments and come with a high risk of losing money rapidly due to leverage. 68% of retail investor accounts lose money when trading CFDs with this provider. You should consider whether you understand how CFDs work and whether you can afford to take the high risk of losing your money.
Stratos Europe Ltd, previously FXCM EU Ltd (www.fxcm.com):
CFDs are complex instruments and come with a high risk of losing money rapidly due to leverage. 73% of retail investor accounts lose money when trading CFDs with this provider. You should consider whether you understand how CFDs work and whether you can afford to take the high risk of losing your money.
Stratos Trading Pty. Limited (www.fxcm.com):
Trading FX/CFDs carries significant risks. FXCM AU (AFSL 309763), please read the Financial Services Guide, Product Disclosure Statement, Target Market Determination and Terms of Business at www.fxcm.com
Stratos Global LLC (www.fxcm.com):
Losses can exceed deposits.
Please be advised that the information presented on TradingView is provided to FXCM (‘Company’, ‘we’) by a third-party provider (‘TFA Global Pte Ltd’). Please be reminded that you are solely responsible for the trading decisions on your account. There is a very high degree of risk involved in trading. Any information and/or content is intended entirely for research, educational and informational purposes only and does not constitute investment or consultation advice or investment strategy. The information is not tailored to the investment needs of any specific person and therefore does not involve a consideration of any of the investment objectives, financial situation or needs of any viewer that may receive it. Kindly also note that past performance is not a reliable indicator of future results. Actual results may differ materially from those anticipated in forward-looking or past performance statements. We assume no liability as to the accuracy or completeness of any of the information and/or content provided herein and the Company cannot be held responsible for any omission, mistake nor for any loss or damage including without limitation to any loss of profit which may arise from reliance on any information supplied by TFA Global Pte Ltd.
The speaker(s) is neither an employee, agent nor representative of FXCM and is therefore acting independently. The opinions given are their own, constitute general market commentary, and do not constitute the opinion or advice of FXCM or any form of personal or investment advice. FXCM neither endorses nor guarantees offerings of third-party speakers, nor is FXCM responsible for the content, veracity or opinions of third-party speakers, presenters or participants.

ASX 200 mimics Wall Street's 'risk-on' rally into Jackson HoleOverbought indicators are of little use when markets are obsessed with rate cuts ahead of a key fed speech. Jerome Powell will speak at the Jackson hole symposium and Friday, and expectations for a dovish show are high. And that's helped Wall Street indices extend gains and the allowed the ASX 200 to tag along for the ride. But if this turns out to be a classic 'buy the rumour, sell the fact' tale, traders may need to factor in some of the overbought clues on the daily chart.

Dow jones Potential UpsidesHey Traders, in tomorrow's trading session we are monitoring US30 for a buying opportunity around 40050 zone, Dow Jones is trading in an uptrend and currently is in a correction phase in which it is approaching the trend at 40050 support and resistance area.
Trade safe, Joe.

S&P 500 Daily Chart Analysis For Week of Aug 16, 2024Technical Analysis and Outlook:
The S&P 500 Index demonstrated significant resiliency during this week's trading session, surpassing the Inner Interim Index Rally 5443 target. Following a springy rebound, the current market price action is positioned below the newly established significant Mean Res 5564. Anticipated interim downward pressure toward the Mean Support at 5445 is probable before the index resumes its upward trajectory. The prevailing price action indicates a sustained uptrend towards the Inner Interim Index Rally at 5666, with the achieved targets expected to exert considerable downward pressure.
