NASDAQ: Short-lived pullback ahead of major breakout.Nasdaq has entered strong bullish territory on its 1D technical outlook (RSI = 66.290, MACD = 331.080, ADX = 18.600). Despite that, it remains inside a slow moving Channel Up for the past month in contrast to the more aggressive bullish waves of the Channel Up in April and May. The 4H RSI peak may be similar to May 12th and April 24th. We believe that at least a +9.69% rally will emerge to approach the top of this 3 month Channel Up. Stay bullish, TP = 23,400.
## If you like our free content follow our profile to get more daily ideas. ##
## Comments and likes are greatly appreciated. ##
Indices

S&P500: Channel Up targeting 6,170.S&P500 is bullish on its 1D technical outlook (RSI = 65.737, MACD = 75.400, ADX = 16.727), unfolding the new bullish wave of the 1 month Channel Up, after a bottom near the 4H MA200. The first bullish wave one reached +4.35%, we expect to repeat that so for a few more candles we will remain bullish, TP = 6,170.
## If you like our free content follow our profile to get more daily ideas. ##
## Comments and likes are greatly appreciated. ##

DAX H1 | Rising into an overlap resistanceThe DAX (GER30) is rising towards an overlap resistance and could potentially reverse off this level to drop lower.
Sell entry is at 23,858.94 which is an overlap resistance that aligns closely with the 61.8% Fibonacci retracement.
Stop loss is at 24,200.00 which is a level that sits above the 78.6% Fibonacci retracement and an overlap resistance.
Take profit is at 23,531.83 which is a pullback support that aligns the 38.2% Fibonacci retracement.
High Risk Investment Warning
Trading Forex/CFDs on margin carries a high level of risk and may not be suitable for all investors. Leverage can work against you.
Stratos Markets Limited (tradu.com ):
CFDs are complex instruments and come with a high risk of losing money rapidly due to leverage. 63% of retail investor accounts lose money when trading CFDs with this provider. You should consider whether you understand how CFDs work and whether you can afford to take the high risk of losing your money.
Stratos Europe Ltd (tradu.com ):
CFDs are complex instruments and come with a high risk of losing money rapidly due to leverage. 63% of retail investor accounts lose money when trading CFDs with this provider. You should consider whether you understand how CFDs work and whether you can afford to take the high risk of losing your money.
Stratos Global LLC (tradu.com ):
Losses can exceed deposits.
Please be advised that the information presented on TradingView is provided to Tradu (‘Company’, ‘we’) by a third-party provider (‘TFA Global Pte Ltd’). Please be reminded that you are solely responsible for the trading decisions on your account. There is a very high degree of risk involved in trading. Any information and/or content is intended entirely for research, educational and informational purposes only and does not constitute investment or consultation advice or investment strategy. The information is not tailored to the investment needs of any specific person and therefore does not involve a consideration of any of the investment objectives, financial situation or needs of any viewer that may receive it. Kindly also note that past performance is not a reliable indicator of future results. Actual results may differ materially from those anticipated in forward-looking or past performance statements. We assume no liability as to the accuracy or completeness of any of the information and/or content provided herein and the Company cannot be held responsible for any omission, mistake nor for any loss or damage including without limitation to any loss of profit which may arise from reliance on any information supplied by TFA Global Pte Ltd.
The speaker(s) is neither an employee, agent nor representative of Tradu and is therefore acting independently. The opinions given are their own, constitute general market commentary, and do not constitute the opinion or advice of Tradu or any form of personal or investment advice. Tradu neither endorses nor guarantees offerings of third-party speakers, nor is Tradu responsible for the content, veracity or opinions of third-party speakers, presenters or participants.

Potential bullish rise?DAX40 (DE40) is reacting off the pivot and could rise from this level to the 1st resistance which aligns with the 78.6% Fibonacci retracement.
Pivot: 23,602.60
1st Support: 23,390.34
1st Resistance: 24,148.42
Risk Warning:
Trading Forex and CFDs carries a high level of risk to your capital and you should only trade with money you can afford to lose. Trading Forex and CFDs may not be suitable for all investors, so please ensure that you fully understand the risks involved and seek independent advice if necessary.
Disclaimer:
The above opinions given constitute general market commentary, and do not constitute the opinion or advice of IC Markets or any form of personal or investment advice.
Any opinions, news, research, analyses, prices, other information, or links to third-party sites contained on this website are provided on an "as-is" basis, are intended only to be informative, is not an advice nor a recommendation, nor research, or a record of our trading prices, or an offer of, or solicitation for a transaction in any financial instrument and thus should not be treated as such. The information provided does not involve any specific investment objectives, financial situation and needs of any specific person who may receive it. Please be aware, that past performance is not a reliable indicator of future performance and/or results. Past Performance or Forward-looking scenarios based upon the reasonable beliefs of the third-party provider are not a guarantee of future performance. Actual results may differ materially from those anticipated in forward-looking or past performance statements. IC Markets makes no representation or warranty and assumes no liability as to the accuracy or completeness of the information provided, nor any loss arising from any investment based on a recommendation, forecast or any information supplied by any third-party.

Bullish continuation?S&P500 (US500) is falling towards the pivot which has been identiifed as ab overlap support and could bounce to the 1st resistance.
Pivot: 5,796.40
1st Support: 5,555.95
1st Resistance: 6,091.55
Risk Warning:
Trading Forex and CFDs carries a high level of risk to your capital and you should only trade with money you can afford to lose. Trading Forex and CFDs may not be suitable for all investors, so please ensure that you fully understand the risks involved and seek independent advice if necessary.
Disclaimer:
The above opinions given constitute general market commentary, and do not constitute the opinion or advice of IC Markets or any form of personal or investment advice.
Any opinions, news, research, analyses, prices, other information, or links to third-party sites contained on this website are provided on an "as-is" basis, are intended only to be informative, is not an advice nor a recommendation, nor research, or a record of our trading prices, or an offer of, or solicitation for a transaction in any financial instrument and thus should not be treated as such. The information provided does not involve any specific investment objectives, financial situation and needs of any specific person who may receive it. Please be aware, that past performance is not a reliable indicator of future performance and/or results. Past Performance or Forward-looking scenarios based upon the reasonable beliefs of the third-party provider are not a guarantee of future performance. Actual results may differ materially from those anticipated in forward-looking or past performance statements. IC Markets makes no representation or warranty and assumes no liability as to the accuracy or completeness of the information provided, nor any loss arising from any investment based on a recommendation, forecast or any information supplied by any third-party.

Falling towards major support?Dow Jones (US30) is falling towards the pivot and could bounce to the 1st resistance that aligns with the 78.6% Fibonacci retracement.
Pivot: 41,520.25
1st Support: 40,653.80
1st Resistance: 43,238.47
Risk Warning:
Trading Forex and CFDs carries a high level of risk to your capital and you should only trade with money you can afford to lose. Trading Forex and CFDs may not be suitable for all investors, so please ensure that you fully understand the risks involved and seek independent advice if necessary.
Disclaimer:
The above opinions given constitute general market commentary, and do not constitute the opinion or advice of IC Markets or any form of personal or investment advice.
Any opinions, news, research, analyses, prices, other information, or links to third-party sites contained on this website are provided on an "as-is" basis, are intended only to be informative, is not an advice nor a recommendation, nor research, or a record of our trading prices, or an offer of, or solicitation for a transaction in any financial instrument and thus should not be treated as such. The information provided does not involve any specific investment objectives, financial situation and needs of any specific person who may receive it. Please be aware, that past performance is not a reliable indicator of future performance and/or results. Past Performance or Forward-looking scenarios based upon the reasonable beliefs of the third-party provider are not a guarantee of future performance. Actual results may differ materially from those anticipated in forward-looking or past performance statements. IC Markets makes no representation or warranty and assumes no liability as to the accuracy or completeness of the information provided, nor any loss arising from any investment based on a recommendation, forecast or any information supplied by any third-party.

Nikkei 225 H4 | Rising toward a 61.8% Fibonacci retracementThe Nikkei 225 (JPN225) is rising towards a pullback resistance and could potentially reverse off this level to drop lower.
Sell entry is at 38,651.50 which is a pullback resistance that aligns closely with the 61.8% Fibonacci retracement.
Stop loss is at 39,000.00 which is a level that sits above a multi-swing-high resistance.
Take profit is at 37,840.09 which is a pullback support that aligns closely with the 78.6% Fibonacci retracement.
High Risk Investment Warning
Trading Forex/CFDs on margin carries a high level of risk and may not be suitable for all investors. Leverage can work against you.
Stratos Markets Limited (tradu.com ):
CFDs are complex instruments and come with a high risk of losing money rapidly due to leverage. 63% of retail investor accounts lose money when trading CFDs with this provider. You should consider whether you understand how CFDs work and whether you can afford to take the high risk of losing your money.
Stratos Europe Ltd (tradu.com ):
CFDs are complex instruments and come with a high risk of losing money rapidly due to leverage. 63% of retail investor accounts lose money when trading CFDs with this provider. You should consider whether you understand how CFDs work and whether you can afford to take the high risk of losing your money.
Stratos Global LLC (tradu.com ):
Losses can exceed deposits.
Please be advised that the information presented on TradingView is provided to Tradu (‘Company’, ‘we’) by a third-party provider (‘TFA Global Pte Ltd’). Please be reminded that you are solely responsible for the trading decisions on your account. There is a very high degree of risk involved in trading. Any information and/or content is intended entirely for research, educational and informational purposes only and does not constitute investment or consultation advice or investment strategy. The information is not tailored to the investment needs of any specific person and therefore does not involve a consideration of any of the investment objectives, financial situation or needs of any viewer that may receive it. Kindly also note that past performance is not a reliable indicator of future results. Actual results may differ materially from those anticipated in forward-looking or past performance statements. We assume no liability as to the accuracy or completeness of any of the information and/or content provided herein and the Company cannot be held responsible for any omission, mistake nor for any loss or damage including without limitation to any loss of profit which may arise from reliance on any information supplied by TFA Global Pte Ltd.
The speaker(s) is neither an employee, agent nor representative of Tradu and is therefore acting independently. The opinions given are their own, constitute general market commentary, and do not constitute the opinion or advice of Tradu or any form of personal or investment advice. Tradu neither endorses nor guarantees offerings of third-party speakers, nor is Tradu responsible for the content, veracity or opinions of third-party speakers, presenters or participants.

Dow Jones potential down side moveDow Jones is showing some sign of wanting to go short with also the potential dollar strength coming into the markets and the bond yield markets having a bullish trend for the last couple of months. Dow has reach a full fib extension and we could see some form of retracement continuation.

NASDAQ READY TO CONTINUE THE LONG-TERM WEEKLY BULLISH RUN
FX:NAS100
I just entered this buy trade on Nasdaq on the daily time frame.
The trade setup is a Swing trade following the monthly and weekly orderflow.
The Monthly is bullish, the weekly is also bullish, so I entered on the daily time frame retracement.
My overall take profit is a risk reward of 1:4.

NASDAQ Potential UpsidesHey Traders, in the coming week we are monitoring NAS100 for a buying opportunity around 21,500 zone, NASDAQ is trading in an uptrend and currently is in a correction phase in which it is approaching the trend at 21,500 support and resistance area.
Trade safe, Joe.

S&P 500 Daily Chart Analysis For Week of June 20, 2025Technical Analysis and Outlook:
The S&P 500 Index has primarily exhibited downward trends during this week’s abbreviated trading session, narrowly failing to reach the targeted Mean Support level of 5940, as outlined in the previous Daily Chart Analysis. Currently, the index exhibits a bearish trend, suggesting a potential direction toward the Mean Support level of 5940, with an additional critical support level identified at 5888.
Contrariwise, there exists a substantial likelihood that following the accomplishment of hitting the Mean Support of 5940, the index may experience recovery and ascend toward the Mean Resistance level of 6046. This upward movement could facilitate a resilient rally, ultimately topping in the completion of the Outer Index Rally at 6073, thereby enabling the index to address the Key Resistance level situated at 6150.

SPX vs VIX: Is this a sign of a bullish market?VIX has seen a strong decline in the past 2 months following the massive surge of Feb-March due to the Tariff War. In contrast, the S&P500 rose massively to almost its ATH, which is a natural response as the two assets are negatively correlated. This VIX pattern has been seen during every major market bottom in the past 15 years, the strongest of which was the 2020 COVID crash. This is a sign of a very bullish market, TP = 6,800 by the end of the year.
## If you like our free content follow our profile to get more daily ideas. ##
## Comments and likes are greatly appreciated. ##

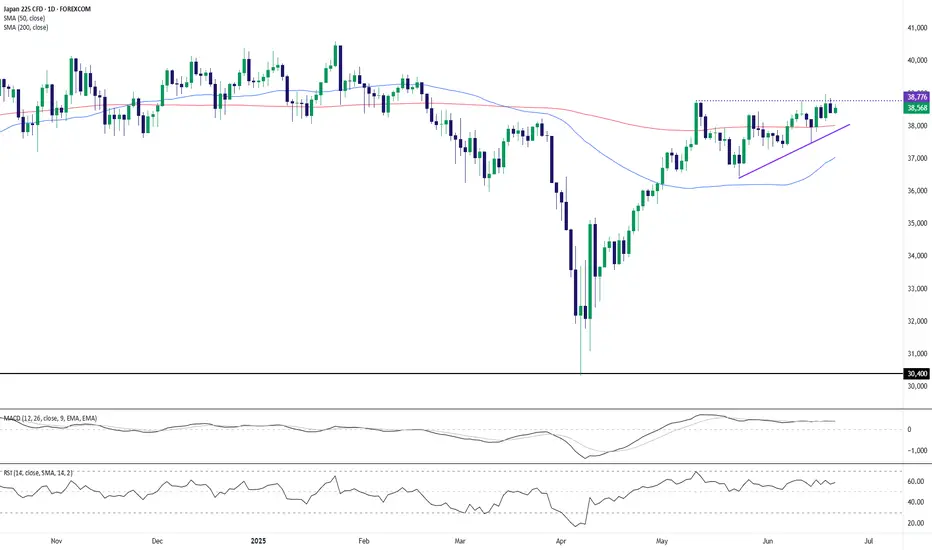
Nikkei 225 Coiling in Ascending Triangle – Breakout Imminent?The Japan 225 (Nikkei) is consolidating just beneath a major resistance level around 38,776, forming a classic ascending triangle pattern. Price has been compressing into higher lows while repeatedly testing the horizontal ceiling, hinting at a potential bullish breakout.
Key Technical Observations:
Pattern Structure: The ascending triangle, defined by rising trendline support and horizontal resistance, suggests bullish pressure is building.
Moving Averages: Price trades above both the 50-day and 200-day SMAs, reinforcing the medium-term bullish trend.
MACD: Remains flat but in positive territory, indicating underlying strength even amid consolidation.
RSI: At 58.7, RSI is neutral to bullish, showing room for further upside before entering overbought territory.
A confirmed breakout above the 38,776 resistance would validate the ascending triangle and potentially trigger a fresh bullish leg. Conversely, a break below the rising trendline would invalidate the pattern and suggest deeper consolidation or correction.
This setup favors bulls as long as the higher lows remain intact. A decisive daily close above resistance could accelerate momentum toward new highs.
-MW
DAX H1 | Downtrend to extend deeper?The DAX (GER30) is rising towards a swing-high resistance and could potentially reverse off this level to drop lower.
Sell entry is at 22,230.41 which is a swing-high resistance that aligns closely with the 23.6% Fibonacci retracement.
Stop loss is at 23,460.00 which is a level that sits above the 50% Fibonacci retracement and a swing-high resistance.
Take profit is at 22,913.31 which is a swing-low support.
High Risk Investment Warning
Trading Forex/CFDs on margin carries a high level of risk and may not be suitable for all investors. Leverage can work against you.
Stratos Markets Limited (tradu.com ):
CFDs are complex instruments and come with a high risk of losing money rapidly due to leverage. 63% of retail investor accounts lose money when trading CFDs with this provider. You should consider whether you understand how CFDs work and whether you can afford to take the high risk of losing your money.
Stratos Europe Ltd (tradu.com ):
CFDs are complex instruments and come with a high risk of losing money rapidly due to leverage. 63% of retail investor accounts lose money when trading CFDs with this provider. You should consider whether you understand how CFDs work and whether you can afford to take the high risk of losing your money.
Stratos Global LLC (tradu.com ):
Losses can exceed deposits.
Please be advised that the information presented on TradingView is provided to Tradu (‘Company’, ‘we’) by a third-party provider (‘TFA Global Pte Ltd’). Please be reminded that you are solely responsible for the trading decisions on your account. There is a very high degree of risk involved in trading. Any information and/or content is intended entirely for research, educational and informational purposes only and does not constitute investment or consultation advice or investment strategy. The information is not tailored to the investment needs of any specific person and therefore does not involve a consideration of any of the investment objectives, financial situation or needs of any viewer that may receive it. Kindly also note that past performance is not a reliable indicator of future results. Actual results may differ materially from those anticipated in forward-looking or past performance statements. We assume no liability as to the accuracy or completeness of any of the information and/or content provided herein and the Company cannot be held responsible for any omission, mistake nor for any loss or damage including without limitation to any loss of profit which may arise from reliance on any information supplied by TFA Global Pte Ltd.
The speaker(s) is neither an employee, agent nor representative of Tradu and is therefore acting independently. The opinions given are their own, constitute general market commentary, and do not constitute the opinion or advice of Tradu or any form of personal or investment advice. Tradu neither endorses nor guarantees offerings of third-party speakers, nor is Tradu responsible for the content, veracity or opinions of third-party speakers, presenters or participants.

S&P 500 H4 | Rising into a pullback resistanceThe S&P 500 (SPX500) is rising towards a pullback resistance and could potentially reverse off this level to drop lower.
Sell entry is at 5,982.20 which is a pullback resistance that aligns with the 50% Fibonacci retracement.
Stop loss is at 6,030.00 which is a level that sits above the 78.6% Fibonacci retracement and a swing-high resistance.
Take profit is at 5,869.32 which is a swing-low support that aligns closely with a 78.6% Fibonacci retracement.
High Risk Investment Warning
Trading Forex/CFDs on margin carries a high level of risk and may not be suitable for all investors. Leverage can work against you.
Stratos Markets Limited (tradu.com ):
CFDs are complex instruments and come with a high risk of losing money rapidly due to leverage. 63% of retail investor accounts lose money when trading CFDs with this provider. You should consider whether you understand how CFDs work and whether you can afford to take the high risk of losing your money.
Stratos Europe Ltd (tradu.com ):
CFDs are complex instruments and come with a high risk of losing money rapidly due to leverage. 63% of retail investor accounts lose money when trading CFDs with this provider. You should consider whether you understand how CFDs work and whether you can afford to take the high risk of losing your money.
Stratos Global LLC (tradu.com ):
Losses can exceed deposits.
Please be advised that the information presented on TradingView is provided to Tradu (‘Company’, ‘we’) by a third-party provider (‘TFA Global Pte Ltd’). Please be reminded that you are solely responsible for the trading decisions on your account. There is a very high degree of risk involved in trading. Any information and/or content is intended entirely for research, educational and informational purposes only and does not constitute investment or consultation advice or investment strategy. The information is not tailored to the investment needs of any specific person and therefore does not involve a consideration of any of the investment objectives, financial situation or needs of any viewer that may receive it. Kindly also note that past performance is not a reliable indicator of future results. Actual results may differ materially from those anticipated in forward-looking or past performance statements. We assume no liability as to the accuracy or completeness of any of the information and/or content provided herein and the Company cannot be held responsible for any omission, mistake nor for any loss or damage including without limitation to any loss of profit which may arise from reliance on any information supplied by TFA Global Pte Ltd.
The speaker(s) is neither an employee, agent nor representative of Tradu and is therefore acting independently. The opinions given are their own, constitute general market commentary, and do not constitute the opinion or advice of Tradu or any form of personal or investment advice. Tradu neither endorses nor guarantees offerings of third-party speakers, nor is Tradu responsible for the content, veracity or opinions of third-party speakers, presenters or participants.

ASX200 short term bias has turned negative.ASX200 - 24h expiry
Short term bias has turned negative.
A shooting star has been posted on the weekly charts.
Bearish divergence is expected to cap gains.
Previous resistance located at 8550.
50 4hour EMA is at 8528.
We look to Sell at 8529 (stop at 8581)
Our profit targets will be 8375 and 8355
Resistance: 8543 / 8574 / 8594
Support: 8476 / 8400 / 8335
Risk Disclaimer
The trade ideas beyond this page are for informational purposes only and do not constitute investment advice or a solicitation to trade. This information is provided by Signal Centre, a third-party unaffiliated with OANDA, and is intended for general circulation only. OANDA does not guarantee the accuracy of this information and assumes no responsibilities for the information provided by the third party. The information does not take into account the specific investment objectives, financial situation, or particular needs of any particular person. You should take into account your specific investment objectives, financial situation, and particular needs before making a commitment to trade, including seeking advice from an independent financial adviser regarding the suitability of the investment, under a separate engagement, as you deem fit.
You accept that you assume all risks in independently viewing the contents and selecting a chosen strategy.
Where the research is distributed in Singapore to a person who is not an Accredited Investor, Expert Investor or an Institutional Investor, Oanda Asia Pacific Pte Ltd (“OAP“) accepts legal responsibility for the contents of the report to such persons only to the extent required by law. Singapore customers should contact OAP at 6579 8289 for matters arising from, or in connection with, the information/research distributed.

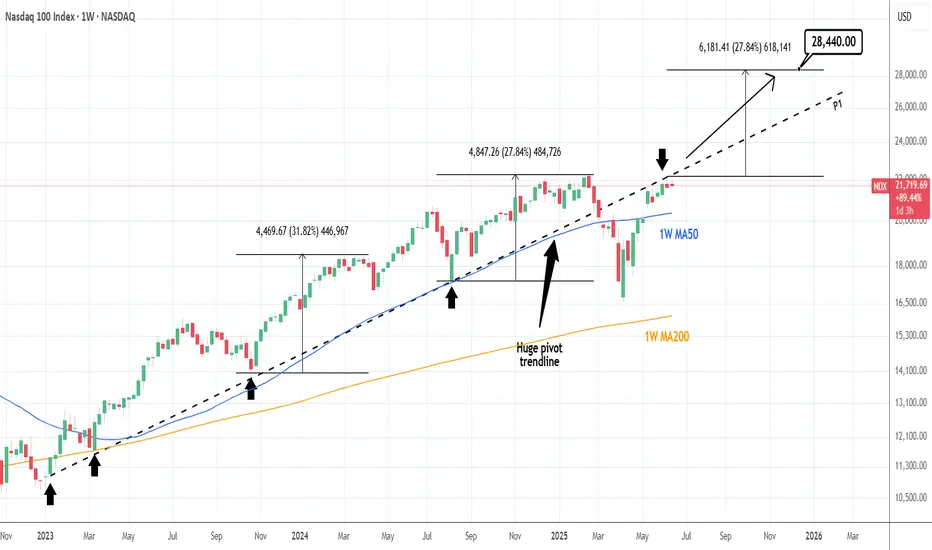
NASDAQ: Huge pivot can catapult it if broken.Nasdaq has turned neutral again on its 1D technical outlook (RSI = 54.712, MACD = 377..560, ADX = 20.644) as it has been struggling to cross above a hidden trendline, the Pivot P1 that was at the start of this Bull Cycle a support and after the trade war acts now as a resistance. If broken, we anticipate a +27.84% rise at least (TP = 28,440), which may very well be an end of year target.
## If you like our free content follow our profile to get more daily ideas. ##
## Comments and likes are greatly appreciated. ##
Dow Jones Potential UpsidesHey Traders, in today's trading session we are monitoring US30 for a buying opportunity around 41,900 zone, US30 is trading in an uptrend and currently is in a correction phase in which it is approaching the trend at 41,900 support and resistance area.
Trade safe, Joe.

Nas100 target reached.I uploaded a trade idea of this yesterday and these are the results, I used proper risk management and proper execution approach!

Nasdaq 100 Trade idea for the day and bias.This is what I'm expecting Nas100 to do today looking at the higher timeframe structure.

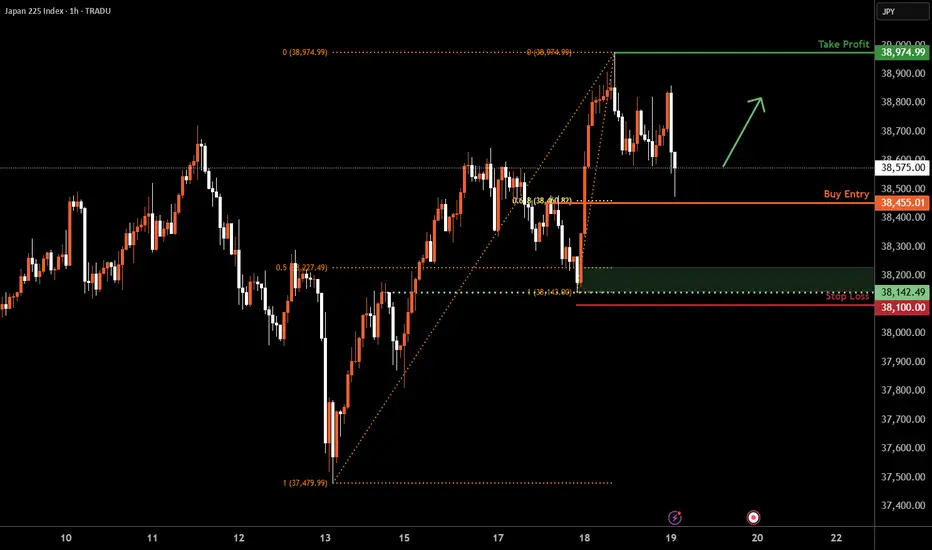
Nikkei 225 H1 | Pullback support at 61.8% Fibonacci retracementThe Nikkei 225 (JPN225) is falling towards a pullback support and could potentially bounce off this level to climb higher.
Buy entry is at 38,455.01 which is a pullback support that aligns with the 61.8% Fibonacci retracement.
Stop loss is at 38,100.00 which is a level that lies underneath an overlap support and the 50% Fibonacci retracement.
Take profit is at 38,974.99 which is a swing-high resistance.
High Risk Investment Warning
Trading Forex/CFDs on margin carries a high level of risk and may not be suitable for all investors. Leverage can work against you.
Stratos Markets Limited (tradu.com ):
CFDs are complex instruments and come with a high risk of losing money rapidly due to leverage. 63% of retail investor accounts lose money when trading CFDs with this provider. You should consider whether you understand how CFDs work and whether you can afford to take the high risk of losing your money.
Stratos Europe Ltd (tradu.com ):
CFDs are complex instruments and come with a high risk of losing money rapidly due to leverage. 63% of retail investor accounts lose money when trading CFDs with this provider. You should consider whether you understand how CFDs work and whether you can afford to take the high risk of losing your money.
Stratos Global LLC (tradu.com ):
Losses can exceed deposits.
Please be advised that the information presented on TradingView is provided to Tradu (‘Company’, ‘we’) by a third-party provider (‘TFA Global Pte Ltd’). Please be reminded that you are solely responsible for the trading decisions on your account. There is a very high degree of risk involved in trading. Any information and/or content is intended entirely for research, educational and informational purposes only and does not constitute investment or consultation advice or investment strategy. The information is not tailored to the investment needs of any specific person and therefore does not involve a consideration of any of the investment objectives, financial situation or needs of any viewer that may receive it. Kindly also note that past performance is not a reliable indicator of future results. Actual results may differ materially from those anticipated in forward-looking or past performance statements. We assume no liability as to the accuracy or completeness of any of the information and/or content provided herein and the Company cannot be held responsible for any omission, mistake nor for any loss or damage including without limitation to any loss of profit which may arise from reliance on any information supplied by TFA Global Pte Ltd.
The speaker(s) is neither an employee, agent nor representative of Tradu and is therefore acting independently. The opinions given are their own, constitute general market commentary, and do not constitute the opinion or advice of Tradu or any form of personal or investment advice. Tradu neither endorses nor guarantees offerings of third-party speakers, nor is Tradu responsible for the content, veracity or opinions of third-party speakers, presenters or participants.
S&P500: 1D Golden Cross incoming. 6,300 sighted.S&P500 is on an excellent bullish technical outlook on 1D (RSI = 60.006, MACD = 86.860, ADX = 23.325), extending a May 23rd rebound on its 1D MA200. Soon the market will form a 1D Golden Cross, drawing valid comparisons with the 2020 COVID recovery. That pattern, following its 1D MA200 rebound, extended the uptrend all the way to the 1.136 Fibonacci extension before pulling back to the 1D MA50 again. Buy, TP = 6,300.
## If you like our free content follow our profile to get more daily ideas. ##
## Comments and likes are greatly appreciated. ##

NAS100 (US100) Mid Week Reversal - Bullish Order FlowA Half Batman presents itself during the Asian session and seems to be ready for LDN opening. This Peak Formation could be seen as the reset, to turn NAS100 bullish and ready to break the structure high.
