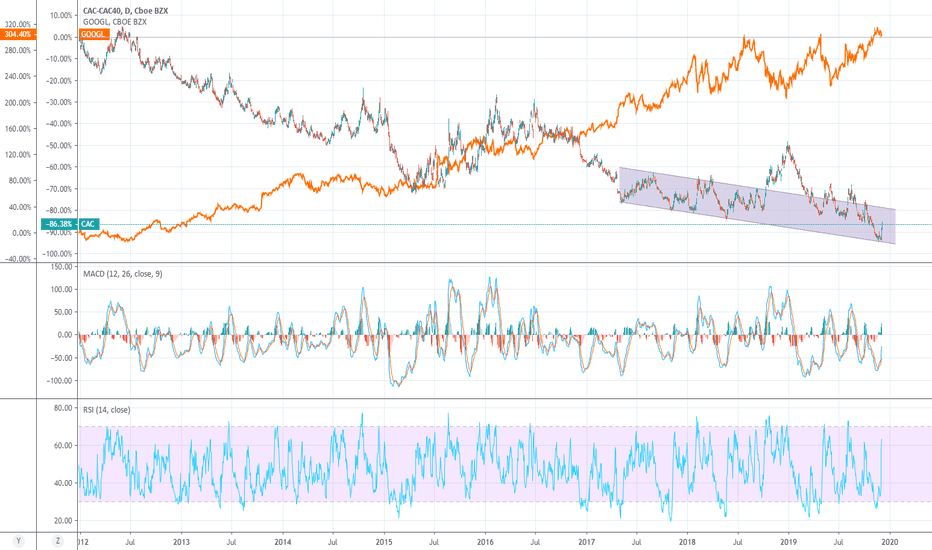
CAC40 - Indices Trading | Elliott Wave Structures | Q2 2019*Please support this idea with a LIKE if it helps you. Thanks!
More details about me in my signature.
CAC40 - Elliott Wave Outlook
Bearish Swings - Patterns:
Triple Three structure in Cycle Wave IV (green)
W (purple) - Zig-Zag
X (purple) - Three (false break-out)
Y (purple) - Simple Flat
X (purple) - Contracting Triangle
Z (purple) - Zig-Zag
Bullish Swings - Patterns:
Impulse in Intermediate (1) (blue)
Extension in Minor 3 (green)
Next expected swing:
Bearish sequence in Intermediate (2) (blue)
Structure change:
Bullish continuation in an impulsive manner could lead towards more up-side for an Ending Diagonal.
Indices Europe
CAC 40: Very strong long term upside potential. 6700 on sight.CAC is quite strangely printing on the big 1W/1M time frames a similar trading pattern with the early - mid 90s. The MA50/200 sequence is identical within a Channel Up with two distinct peaks that broke the Channel momentarily before testing again the supporting trend line.
What stands out in particular is the +46.50% rebound from the first Higher Low on both cycles. What follows after is a giant Inverse Head and Shoulders pattern, which gave rise to the second peak outside the Channel Up.
CAC40 is currently on that Inverse Head and Shoulder pattern attempting to price the Right Shoulder.
With such striking similarities it is only natural to assume that the current cycle will follow to a large extent the 90's cycle. Which means that after the Inverse Head and Shoulders is completed a +49.50% rise may follow (second peak outside the Channel) bringing the index close to 6,700. This is our long term target for CAC and the candle action times this by March 2020. After that the final Higher Low takes place which should pave the way for the new hyper aggressive cyclical bull market similar to the late 90s - 2000.
** If you like our free content follow our profile (www.tradingview.com) to get more daily ideas. **
Comments and likes are greatly appreciated.
CAC40 - Market Crash Cycles | Indices | Macro Trends*Please support this idea with a LIKE if it helps you. Thanks!
More details about me in my signature.
CAC40 has been labeled within a Sub-Millennium degree wave 4 (blue), which has been unfolding ever since the Dot-Com bubble.
Structure - Flat Formation
2000 peaks and down until 2003 bottoms - Grand Super-Cycle wave A (black)
2003 bottoms up until 2007 tops - Super-Cycle wave (a) (purple)
2007 tops and down until 2009 lows - Super-Cycle wave (b) (purple)
2009 lows and up until present times - Super-Cycle wave (C) (purple)
Super-Cycle (C) (purple)
Pattern - Ending Diagonal
Sequence - 5 Wave Sequence, with Cycle Waves I II III IV V (green) decomposed as Primary ABC (turquoise)
Current Position
Cycle Wave V (green)
Next expected swing
Bearish sequence in Primary B (turquoise)
Market Crash Forecast
Support granted at or around the 5300.00 mark and then a bull run towards the 6300.00 levels, where the Grand Super-Cycle Wave B (black) is expected to complete.Grand Super-Cycle Wave C (black) would reflect the next Larger Degree Recession.Structure change.
Breach of the lower trend-line of the Ending Diagonal could reflect the fact that the Market Crash already started.
CAC40 Rejoins Channel, Technicals Flash OverboughtWhile the CAC40 gave traders an almost perfect technical upward channel for January February and most of March, that channel was broken last week only to be somewhat regained over the past few sessions. It still does not know however if that channel support line is now resistance or still support. Moving averages all signal upward momentum while bull bear sentiment and RSI flash that this index is overbought. I'm not confident in equities right now. They all seem overbought and tend to be universally stagnant. Let's see how much further we can go though.
Former Support Channel as Resistance?This is such an interesting technical channel that we saw stemming back from December 2018. While, it failed to continue and broke through, it seems like now price action wants to use that former lower section of the channel that was support as resistance. However, this one is not as perfect as the channel that had formed as price action is creeping back into the channel. Either way, this one is still a fun one to watch considering how technically perfect it was acting for quite a while.
Channel broken a bit early, but could indicate bear marketMy call on CAC40 is changed from long to neutral now that global markets are increasing their fear on a global slowdown. This is evident in markets around the world as Asian markets plunged today as did European. US is set to be down as well. Overall, the channel break is incredibly disheartening for those expecting higher gains as it was a huge move down (3 percent). If you were not in this trade closer to the bottom, you may have missed your chance. If you didn't sell before this dip then you may have made some money. For those shorter-term traders, you may have already missed the train. We could get back in this channel tomorrow, but that seems unlikely. I'm actually more neutral to short than neutral, but Trading View only gives us three options so I prefer not a drastic shift from long to short. Let's see what happens over the next few days.
FRA40 shortHi traders,
this is my view on FRA40 the french economy indice.
Here we can see a perfect educational market struktur to show how important it is to know the work
of fibonacci retracement.
Beweent 0.786 & 0.618
Fibonacci retracement is the golden zone to enter for
trendfollowing trades. And what does the price? The price on this indice change the direction at the golden zone.
So you see trading is now rocket scienes, what you need is patients to wait for the right setups and the patient to let the trades run.
Have a good trading week.
Best wishes Stefan Forex
What is the next target of #CAC 40 ?The trend of the CAC 40 in recent years is an uptrend.
in October 2011 the Cac has undergone a technical correction of 1200 points and then very quickly he returned to his upward trend, in October 2015 after a long rise the Cac has made technical correction of 1000 points pretty much like the first time and quickly took it back bullish trend, in October 2017 the Cac has made a technical correction of 800 points and at the moment it is in progress and normally should be redone as the last two completed times a rise is exceeded the last record price.
The Cac will seek a goal to reach and the point of the Double Top (6100) in 14% of the current price is probably possible
Buy Cac 40:
Entry Price: 5290
Take Profit: 6100
Stop Loss:5000
SHORT SHORT CAC40 approaching resistance, potential drop!CAC40 is approaching our first resistance at 5184.1 (horizontal swing high resistance, 61.8% Fibonacci retracement , 100% Fibonacci extension ) where a strong drop might occur below this level pushing price down to our major support at 4950(38.2% Fibonacci retracement , Horizontal overlap support, 61.8% Fibonacci extension )
Stochastic (89,5,3) is also approaching resistance where we might see a corresponding drop in price.
Trading CFDs on margin carries high risk. Losses can exceed the initial investment so please ensure you fully understand the risks.