Elliott Wave Targets (sample 1)This would explain most major moves. Perform similar analysis for your lower targets.
Pay attention to those price patterns (353 points).
Indices Europe

It's worse than what I expected. Short on a pullback at 4896I need more confirmation before I know for sure we are entering into my 3rd proprietary cycle. This could lead to a huge downturn to 4200-4250 very quickly.


Closing the gap on Cac40Cac40 has been opening with quite a gap today just like most other indices.
Price has made a lower low on the m5 and I will be trading it down to close the gap.
If price moves down I will add aggressively so I max my profits.
Watch the other indices closely as they are not there yet and a reversal might still be possible.
Trade safely...
*** If you like my ideas, please don't forget to give me a "like" ***


CAC40 - Possible descending triangleNot confirmed yet. If it is, it would be an opportunity for some shorts/longs inside the triangle and at the end we should see a bearish continuation to find a support around 4600.
Any thoughts on this idea? Let me know!

First analysisHello everyone,
Today I will share with you my first analysis. Please be indulgent and any advices are welcomed :)
In my opinion, I think we may have found a bottom for Airbus ( EURONEXT:AIR ). The current trend is showing some weakness as volume is going down and RSI is showing divergences on the daily and the 4h chart. A daily close above 95 could be a bullish sign.
Let me know your thoughts on this idea and where I could be wrong!
Have a nice day.


CAC40 - Long-Term triangle breakout retest ?Do we reteste the breakout of the triangle related to CAC40 ?
A rejection of the 4900 upside would be ultra bullish
If we close monthly above -> would be very interesting

Kick The CACThe French stock market is painting an inverted triangle formation. Though not yet confirmed, this can portend lower prices ahead. We are currently rounding over. A weekly close above the prior weeks' high would negate bearishness for now, whilst a weekly closing below the last swing low would confirm the pattern and target the purple area.
While pundits claim the US stock market rally, it is far more prudent to short markets that are seeing material capital outflows, especially in failed states such as France.

Double top on CAC40A beautiful double top appeared on CAC40 index, the neckline has been broken this week. Down potential between -2.5% and -10%


Viva Le France!Was able to find historical data for the French CAC 40 stock market going back to 1990. The price action going into 2000 is clearly impulsive and the French market has been tracing out a triangle pattern since. The European Central Bank will probably perpetrate another money printing explosion, after the coming market sell-off, to fuel another run up to all time highs in the mid-20’s. As I’ve seen time after time in these Socialist countries, the success of the people and businesses is belabored under the weight of Big Government, Heavy Taxes paying for social programs, and excess fiat money printing…


Morning star on Valeo $FPA beautiful morning star pattern can be observed on Valeo on the descending support. This pattern is generally very powerfull. A gain of 15% is probable with this pattern a break of the resistance canal is also possible with higher gains...

CAC Sell IdeaCAC Sell Idea @ Weekly Supply Zone (5480.00 - 5544.82)
Sell Limit: 5475.81
Stop Loss: 5560.09
Take Profit: 5187.62
Risk Management = 0.01/$100
Recommended Leverage not to exceed 1:50
Recommended Risk Ratio 1:1.5 – 1:3
Close partially the contract once it reaches 50% of profit, Move stop loss over the entry level
Close partially the contract once it reaches 80% of the profit


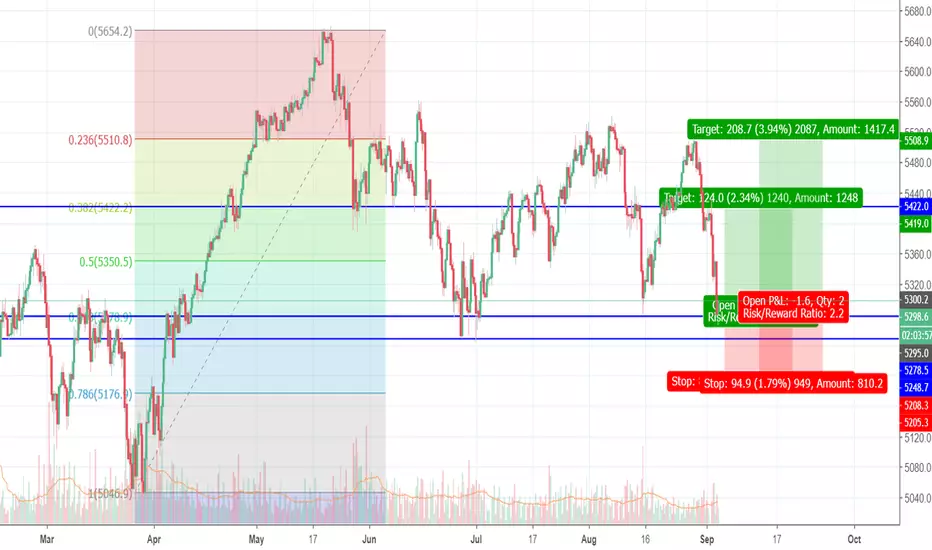
FRANCE 40 LONG 2.2RR 200PIPS TARGETNOW TRADING AROUND SUPPORT REGION 5250 - 5300
TWO TARGETS SET 5420 AND 5500
Can CAC40 Breakout?The French shares have been moving higher so we believe this may be a breakout overpowering the sellers at around the 5505 area and continue to an upward trend and benefit our trade.
However it does appear that price is moving in to a triangle trend line so price may get squeezed by the pressure of the Bulls and the Bears before the CAC 40 Breakout is achieved.

matrice scalp cac intradayon ira de zone en zone la zone des 5350 serra à sell en cas d'avelment baissier 2 minutes sur le cac cet après midi pour aller chercher les 5308
