French CAC40 (Reinv. Dividends, USD) tops its channelThis the CAC40 index, reinvested dividends and in USD currency (not euro).
if it doesnt breakout and reverse, it could retrace 50% fibo (the green line)
Indices Europe

Potential Reversal upon Closing Above EMA(5)I can see a potential Long setup for EUSTX50 index. Couple of things that I observed:
1. Price is currently retesting EMA(200) and this is also a resistance-turned-support zone (back in April 2017).
2. A divergence observed between the chart and RSI(14), as chart is making lower low, whereas RSI(14) is making higher low.
If price can close around 3530 (which I roughly calculate should be when it close above EMA(50)), then I may open a Long position. Otherwise, no trade on this index.

A positive end to the year for the CAC40??After yesterdays negative day for the #CAC40, a bullish triangle pattern, also coinciding with Fibonacci support & resistance zones building out??

CAC40 Bull PowerTrading method: RS ADVANTAGE Stage 5 system setup 95% accurate system manually forward tested over 3 years. In this situation we are now waiting for Awesome Osci to go into positive territory for trade entry confirmation to resume this bullish bias. Market execution for entry, confirmation will be required for entry.
Risk Description: low risk trend continuation setup to continue this bullish movement.
Profit expectations: 18 day trade length expected before hitting profit target I will post exit strategy when signal receives a exit signal.

RSI bearish divergence+ overbought Short at 5382have a nice Bearish divergence in H1
overbought much in h4,daily,weekly
Many Gap have not been filled too
the us stock is much overbought so i think they will correct also and so will make the ger30 and fra40 follow them move.
and the eurusd will cetainly make a small puback who ill weigh on the ger30 who i repeat is linked with fra40 not at 100% this last week but usually around 95% positive correlation
i enter at 5382 we can see he block since 3-4 candle h1 to pass it so it should return back first/
i open 2 position same as all time
1 will be cut at target 1 and second in trailing stop
for the Stop loSS i let you manage it lie is not a big trade cannot do a good ration if put SL so me i will put it around 5435 and the RR will be 1/2

This chart tells me Europe is about to collapseThis is a ratio between S&P500 total return and French CAC40 total return. It surprised me, but each time it touched a bottom of the channel, a geopolitic event occurred somewhere and both Euro indexes and EUR/USD collapsed.
2010 : First Greek debt crisis
2011 : Second Greek debt crisis
2014 : End of QE3 and bad economics in Germany
2015 : China bubble bursts
I dont know what could freak investors right now. May be bad economics in Germany, or Catalonia referendum, or simply US economy outperforming Europe, which would bring back investors.

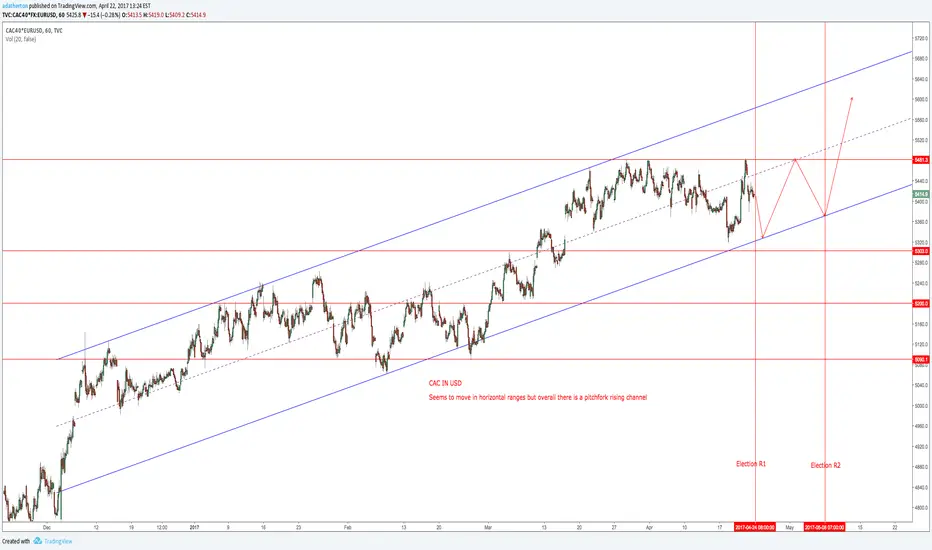
CAC40 in USD : 100% fibo prolongation touched for the 4th timeThis is the the CAC40 index in USD currency (CAC*EURUSD), as viewed by international investors.
As you can see, since the dip in 2009, this pattern happened 3 times. Each time it broke out the resistance (red), the rally did continue to 100% fibo prolongation. The error was less than 50 points. After that the index felt immediately at least 13%.
Now it could be the fourth time ...

CAC-40 jumps to 12-week high, bias higherEuropean bank stocks cheered the prospect of higher Fed interest rates which should help their profits thereby pulling general indices higher.
Frances CAC-40 index jumped to a 12-week high of 5294, bias higher.
Better-than-expected economic data which included flash Euro-zone PMI prints for September also lent support.
Technical studies support further gains. We see bullish divergence.
The index has shown channel breakout and has breached 100-DMA resistance.
Price action now hovering around 61.8% Fibos at 5293, next bull target 5323 ahead of 5339 and then 5374.
Go long on break above 5293, SL: 5259, TP: 5323/ 5339/ 5374


CAC40 and other European markets: Excellent short opportunity!Top of the channel reached, bad fundamental data everywhere, US markets overshooting because of Trump, Bearish Gartley Pattern + Head and Shoulders pattern on the DAX (see my previous post), and so on.
It's bearish, with a very high probability.

2 area to look for potential short Imo those area on the cac will be nice short in possibility of a continuation move toward the lows . 4930 is my target for the next 3 month with invalidation level around 5140 . Trade at you own risk , free trading school coming for september or october


Please Mind the CACOn the 24th April the CAC 40 made a huge gap up, from 5050 to 5260. An incredible 4%. In fact it is the largest gap we can see historically as far back as 2008.
Gaps, as trades know, 'always' get filled. Statistically its more like 90% of the time.
Whether bullish or bearish on the European reflation story, this trade is the same.. French stocks are likely to pull back to close this gap, before either continuing on their rally, or otherwise.
Trade execution:
A conservative way to play this would be see the actual gap as being highest high previously, which is actually 5140 (blue line). A more aggressive short target would be the 5050 from where it jumped.


Just an idea -- actually a small gamble -- Le Pen wins.I am going to bet that Le Pen wins the election. I believe that the Macron victory is already in the price, after first round of elections. Now he is approx. 20% lead vs Le Pen. So if Le Pen wins there would be a much bigger surprise. I will open a small position.
The risk ratio is between 2-3, so this is comparable to every trade I make.

CAC 40 Index: Get long now while stocks lastCac 40 Index: Broken out and heading for 5790-5860 range, with 400 to 500 points upside still left in it in near term. Get long before the weekend and ride the rally, or sell into strength come Monday

DAX "GER30" SHORTLongterm Short after opening gap for DAX "Ger30" same scenario with CAC "CAC40"
Remember to follow French Presidential Elections
Events at North Korea
etc..
Take Profit at Previous Swing LOWs appx 9400s
SL- With relatively safe trades .... who needs SL when at worst scenario you can hedge :p

CAC40 - Has the rally just begun?The resistance offered by the falling trend line drawn from Sept 2000 high and June 2007 high was breached last month.
This month's candle shows a sharp rebound from the sub-trend line support level followed by a rise to 5295.5 (highest level since Jan 2008 high).
The chart also shows a nice rebound from the rising trend line in mid 2016.
Overall, the technical picture says the rally may have just begun... the monthly RSI is rising and is yet to overbought territory.

Testing weekly harmonic pattern - Is it heading to 6000? Even before yesterday's results, the French CAC40 provided a bullish long term signal when it broke above a monthly downtrend line.
The CAC40 is testing the X point of a bearish Bat pattern (similar to what we see in German DAX) and if it'll break and close above it, it can continue all the way up to 6000 to test a bigger PRZ.

CAC40 Post French ElectionsCAC 40 went to its highest high since almost 2 years. Could that be potentially the top???

This is what you need to know before the elections results EURUSD is trading inside a yearly trading range.
There's a daily uptrend line that EURUSD is currently still above.. and from above it has a daily downtrend line and the middle of the range - 1.1 (Resistance Zone).
In case of a bullish move, focus on 1.1.
A breakout above this price zone could send EURUSD towards 1.14-1.115 again to re-test the top of the range
In case of a bearish move, a breakdown of the 1.04 support zone can lead EURUSD towards parity and even lower.
As long as it stays inside the range, you can try and trade the range
