Just an observation regarding markets. A Return to fundamentals.Ideas:
-Buying high to sell higher may work, but chances for corrections in the next years are likely.
-Selling or shorting may be unadvisable. Despite the chance of corrections, shorting behavior is similar to bubble behavior. As always, there is a likely chance there are shorters who will have losses.
-Selling actual stock positions that have been bought lower, here, is generally a good idea. Not having exposure, or having small exposure, at this moment in time, is likely good.
Despite the chart idea to buy above 2700 and sell at 2900, with a stop loss at 2650, there is a chance of a correction as soon as it reaches 2730-2740 levels.
A move towards 2400 for DOWG is likely this year and possible in the next years.
The 'where and when' spots to short are generally harder to guess.
If it closes at year end below 2450, the next years are likely to be negative.
Any down move below 2350 can send DOWG to 2250 and 2200 respectively.
Corrections touching 2000 and below in the next 5-10 years can happen, though unlikely.
What the white background says:
---To quote:
Lows and restructuring in the year 2018 and the next couple of years.
Two potential years with negative corrections on the market.
A correction in 2017 is possible, more frequent corrections are likely to happen in the years ahead.
Corrections will continue to happen until there is a just system in place.
The alternative is delays and further bubbles.
Changes from within big companies are highly improbable, only companies with hedging and wisdom will stay.
Companies that built themselves on bubbles will very likely pop themselves, just as they bubbled themselves.
---End quote.
Between Currencies versus Commodities, there may be a temporary safe haven in Commodities.
Lack of liquidity, medium of exchange, bartering can be troublesome obstacles in commodity area, if some currencies fail, due to some government defaults(if they happen).
People that actively participate in 'governments' will be actively influenced by 'government dogma', that is, 'intentional ignorance of fundamental facts'. Ideologies not backed by good fundamentals ultimately fail(when even belief is strong), because lack of fundamentals to sustain 'believers' that have forgot fundamental logic on how one lives and thus, simply, experience forced awareness to fundamental facts. Fundamental facts are that living is done by practicing agriculture(sometimes systems that are immune to harsh environments, see aquaponics), and not using derivative means to live(getting a job in companies built on bubbles) and by practicing wisdom, through studying, (and not sins that pushes one away from fundamental facts), and then after that, practicing what one has learned, but under God's Law(Noahide Laws).
en.wikipedia.org
Indices Europe

DAX and other European indices (Points and Figures): Fake out?So "they" want everyone to turn bullish (whether artificially or not) or be stopped out. The weak buyers are being washed away, shorts must be covered or the shorters will burn their feet if that's not already the case. Retail investors are still very bearish overall, but what is observed in Europe and in the official financial news show that money is flocking to European equities, among other things (even real estate is "booming" again). Indices are compelled to go higher, but the exhaustion seems to be nearing. Summer could be very frustrating. Volume seems to be impressive, but for such small moves (green XXX) at the time I am writing this post, this appears to be not. Volume is accumulating, we see final explosive moves, this could signal the beginning of the end of a bull market. But it will still grind up. It's better to buy pullbacks with tight stop loss orders, or wait until it goes way up if people want to short. However, we don't know yet when this will truly end. I would expect spikes and fake out. Reversal days could be extremely tricky.

CAC 40 - Pivotal pointBy closing at 5069.04, the CAC reached its long term down trend and is now at a pivotal point.
Using weekly prices, the recent uptrend looks still solid with no sign of regression with any relevant indicators.
However, using daily prices, 2 keys indicators, momentum and RSI show a regression synonym of short term weakness which could prevent the index to go through and keep it in the current long term downtrend initiated in Sept 2000 and June 2007.
In case of breakout, the CAC the first resistance stands at 5283.
On the other hand, a return back to 4929 then 4733 will be on the cards. Anything below the latter would annihilate the current uptrend

What is happening with the stockmarkets right now?If we look at the indexchart of the AEX (dutch25) we are seeing high consolidation. This means that markets are on this moment unpredictable and are waiting for more information.
Why can't we predict the markets?
Because we saw at the past that markets dind't react as expected on politics and economic data. This means that the most people are afraid to place orders. Wich can turn on a consolidated market.
What to do?
Because i only go long i'm waiting for a drop or breakout in the market. If this happen, i will go long.

CAC 40 - end of down phaseAfter seeing a sustained down-trend, the indicator line has left the sell zone on February 1st, 2017.
We are now waiting for either a new sell signal or a turn-around, toward the upside.
Confirmation will be upon entry into either the sell zone or the buy zone.

Bearish harmonic pattern on French CAC40Same pattern appeared on november 2015, resulting a 1100 points drop

EUSTX50, Bearish signals at resistanceEUSTX50 at resistance Area 3276.98-3326.02, potential move to the downside from this zone (1st management point 3160).


CAC 40 consolidates following December breakFollowing the impulsion at the beginning of december, the index is now consolidating its recent uptrend.
Since beginning of December, after exiting a 4 month old canal, the impulsion led the index to multiple new highs.
However, if the price kept going higher, the current uptrend is weakened by a divergence since mid december and visible on three main indicators (RSI, Momentum and MACD). It is very much a short term worry though as this doesn't appear on the weekly data of the index.
- On a short term point of view, holders can keep their long position although others would wait for a more affordable price.
- Mid to long term investors would use the same pivot prices to enter the market or not. For those already long, there is no clear indication to close a long position now and even less to open a short one.
- The divergence would be totalled by a break above the recent high at 4929.6. That would be a significant buy signal.
- On the contrary, a break below the support at 4822.29 would generate a short term sell signal.


CACHello My friends!
French index CAC
Just Little fundamental analis:)
Oland dont meet with Putin.
France dont make money on Mistral deal and Poland asked Ollande "not hysteria" because of the failure to buy
helicopters from France.
Just disappointment.
But in technical analysis need go up until lvel 78.6 and after fall
I think market will start fall in December - January.

Perfect bearish Gartley on french CAC40If prices start to drop from 4780 level, a (perfect) bearish Gartley harmonic pattern can be validated.
A long term resistance would be validated too, and a medium term resistance (the fork).
First, prices could drop to the 4600 horizontal support, then rebound, and retest the resistance, before falling sharply to a long term support (2010-2016).
Ultimate target is 3500-3600


Trump rally is at later stageFríday, monday could go higher. Throw over should happen to 19200-300 zone, and then a dramatic fall back would be an idealic sign for short.
Dow must not exceeds 19500! for the bearish outlook!!!
Target is on the chart, but we could have much more courageous target also!

World Stock MarketA Trump victory meant a rally for the global dow of 76.5 points(+3.2%) 4 days before the elections for the next 21 days.
By end of the year, it might reach the yearly high, close to 2490. Maybe next year we'll see 2500 and above it.
Global Dow is an index with top 150 companies around the world.
More on wikipedia:
en.wikipedia.org
More upside for DOWG if it stays above 2500.
If by the end of 2015, the index goes below 2389, it's a start of a downtrend for the global stock market .
It is expected for the Dow to stay at current levels or go for more upside. The first months of the next year will decide the future of the stock market for a good period of time.
Trade idea is on the chart.
Chart of DOWG since 2015:

France is in big trouble!Big short potencial in France. Political trouble will deepening hand in hand. More potencial there is in weekly and monthly timeframe.

France CAC40 - Sep'16Equities across the board coming off today... with S&P dipping below 2100.
Anticipating a break below 4420, which would put it in buy territory.

CAC40 : The rounding tops show a bearish momentumThe CAC40 is consolidating between 4300 and 4520 pts since the middle of July. The US indices are currently showing weaknesses, and so does the french equity market.
The resistance area at 4550, doubled with the other one at 4520, definitely constitute a barrage for the buyers to go higher. The bearish forces are getting a bit stronger as weeks pass, as shown by the rounding tops. The long term moving average (200 days) remains decreasing, which highlights the downside underlying trend.
The first steam to break is the ascending trendline (blue). The current price at the CAC40 is high enough to initiate a short position :
- Short @ 4460
- Target @ 4315
- Stop @ 4520 (just above the first resistance)


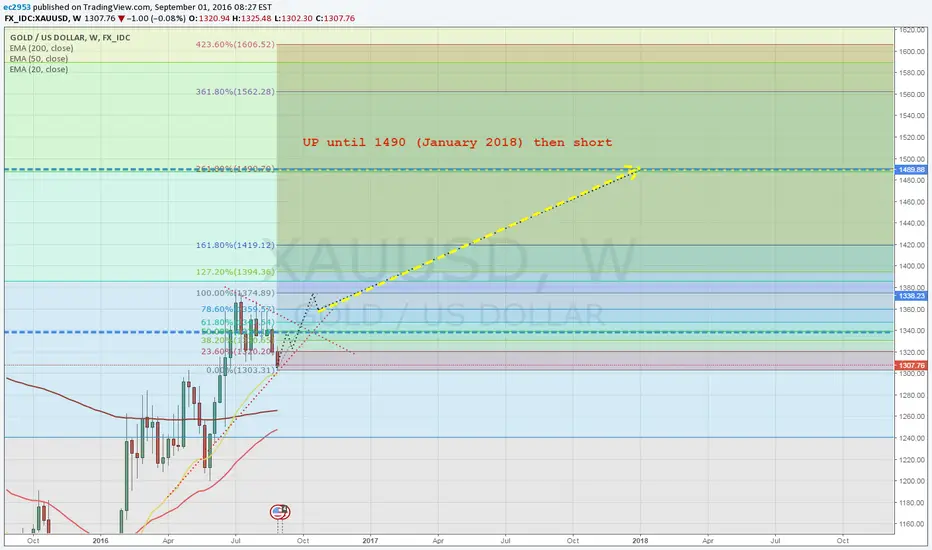
XAUUSD the low here? Long until about 1490 (January 2018)September 1, 2016
Hello guys, this is my opinion on XAUUSD or gold. 1300 could the low of this leg and then we will go slowly until 1490 next year :)
I perform this analysis thanks to what I see on the US, European and Japanese markets. They will plummet soon in my opinion (CAC 40: top at 4700, DAX: Max at around 11077, Dow Jones: 18850, NIKKEI: 1750)
DAX: Short at 11077-11100September 1, 2016
That's a possible scenario :) Bearish Gartley Pattern confirmed with the CAC 40 (France). It's consistent with the target of the Dow Jones at 18850 and of the Nikkei at 17500. The CAC 40 will plummet after it gets to 4700. See my other posts for more info about the CAC. This is why the DAX is weaker than the CAC 40 and that US markets are also overall more resilient to grind up compared to the French index. Their targets are lower than those of the latter one.

CAC 40 and the world: the End soon after the short at 4700August 31, 2016
Everything is on the chart. It is very precise and you may doubt that it's feasible I know. The lines are not random, they correspond to very specific levels (4700 -> 4450 -> 4500 -> 4280/4310 -> 4450 -> 4084 -> 4300 -> 4090 -> 4180 -> 4084 -> 3709 -> 3904 -> 3556 -> 3477 -> dead cat bounce -> 3050/3100
I would go long now until 4700. Some bad resistance will have to be taken away at 4600 and 4666.
It will drop from 4084 to 4709 in a single week. Probably in summer 2017 (August here). The ultimate target is around 3050-3100. Then I would go bullish until 4450 (May June 2019) then reshort a bit. We shall see !

CAC 40: We have all the long term targets below the short @4700August 28, 2016 (Post Yellen's speech)
Everything is on the chart. You know that I am willing to short strongly at 4700. Resistance shall be met at 4600 and 4666. Those would become other very good scalping opportunities for the experienced ones. Don't forget the Bearish Gartley Pattern and the long term Head and Shoulders pattern (not traced on the picture, cf previous posts).
It should fall quickly to a strong area at 4450. It could bounce to 4500, another psychological level. But then they would shorting until 4383, resistance will be futile although it's an important level. The CAC 40 shall quickly further its downtrend until 4280-4310. It another crucial level to hold, but it will ultimately become a dead cat bounce. It should become erratic between 4000 and 4300. But hey, after it goes through 4000-4004, there would be a huge drop of 300 points in a single week. It would go up again because of short covering, and then fall to 3556 and 3477. Speculators and some funds would find it an interesting opportunity to buy, since they would believe it's low enough. But some final strings of predictable "bad news" would sign the final blow to the markets. It would collapse sharply until 3050-3104. People would freak out and more stop-loss orders could be triggered. It would go even a bit lower (it's the "visible" crisis, what do you want?)
