Dow Jones Industrial Average Index feedChances of Downtrend:
Price drop from resistance forming Inverse Cup and handle
Rising wedge reacting to lower resistance with MACD conforming, momentary downtrend, which has a high chance of breaking through weak support.
Chances of Uptrend:
Possible chance of a bullish rectangular pattern forming
Possible change in stocks
Possible news release
RSI may react with a potential buy signal
Conclusion:
Have a Sell stop order ready for below support, close at a suitable position.
Indicies


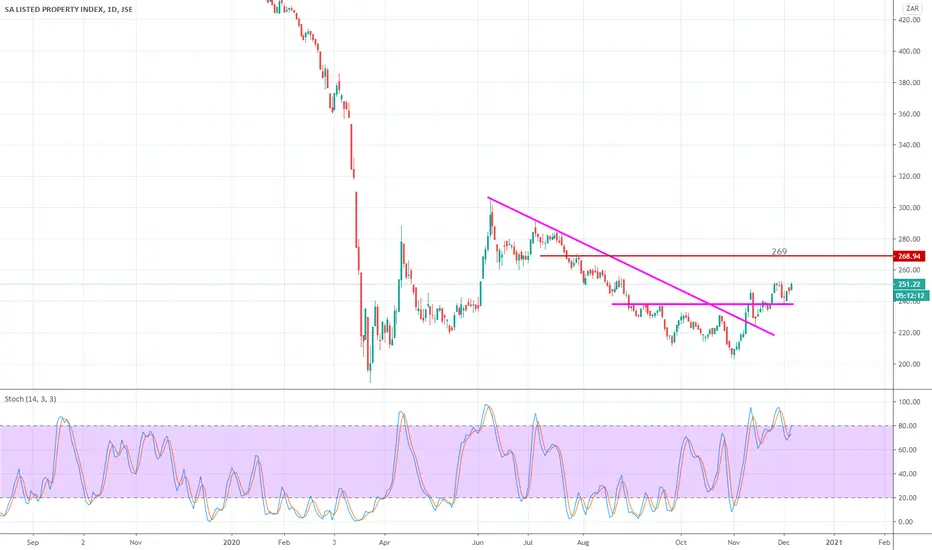
$J253 JSE Listed Property Index. Looking to move higherDowntrend break, retest and looking set to test 268-269 in the near future. I have a position in STXPRO.

#ALSI Bull flag breakout retestALSI saw a decent sell off today. This has resulted in a retest of the recent flag breakout. This support level needs to hold, or it could result in sell off momentum building it breaks back into the flag. A bounce is expected off this level.

J200 Top 40 Index . Bull flag breakLooking very bullish flag break today with 53800 and 55200 (All time high) targets.

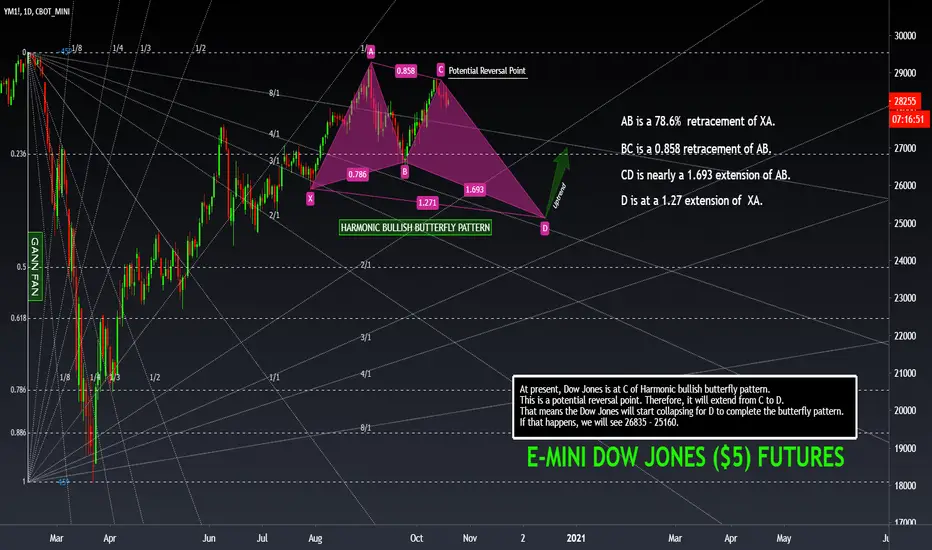
NASDAQ100/NDX OFFICIAL BUY POSITION-Completed AB/CD/E Pattern (CONFIRMS REVERSAL)
-A--->B Completed
-Current standing is on the (C) position. (CONTINUATION)
-(C) Position is beautifully placed on the 50 PERCENTILE FIB (50% FIB)

BITCOIN CURRENT TRADE RUNNING + 7.31% GAIN! ARE IN YOU IN?BTCUSD RUNNING +7.31% from the 4HR time frame (Based on 1% risk)
OUR STRATEGY EXPLAINED:
The entry price, SL and multiple TPs are shown on the chart.
Our back testing and money management strategy itself is holding until a reverse signal to ride a big trend, but as you will not see the next signal - manage the trade as you wish should you decide to enter.
What is our strategy?
Our strategy is a trend following strategy, can be used on any instrument and time frame. However, we have hard coded specific parameters for when trading the H1 time frame, so we can back up over 4200 previous trades to confirm our edge from previous data. This gives us confidence in execution and belief in our trading strategy for the long term.
The strategy simply sits in your trading view, so you will see exactly what we see - the trade, entry price, SL and multiple TPs (although we hold until opposite trade as this is the most profitable longer term plan), lot size, etc.
This could be on your phone trading view app, or laptop of course.
The hard work is done, so we have zero chart work time, no analysis, no time front of the chart doing technical analysis - technical analysis is very subjective - you may see different things at different times - how do you have a rigid trading plan on a H&S shoulder pattern? Your daily routine, diet, sleep, exercise can affect what you 'see' and your decision making, this doesn't happen when a strategy is coded like this; what we do have is a mechanical trading strategy...
What does this mean?
It means, we are very clear on our entry and our exit and use strict risk management (this is built in - put in your account size, set your risk in % or fixed amount and it will tell you what lot size to trade!) so we have no ego with our position and we are comfortable with all outcomes - its simply just another trade. This free's our mindset from worry and anxiety as we take confidence from knowing our edge is there and also that we have used sensible risk management.
The strategy itself can be used as a live trading journal too - how cool is that? The strategy will confirm and support every open and closed position - so its quite easy to follow.
We just have to do what Percy does.
Please see our related ideas below for more information to explain what we do and how it can help you.

$UKX FTSE 100 Index. Massive channel breakHuge channel break by the FTSE today. 7000 looks like a possible target for this break.

#ALSI Big consolidation breakRubbing the crystal ball here a bit, but big breaks like the ones we've seen on the ALSI usually gets tested at some point in time to confirm the bullish sentiment. Last week was a 10% week for ALSI + an additional 1% today. Expecting some consolidation in the near future. Market is very bullish at the moment.

J200 Top 40 Index .Headed for the top of the channel ? Are we headed for the top of the channel once again ? Be prepared for some volatility during the US presidential election period.

S&P 500 SELL STILL VALID FOR ENTRY (BUY HIT 3 X TP'S / +5% GAIN)SPX500 SELL VALID !!
BUY HIT ALL 3 TARGETS OR CLOSED FOR A 5% ACCOUNT GAIN BASED ON A 1% RISK !
Trade made a great move, hit a couple of loser on the way before the sell took off. Let's see what happens !
OUR STRATEGY EXPLAINED:
The entry price, SL and multiple TPs are shown on the chart.
Our back testing and money management strategy itself is holding until a reverse signal to ride a big trend, but as you will not see the next signal - manage the trade as you wish should you decide to enter.
What is our strategy?
Our strategy is a trend following strategy, can be used on any instrument and time frame. However, we have hard coded specific parameters for when trading the H1 time frame, so we can back up over 4200 previous trades to confirm our edge from previous data. This gives us confidence in execution and belief in our trading strategy for the long term.
The strategy simply sits in your trading view, so you will see exactly what we see - the trade, entry price, SL and multiple TPs (although we hold until opposite trade as this is the most profitable longer term plan), lot size, etc.
This could be on your phone trading view app, or laptop of course.
The hard work is done, so we have zero chart work time, no analysis, no time front of the chart doing technical analysis - technical analysis is very subjective - you may see different things at different times - how do you have a rigid trading plan on a H&S shoulder pattern? Your daily routine, diet, sleep, exercise can affect what you 'see' and your decision making, this doesn't happen when a strategy is coded like this; what we do have is a mechanical trading strategy...
What does this mean?
It means, we are very clear on our entry and our exit and use strict risk management (this is built in - put in your account size, set your risk in % or fixed amount and it will tell you what lot size to trade!) so we have no ego with our position and we are comfortable with all outcomes - its simply just another trade. This free's our mindset from worry and anxiety as we take confidence from knowing our edge is there and also that we have used sensible risk management.
The strategy itself can be used as a live trading journal too - how cool is that? The strategy will confirm and support every open and closed position - so its quite easy to follow.
We just have to do what Percy does.
Please see our related ideas below for more information to explain what we do and how it can help you.

$UKX FTSE 100 Index. Channel ping -pongTop of channel coming up once again. Watch out for some overhead resistance.

#ALSI JSE ALL Share Index - Bottom of channel supportThe question now is if support will hold. If it does, we should see a little bounce from here.

S&P500 ready to go down down?After the corona recovery we topped back out above previous highs with a small shack off on new price discovery.
As ridiculous of a move as it was it had back bone and was a pretty consistent or strong growth trend, but that shake out broke trend and the second recovery has failed to make a higher high.
So now im purely looking at market structure change and looking at this current short term trend to create a lower low on the daily giving me confidence that the market may finally be starting to shift.
Are we getting ready for a big hit?


The CBOE Market Volatility index (VIX) The CBOE Market Volatility index (VIX) rose for the eighth time in nine sessions, and was last up 2.8%.
SPY500 SENTIMENT IS PUSHING SPY HIGHER.
TREND FOLLOWING IS KEY..
WINNING ATTITUDE...

$UKX FTSE 100 Index. Channel ping -pongClear down channel. Bottom of channel seems like the likely next target.

DOW JONES with Gann Fan, Bullish Butterfly, & Fib RetracementHere I have used Gann Fan, Fibonacci Retracement, and Harmonic Pattern to forecast Dow Jones.
If you like my charts, give likes, share, and subscribe to show love.

S&P 500 SHORT RISK FREE AND RUNNING + 2% ACCOUNT GAINSPX500 trade made a great move, hit a couple of loser on the way before the sell took off. Let's see what happens !
BASED ON 1% RISK YOUR ACCOUNT WOULD BE RUNNING +2%
OUR STRATEGY EXPLAINED:
The entry price, SL and multiple TPs are shown on the chart.
Our back testing and money management strategy itself is holding until a reverse signal to ride a big trend, but as you will not see the next signal - manage the trade as you wish should you decide to enter.
What is our strategy?
Our strategy is a trend following strategy, can be used on any instrument and time frame. However, we have hard coded specific parameters for when trading the H1 time frame, so we can back up over 4200 previous trades to confirm our edge from previous data. This gives us confidence in execution and belief in our trading strategy for the long term.
The strategy simply sits in your trading view, so you will see exactly what we see - the trade, entry price, SL and multiple TPs (although we hold until opposite trade as this is the most profitable longer term plan), lot size, etc.
This could be on your phone trading view app, or laptop of course.
The hard work is done, so we have zero chart work time, no analysis, no time front of the chart doing technical analysis - technical analysis is very subjective - you may see different things at different times - how do you have a rigid trading plan on a H&S shoulder pattern? Your daily routine, diet, sleep, exercise can affect what you 'see' and your decision making, this doesn't happen when a strategy is coded like this; what we do have is a mechanical trading strategy...
What does this mean?
It means, we are very clear on our entry and our exit and use strict risk management (this is built in - put in your account size, set your risk in % or fixed amount and it will tell you what lot size to trade!) so we have no ego with our position and we are comfortable with all outcomes - its simply just another trade. This free's our mindset from worry and anxiety as we take confidence from knowing our edge is there and also that we have used sensible risk management.
The strategy itself can be used as a live trading journal too - how cool is that? The strategy will confirm and support every open and closed position - so its quite easy to follow.
We just have to do what Percy does.
Please see our related ideas below for more information to explain what we do and how it can help you.

$J200 JSE TOP40 Index. Open air belowIf this down channel is anything to go by then there is some downside risk on the TOP40 Index in coming days, weeks. Trade with caution.
