S&P 500 ON TO WINNER ! +3% and still running !US500 trade made a great move! Let us know if you're in !
BASED ON 1% RISK YOUR ACCOUNT WOULD BE RUNNING +3%
OUR STRATEGY EXPLAINED:
The entry price, SL and multiple TPs are shown on the chart.
Our back testing and money management strategy itself is holding until a reverse signal to ride a big trend, but as you will not see the next signal - manage the trade as you wish should you decide to enter.
What is our strategy?
Our strategy is a trend following strategy, can be used on any instrument and time frame. However, we have hard coded specific parameters for when trading the H1 time frame, so we can back up over 4200 previous trades to confirm our edge from previous data. This gives us confidence in execution and belief in our trading strategy for the long term.
The strategy simply sits in your trading view, so you will see exactly what we see - the trade, entry price, SL and multiple TPs (although we hold until opposite trade as this is the most profitable longer term plan), lot size, etc.
This could be on your phone trading view app, or laptop of course.
The hard work is done, so we have zero chart work time, no analysis, no time front of the chart doing technical analysis - technical analysis is very subjective - you may see different things at different times - how do you have a rigid trading plan on a H&S shoulder pattern? Your daily routine, diet, sleep, exercise can affect what you 'see' and your decision making, this doesn't happen when a strategy is coded like this; what we do have is a mechanical trading strategy...
What does this mean?
It means, we are very clear on our entry and our exit and use strict risk management (this is built in - put in your account size, set your risk in % or fixed amount and it will tell you what lot size to trade!) so we have no ego with our position and we are comfortable with all outcomes - its simply just another trade. This free's our mindset from worry and anxiety as we take confidence from knowing our edge is there and also that we have used sensible risk management.
The strategy itself can be used as a live trading journal too - how cool is that? The strategy will confirm and support every open and closed position - so its quite easy to follow.
We just have to do what Percy does.
Please see our related ideas below for more information to explain what we do and how it can help you.
Indicies

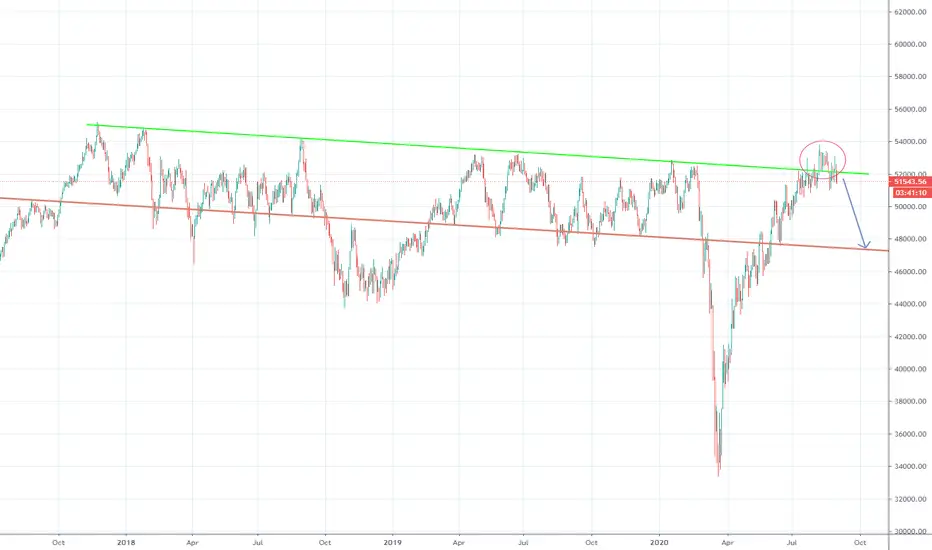
JSE Top40 Index. Channel within a channelIf the smaller channel break to the upside we could see a 1200pts move to a test of the upper resistance line of the larger channel. Expecting some upside.

$DIA Top of down channel testResistance at the top of the channel. If it holds, the chances of more downside within this channel is pretty good. No position. Watching.

Long CADCHF @ 0.6930; TP @ 0.70668, SL your choiceLong CADCHF @ 0.6930; TP @ 0.70668, SL your choice

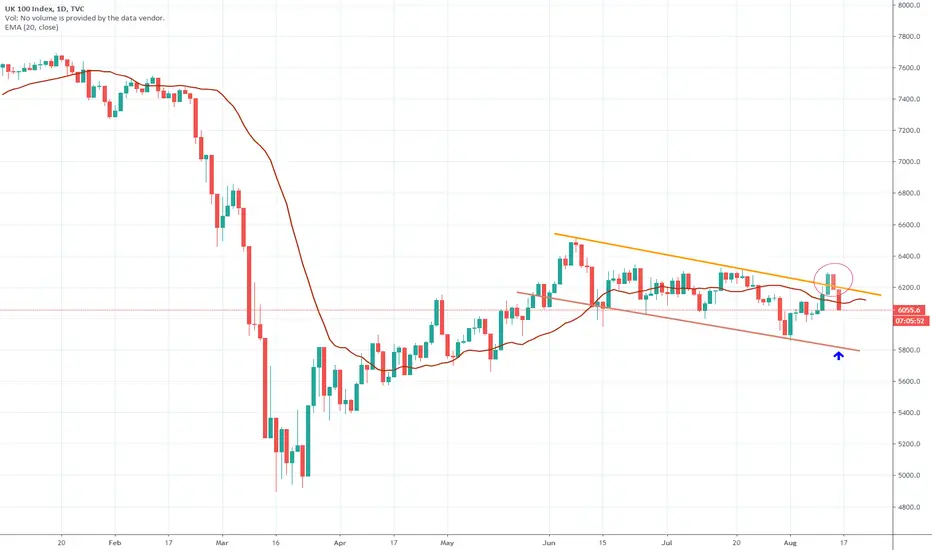
Simplified Daily Chart Analysis on DAX Week Ended 18 Sept 2020Hi all,
For those interested, i display the way i see the daily chart on the DAX. Approaching 21 EMA (green line). Note possible wedge formation (if correct) and possible RSI divergence.
Best of luck to all,
bazzman78tv
19 September 2020


$NQ! Nasdaq. Bear flag buildingNasdaq is building a bear flag. A break of this flag would target 10300 level. Wait for the break. Very volatile environment.

STRONG DOWNTREND FOR NAS100 TO SELLI started trading Indices for the first time last week. We are looking for a sell on NAS100 as a downtrend has occurred.
TP: 11100 OR BELOW

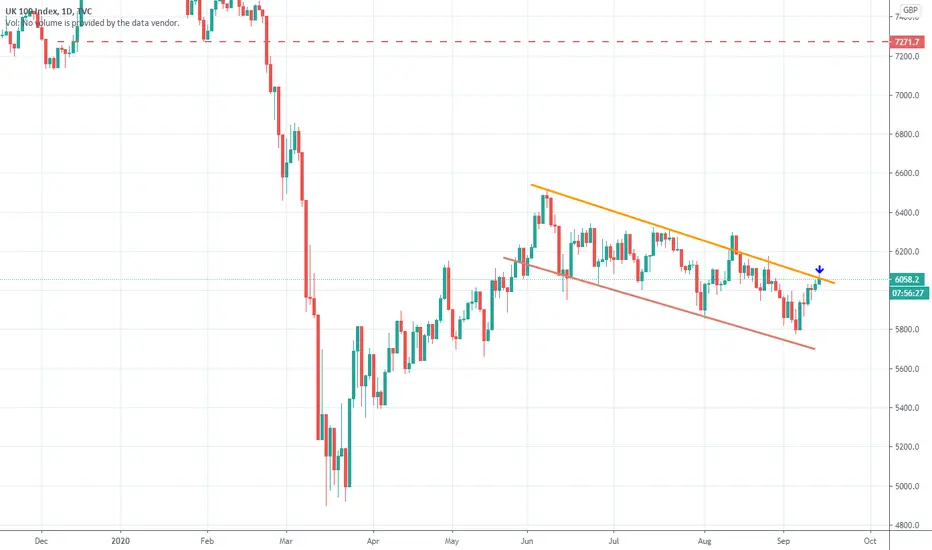
$UKX FTSE 100 Index. Up against resistanceWill resistance hold for another leg down to the bottom of this channel, or will it break this time around ?
Review of the Nasdaq Weekly Chart Week Ending 11 September 2020Hi all,
I post a summary of the NASDAQ weekly chart (to view as a future reference).
Best wishes to all,
bazzman78tv
13 September 2020

Simplified Daily Chart Analysis DAX Week Ended 11 September 2020Hi all,
I post a simplified daily chart analysis of the DAX that i see (based on my method of technical analysis breakdown).
Best of luck to all,
bazzman78tv
11 September 2020

DOW Daily Chart Analysis Week Ended 11 September 2020 Hi all,
Attached is a daily chart simplified analysis for the DOW Jones index.
Stay safe.
bazzman78tv
13 September 2020

OVERNIGHT CORRECTION CONT. NASDAQ100HELLO TRADERS,
OUR VIEW ON NASDAQ
BULLISH MOVE CONT. TO
THE UPSIDE
1:3 RISK TO REWARD.
CHEERS
OANDA:NAS100USD

SPX500 LONG SET UP TO NEW ATH WILL SPX500 OBEY TREND TO NEW HIGHS OR BREAK TREND DROP YOU COMMENT BELOW

S&P500 (SPX) New All Time High or Further Drop for AccumulationHello Fellow Trader!
S&P500 (SPX) New All Time High or Further Drop for Accumulation
SPX found support at its previous all time high price 3394 before bouncing and looking to test new highs.
There are two options in play to trade this structure and the higher risk to reward play would be testing the June 2020 high 3232.
Scenario 1:
IF price forms some type of flag or continuation pattern for further upside, the multi-month trend line will stay intact as support for price to advance.
Scenario 2:
IF the current structure looks like a consolidation pattern hugging above trend line, this could suggest there is a possible drop to test June highs. At this point you will find mass accumulation.
Key Points:
Scenario 1:
- Price above 50 EMA
- Price above 200 EMA
- Multi-month trend line as support
- 1 Hour time frame could present bullish flag patterns or candlestick reversals for upside
- SPX has been extremely strong, and any dip pull backs have been bought up immensely
- Trading the trend.
- Found support at 38.2% Fibonacci of last major range
Scenario 2:
- RSI slices through mid-point
- A consolidation pattern above trend line suggests the buyers are wearing thin.
- Accumulation zone will coincide with 200 EMA support & June high resistance / new support.
- Accumulation zone coincides with 50% Fibonacci retracement of last major range
- Presents an extremely desirable risk to reward ratio
Key Levels:
Support – 3394, 3280, 3232, 200 EMA
Resistance – 3480, 3588
Entry Zone:
Optimal entry provides the greatest reward to risk ratio while supporting entry is a zone for reversal signals.
Scenario 1:
Optimal Entry – 3394
Supporting Entry – 3420
Scenario 2:
Optimal Entry – 3250
Supporting Entry – 3320
Candle Reversals for entry
- Bullish Hammer
- Bullish Engulfing
- Bullish Piercing
The Risk:
As traders, it is your job to mitigate the risk and only trade structures that provide high probability and great reward to risk ratios.
If you are not comfortable with defined exit levels, experiment with Moving Averages to help set solid exit rules to protect your capital.
Scenario 1: IF: Price breaks below the trend line / 3350– this would suggest the structure is not in our favour and would be wise to reduce exposure or close the trade until a solid signal gives us reasons to re-enter.
Scenario 2: IF: Price breaks below 3199– this would suggest the structure is not in our favour and would be wise to reduce exposure or close the trade until a solid signal gives us reasons to re-enter.
Reward / Reward Targets:
Scenario 1:
Optimal Entry 3394– Target 1 3588= 5x Reward to Risk
Supporting Entry 3420 – Target 1 3588 = 2.3x Reward to Risk
Scenario 2:
Optimal Entry 3250– Target 1 3588 = 6.7x Reward to Risk
Supporting Entry 3320 – Target 1 3588 = 2.3x Reward to Risk
My plan is to touch base with this second scenario if it presents and create the new trading plan if any variables present. This trade could be extremely potent.

#ALSI All Share Index Some bearish signalsAlsi is consolidating after the V- Shape recovery. A potential head and shoulders formation is building that could see the index drop by another 3-4%. Keeping an eye on the neckline for a test and break.

XJO - ASX 200 Expecting to see ASX:XJO to hold the larger overall triangle pattern and continue its general drift side ways after a decent pull back in the last few sessions - indicators turning up

#ALSI Back into channel.After spending a few days above the channel the ALSI has now broken back into this channel and could be heading lower in the medium term to test the bottom of this channel once more.
#ALSI JSE ALL Share Index - Cool new features in TradingviewTradingview has now added candle stick patterns. Very nice feature that points out things like engulfing candles (BE) , doji's (D), hammer candles (H)etc. ALSI is currently in a very precarious spot. It has broken through a long term resistance line, but is showing some bearish signals above this break. Not a very convincing break. Wait and see approach for me.

$UKX FTSE 100 Index. Fake break FTSE look like it made a fake break back into this bullish looking flag. Bottom of the channel could become a target 5800
💥 SPY and the DJI at Resistance BUT do we go Higher? 💫🙉💬 The SPY (ES1!) and DJI (YM1!) are both approaching resistance according to their futures contracts charts (ES1! And YM1!). Do we get a pullback here, or does the Dow retest its previous top while the other indexes run? We think both moves are in the cards. Given that, let's look at some support and resistance levels to get a sense of what might come next.
Hit that 👍 button to show support for the content!
Help the community grow by giving us a follow 🐣
-----
ES1! Support:
S1: The range at the S/R flip and pivot point is a very obvious support level. We expect a reaction here if tested.
S2: If this S/R flip and orderblock range is tested it is very likely to hold. This looks like the perfect entry if we do get a pullback. Fear should be high going into this major support.
ES1! Resistance:
R1: Our one and only resistance is the one we are at right now, the orderblock range at the previous high. A correction here doesn't really dampen the bull case assuming S1 or S2 holds. Despite this, it the ideal is for the bulls to break above R1 and treat it as support moving forward as shown by the bullish ABC on the chart.
YM1! Support:
S1: The S/R flip for the Dow isn't as pronounced as the S&P's, but we expect a reaction here regardless.
S2: The orderblock and S/R cluster is the obvious support, just like it was for the S&P. Fear should be high going into this, but this is an ideal entry for bulls if we get a correction.
YM1! Resistance:
R1: If the Dow Jones can take out this resistance, or if the S&P can take out its resistance, then the bulls get a field day because there will be no resistance on any chart until the Dow's R2.
R2: It would make a ton of sense for the market to see a pullback as the Dow finally retests the orderblock range at the all-time high. With that said, a breakout above R1 means lots of room to run to R2. A rejection here and we would then look for R1 to become support as illustrated by the bullish ABC on the chart.
-----
Summary:
The S&P and Dow Jones are both at resistance, we have yet to see a breakout. A breakout for either likely pulls the rest of the market up and then the main resistance becomes the Dow's R2 range at the previous high. A rejection here, and we have our eyes on S1 and S2. Splitting bids between these levels makes sense. Now, how much of this is going to be influenced by stimulus deals and dollar weakness? That is a great question, our main focus here is on resistance, but either of those items could make a big impact.
Resources:
nypost.com
✨ Drop a comment asking for an update, we do NEW setups every day! ✨

SPY rejection, then NEW HIGHSReguardless of the world's current events, you better believe that stocks can rally to new highs & continue climbing. Reguardless how many people die, businesses fail, or governments collapse, this can happen.
1. The real people/companies/funds who have the money to keep in financial markets play their own game & are not about to let it fall apart.
2. The richest people/governments have no choice but to keep their money in assets, this includes financial. They see money as the real tool, resources, & asset for driving more revenue. They don't get scared out of financial markets just because asset prices fall. You can learn that from the JP Morgans & Warren Buffets of the world.
3. This exact place we are at is a mirror of the same places we've been at time after time, generation after generation. This is a mirror of a cycle that will continue to occur, as that is the nature of attaching human sentiment to market behavior.
4. This is a numbers game that can be manipulated on so many levels, including corporate debt restructures, currency valuations, & government intervention. ASSETS CAN RISE INDEFINITELY AS LONG AS THERE IS A MARKET FOR THEM TO BE BOUGHT & SOLD IN + WILLING PARTICIPANTS! It is within the best interest of every high-net individual to participate in asset markets, as they allow the opportunity for capital appreciation with limited associated costs.
Conclusion: the market could fall & retest the low for all I care, but you better believe it could recover & double in a blink. The GREEN line I have drawn is a level of support that, if held, will provide enough momentum to provide a substantial breakout for financial markets across the globe.
Disclosure: I am anticipating a short entry but only down to the GREEN line. At which point, I will not fight the proven upward momentum & will be anticipating the opportunity to build a LONG position... SHORT TERM I'M BEARISH, LONG TERM I'M BULLISH.

DXY - Correction?We could be seeing a correction for DXY leading to the descending timeline where we'll either see a break or bounce
