DE 30 - BullishGenerally the DAX30 was on going a retracement after a long bullish run from March 20 - the following presents a 4 hour chart idea based on price action and technical analysis -
* Moving upward the price had crossed the 21 MA and support area of 12580.
* it then made a retracement and tried to go below the 12500 level downward but it was hammered up by the buyers to stay above the 12580 level
* If the 12580 level stays strong - a good area to buy would be at the 12650 -12670
With :
SL - 12500
TP 1 - 12745
Tp 2 - 12846
Tp 3 - 13200
Good Luck!!
Indicies

NI225 Short Entry from July 7th Position Update: (+3.95%, -1.55%Entry: Jul 7th 2020
Drawdown experienced: -1.55%
Current floating marginal return: +3.95%

#ALSI JSE ALL Share Index - Cautious approach Quite a curve on the ALSI like many other indices in the world. We could have reached double top that also coincides with the high in January 2020. Caution is advice in taking new long positions at current levels over the next few days.

$ALSI JSE All Share Index. Shooting starThe JSE All Share Index is building a shooting star candle formation on a daily chart. This is a bearish signal. The fact that it started against a longer term resistance level solidify the fact that we might be in for a period of consolidation.

US30 Market Forecast for the upcoming weekThis is my analysis on the Down Jones Industrial Average Index on a 4 hour chart. Pretty self explanatory.
Looking to catch the longer term downside move

Nas100 resistance retest and fallOANDA:NAS100USD
A fall on USTech is coming to your screen this coming week. book your seat and dont miss out but first click the thumbs up and follow my page that is all i ask for in return. thank you.

NASDAQ at all time highs...reversal pending? 🏔HTFs - Overall expanding formation seen on the daily and weekly time frames. Price has already broken significant highs, all time highs in fact and has broken somewhat correctively. An ascending channel pattern extension has formed following the upside break and at the 3rd touch of the larger expanding formation |
LTFs - The ascending pattern extension looks to have clean wave structure with the middle section followed by a 5 wave ascending channel just breaking the double top creeping up to the 3rd touch completion area. From a psychological standpoint, typical scenario of buying highs could have people caught on the wrong side of the market |
ENTRY - Although there are a lot of confluence factors stacking up in favour of the short, I don't fancy trying to call the top of this as price can just keep going. Cool to wait for the market to turn around first before jumping in unless there is a clear reversal pattern at the 3rd touch

AUSTRALIA200's next BIG SHORT is on the wayThis indicies has a high potential to make a down move/Wave/ on more time,from the technical side. On the fundamental side Covid-19 pandemic 2nd wave is about to start around the world.
Anyway I'd like to suggest you a short position on this instrument, of course you need a risk to reward ratio and risk percentage. Good Luck


S&P ($SPX500USD)📈 | The FED Speaks, All We Hear is Buy the Dip.💥💥The S&P 500 looks like it could be looking at a little downside as the market figures out what it thinks of the very impactful FED speech.
Do we rally here as the market focuses on stimulus and low interest rates for years to come? Or, does the market panic a little over the unemployment rate. Both moves are valid, but we think whatever panicking being done is ultimately going to result in more upside.
So then, let's look at some levels where we might find support and get a sense of where resistance sits for if we and when we do move up.
Support.
The S1 S/R flip is our most likely candidate for support. That gives us a little cool off, but ultimately keeps the current bull run well intact.
The S2 orderblock and S/R flip is the next level of support for the bulls, S2 retains a bullish structure while front-running the S3 major pivot point. S3 is where the bulls will need to hold to show the world who runs this mother #$@%^!.
At S4 we are likely in for that "slow recovery" the FED was talking about, but the bulls could always pull an upset here. S6 and S7 give us a chance at higher lows, but at this point, it's a long way down to those support levels.
Resistance.
The R1 orderblock cluster is an obvious resistance since it is hanging right over the current price action's head. The major resistance point is the R2 S/R flip cluster that includes the previous all-time high.
Summary.
Can SPX take out the ATH like NASDAQ? Of course, but it is likely we are in for a bit of a pullback while the market reacts to the FED news.
In fact, if we just see a straight rip up without a moment to cool down, we would be wary of the FOMO and greed ramping up in the market.
There is always another trade, so let's let the market come down to a logical level and not chase the SPX dragon.
Resources: www.washingtonpost.com + www.cnn.com + www.cnbc.com

AU200 set to continue dropping?HTFs - earlier in the year this index went into free fall. It's "bounced back" but the overall state of price has been very corrective. Separating the patterns, I can see an ascending wedge which moved into an ascending channel and is now very near significant highs |
LTFs - I'm just focused on the ascending channel section. There seems to be an expanding ending pattern at the end of the larger pattern which increases reversal probability. Price threatened to drop last week after rejecting at highs but is now creeping back up to high value area for a 3rd touch.
ENTRY - I suspect that this time price may break the immediate high within the expanding pattern to complete the overall structure. Pattern within a pattern so I'll be looking for an entry at the top of structure once the high breaks. If price action is impulsive upon approach, I'll just wait for the market to show a signal it's reversing and then wait for an entry.


DJ new trade - we need to break the last low and down we come.For more information on our strategy please view our 'Scripts' page on our Trading view profile.
Our V2 strategy shows the SL and multiple TPs on the chart too - these are customisable based on the ATR of each pair.
We have set these so that TP1 is 1:1 TP2 is 1:2 TP3 is 1:3 RR.
There are infinite ways to manage your trades to suit your mindset and time.
Works on all instruments
Directly onto your own personal trading view - all devices work
Non repainting
Please follow us to keep up to speed with our trading ideas, live streams (coming soon) and weekly recaps using our strategy.
We are continually marking some tweaks and marginal gain improvements to continue to make this easier for our trades and even more profitable. All updates are given to our members and previous purchasers FOC .
Regards
Darren
Blue FX

$DJI Possible flag break on 15minDow Jones Industrial Average has broken what looks like a 15 min bear flag. Keep en eye on this for more weakness to follow

#J210 Resource10 Index. Looking very bullishLooks like a major breakout from a flag pattern. No targets for this. Just a very interesting chart.

#DJI.. SELL IN MAY AND RUN AWAY!.. I think that there will be a long-term correction wave in the global markets on a macro scale, and it is getting closer.. Markets will become very interesting in the coming years, we will wait and see..
For DJI, the structure I expressed in the chart is very important and should be watched carefully.. I firmly believe that, we will observe wedge pattern in the chart of many markets in the big correction wave..
What I wrote is about strong possibilities that most investors and analysts do not express or expect.. Please do your own due diligence when it comes to trading.. Invest at your own risk..
I wish you all the best..


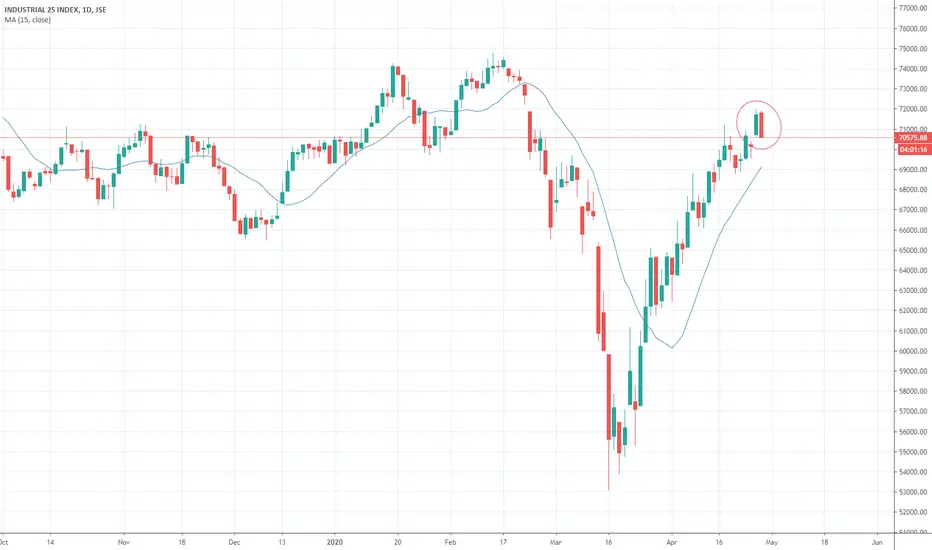
JSE Industrial 25 Index. Possible weakness setting inBearish engulfing candle settling in on the daily chart. This is something to take notice off seeing that very large caps like Naspers forms part of this index. Weakness in Naspers will put a drag on any possible upward momentum on the All Share Index. The Industrial 25 index had an incredible run in the last 5-6 weeks, and it's maybe time for some consolidation.
US30 Hello Traders, here is the full analysis for this pair, Simple tools for support, resistance and trend
next target 24680 : 25280
let me know in the comment section below if you have any questions,
Please note that the effects of the Corona virus are still affecting the US and global markets

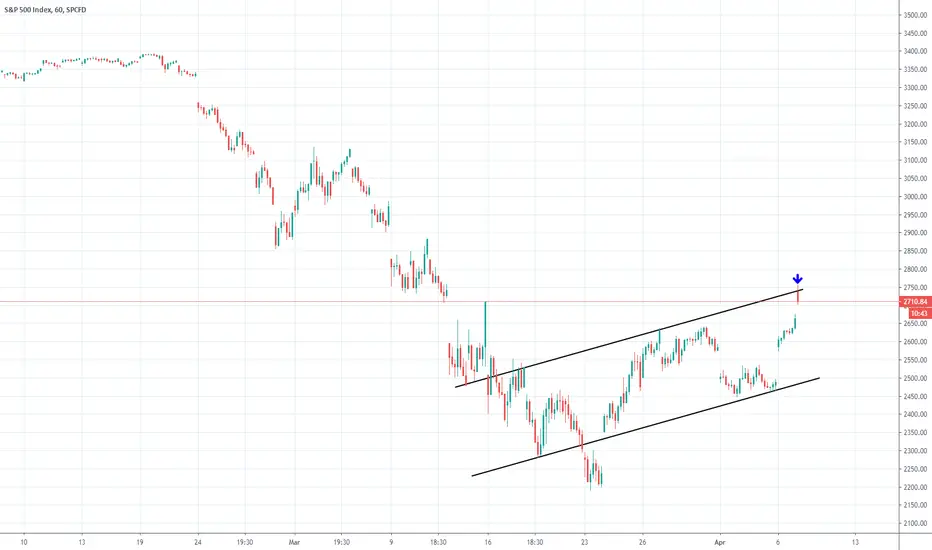
$ES! S&P e-mini. Uptrend break with a head and shoulders Uptrend break and a head and shoulders break. Target for this head and shoulders break is 1710.

$NQ! Nasdaq e-mini. Back into the channelNasdaq e-mini futures contract breaking back into the channel after what now looks like a fake break. Could be some more downside coming.

$UKX 100. Boxed into a defined channel.Consolidating before the next move. Bottom of the channel could be target.

$SPX Easy money on the long side has been madeMulti week channel test and what could possibly be a failure of a break. Some gaps below could become a target for sellers.