All share index - Overthrow and breaking back into channelNo follow through became a common theme in 2018. Lack of momentum clearly visible on the JSE.
Indicies
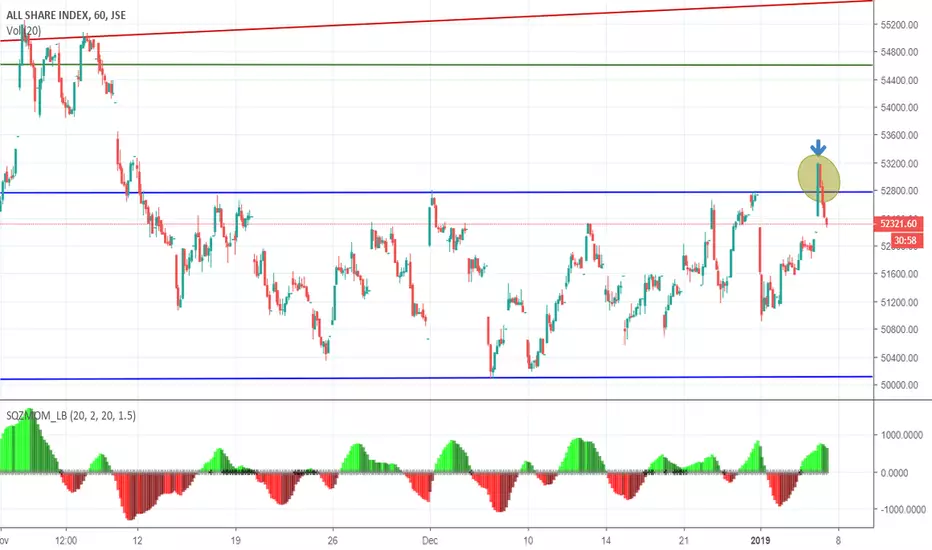
JSE all share index - Top of channelALSI at top of channel again. Will it break this time around or will resistance hold once again ?


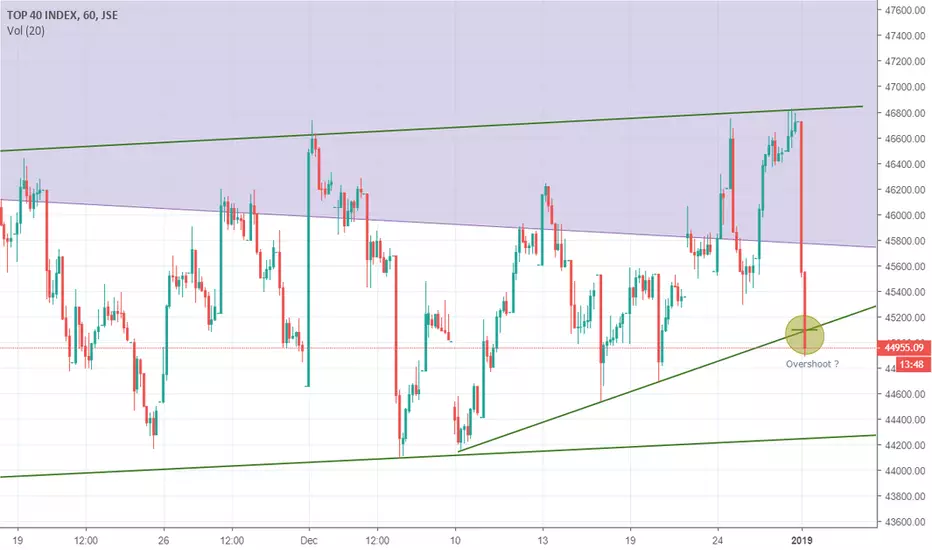
JSE TOP40 - Overshooting the mark ? Top40 looking stretched here. Wonder if we can see a little bounce here.....
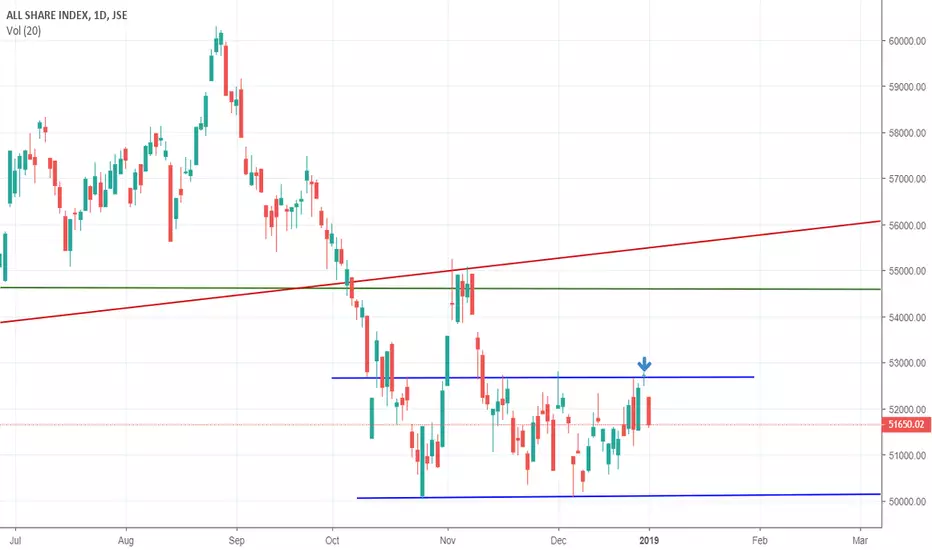
ALSI formed a bearish shooting star doji on dailyALSI formed a bearish shooting star doji on daily right on a resistance level. The bottom of this well defined channel is a likely target in coming days.
NASDAQ 100 Playing for a squeeze higherTHink this market oversold trended lower last 3 sessions cautious of a sell off

Respecting the bearish channel in SPX - SHORTS THROUGH 2685Trade set up: Our bias leans towards a short in the SPX, where we are looking for a break below the recent low of 2685 to enter the position. Upon this development, we would set a stop loss at 2725 and our take profit set at 2603. This profit target is subject to change and dependent on the price action, as a break of 2603 would hold huge bearish implications. We will update this idea as it plays out.
Why we like it: Technically the trade is pointing to a solid short opportunity – with the stochastic momentum heading lower, and short-term price analysis showing a series of lower lows and highs. The 5-day EMA has acted as dynamic resistance and contained the rallies of late. We also note the recent 8% relief rally reversed off the 61.8% Fib level.
Our view is to wait for a break of the 30 October high of 2685, as this would throw a probability of an extension of the bearish channel and suggest a move into the neckline of the recent double top at 2603.
Disclaimer.
Trading leveraged products carries a high level of risk and may result in you losing substantially more than your initial investment. Pepperstone Group Limited is licensed and regulated by the Australian Securities and Investments Commission (AFSL 414530). Pepperstone Limited is authorised and regulated by the United Kingdom Financial Conduct Authority (FRN684312). This information not intended for distribution to, or use by, any person in any country or jurisdiction where such distribution or use would be contrary to local law or regulation

Free Stock Market Analysis - Monday 29th October 2018
Hello and hope you all had a fantastic weekend? Getting ready for the new week?
DOW JONES, S&P 500 and NASDAQ 100 INDICIES
Lots of volatility last week, we had a lot of selling early last week and the selling day on Wednesday causing the rally on Thursday while on Friday we referred to as the end of the bearish move though no guarantees but we have reached our target support at 24500points
signifying the possible end of the move, if we experience more sell off then the target will be 24,000 points which is unlikely because the pre-market market data is up some points this morning.
This week in my opinion is considered as a bullish week or maybe a bullish day and a decline followed by rally back up.
The spinning top candlestick reflects the bottom but the oscillators have not caught up with the possible change to the bullish because the Stochastic is oversold which is the kind of scenario we expected and the market is doing what we expect it to do.
ADX is very high 69.04. No guarantees but pay attention to what you see in the candlesticks and the support and resistance which we discussed previously here.
S&P 500 is doing a similar thing, with a huge spinning top (this indicate a lot of indecision) setting up nice for the end of this move and the same thing is happened with the NASDAQ even though it is a bullish candlestick.
Either Monday or latest Wednesday we will see some bullish moves with extremely volatility.
VOLATILITY INDEX (VIX)
This is pretty high but notice that the current bottom is a lower VIX.
Two weeks ago when we had the first sell off was higher than the current selloff. This a good sign that the volatility is weaning and the fear is disappearing with a possible option process move and surprise you a little.
See soon and happy trading week.

DAX 1D BULLISH TRENDDax is coming off a falling wedge pattern.
Take profit can hit as high as 13204 by the beginning of November.

Market Analysis 10.10.2018 - Stocks and Indices It was a very exciting trading week ended on Friday 04th October 2018, it just goes to show that what goes up must definitely come down.
Based on the last 2 trading sessions, the question we should be asking now is how far down will the markets be going? What does this new week bring? Some weeks it is difficult to technically forecast the market movement and I guess this is one of such week. There are lots of signals we can get into more like a month of bearishness but this does not look like a major reversal upheaval.
The nature of the market is up and down. To help you understand the market and give you confidence that in years to come the stock market will go up and down. Last week saw a size able sell off but it was not unexpected because it happens in the stock market every so often. Up and Down is the nature of the game, it is just like the natural cycle of the seasons, we just need to get ready and ride the season through.
Do not get caught up in the fake news, hyperbole and prevalent news occurrences be confident that up and down is the nature of the market. I am not worried about the future even though you were not set up for bearish market last week such things happen.
We will be taking a balanced look at this market trend. Don’t be worried about the future of stock trade. Just to let you know, I don’t trade the fundamentals or the news, I am a technical trader by looking at the big picture. Since May the market as gone up and at some point we need to come back down.
Since May 2018, the Moving Averages crossed and rallied with a little sell off on the DOW, this continued to move up and down and it happened last week. Interestingly same pattern on the S&P 500 -3.66% -3.43% and NASDAQ.
DOW JONES (DOW)
On Wednesday night the chart showed a shooting star and gravestone Doji candlestick occurred and it precedes a selling off (quite a reliable candlestick pattern) with such candlestick pattern you tighten your stops. We saw the warning and it happened because Thursday market we had a bearish day it gives a 3-day evening star reversal candlestick pattern which happened meaning a continuation of the bearing market and may probably lead to the DOW selling off to 26000 points.
On Thursday we sold off to the 10 period moving average and on Friday we had a long lower shadow which means buying pressure. On a 5-minute chart pattern to see the intra-day view, we notice the technical opening showed we traded down and close to the end of the day we traded back up. At the end of the day we had buying pressure despite the bearish market.
What Do We Expect?
The trending behavior setup is either bullish or bearish . Monday 8th October 2018 market is a coin toss because the trading set up is positioned for either a sell off or buy on.
We knew the bearish trend was coming in because it was all overbought and the candlestick splitting. In the event the bearishness continue we need to look for extreme ranges of maybe 25500 but 26000. However, a lot of buying pressure like we saw during the summer hopefully the correction will be done by Wednesday and we will be on the way to our bullish trend .
Sadly, Oscillator are heading down may enter the oversold region. None of the oscillator is supporting buy. RSI is back to 50% and with a full blow move to oversold we may end up to the 26,000 points index.
The Moving Averages are not compromised, the trend looks strong in the bullish picture. The Ebbs and Flows are natural.
S&P 500 -3.66% -3.43%
This is pulled back to a good support at 2885 and buying pressure coming in last week. There were lots of selling pressure for 6 days preceding the sell off last week to the 50 period moving average along with a buying pressure end of last week. There is an equilibrium leading to an unconvinced market. What gives me optimistic is we are on a support and if it doesn’t hold then aim for 2800.
Similar assessment on the S&P -3.66% -3.43% as the DOW. The sell off was fast, scary but not to be too concerned.
Oscillators pulling back and a bearish divergence on stochastic and a weak divergence on the MACH-D. with stochastic there seems to be a hold point at the 50 mark and may not go below to the oversold range. See the trend line and the horizontal line in the image above.
Bollinger band is in a squeeze. It is not a fully confirmed bear or bull market .
NASDAQ
This closed below the 50 period MA and it is alarming because it sold off to 7399. The buying pressure on Friday is a good sign to a bullish trend if not the NASDAQ could be a complete reversal.
Oscillators are bearish and the Bollinger band squeeze seems to be breaking bearish possibly down to 7250 and a bullish market continues. The Bollinger band squeeze breaks downwards happens with force but reverses also quickly from my experience. ADX is moving up which is sign of a bearish strength and the parabolic is bearish .
The NASDAQ is definitely the outlier.
Conclusion
I believe the big picture trend is still intact there is not enough to change our outlook on the market despite the sell off from the last two trading sessions. The market is 50 percent but we do not need to change our outlook on the market.
This seems to be the overall outlook on the market.

Long SPX500 @ 2,800.00; TP @ 2,900.00, SL your choiceLong SPX500 @ 2800.00; TP @ 2,900.00, SL your choice

China A 50 TARGET HITChinaA50 has gaied 760 points after the call i made to BUY at 11000. I still se upside for another potential 250/500 points up in the coming days.

DAX30 - TARGET HIT In my previous DAX call I recommended a buy till 12400. It has passed that level convincingly and might even look to go towards 12500/680. However I do expect a fall from those levels back towards 12200/140. but for now I will stay on the sideline and watch what it does.

Dow Jones - Bullish FlagFundamentally, it looks like the overall market sentiment shifted and the risk-on scenario is back with the US indices set to retest the all time highs. Technically the asset is in a strong uptrend as well despite the overbought RSI readings on the higher time frames.
The trade idea is to trade the bullish flag pattern on the break out. For additional confirmation, there should be a time filter of the 1 hour candle close above the flag + the short term Resistance. SL below the recent higher low. TP calculated based on the M P O projection which also coincides with a psychologically important level of 26600.
The break (preferably impulsive) should occur in the next 6 - 7 hours in order to pattern to be valid. Personally expect the break to occur on the US session open.
Follow me and like the idea if you like my pattern analyses.
Wish all a great trading day!

CHINA A50 - LongChinaA50 has fallen towards 200SMA and 161% Fibo. Has found support and looks set for a good 1000 points Rally in the coming weeks.

US Indicies/Stocks setting up for a much deeper price correctionPay attention traders, the US equities market and the US Indicies are setting up for a much deeper correction than many people are expecting. A few weeks ago I warned that a 2.5~3% correction was setting up in the markets. The markets immediately turned lower and fell about 2.25% before bottoming out. Today, my custom indicators are warning that we could be setting up for a much bigger price correction. Possibly in excess of 4% with a chance that we could see a move to near February 2018 lows on an extreme move.
I don't expect this extreme setup to happen immediately as it would likely have to be paired with some global-economic event cycle. In other words, a 3~5% move is understandable given the recent rally. As long as recent support holds, this is a healthy price rotation for further upside prices. A deeper price correction, to near Feb 2018 lows, would be a sign that some type of failure in the markets is taking place.
The US Indicies have recently setup a massive double top formation that could become a catalyst for this next move. If you are long and have decent profits, this might be the time to book those profits and reduce your exposure to risk. My analysis says we are just a few days away from seeing a deeper pullback in the US majors. If you are capable, initiating a Long trade in an ETF 3x Short symbol might be a very good play. Just remember, this will likely be a 3 to 6 day trade before maximum profits are reached.
Pay attention to my analysis if you want to learn to time the markets like I do. I've been doing this type of research for over 25 years.

QQQ - (Short Premium) Short straddle to profit from high IV $$$In this video I cover a short straddle trade in QQQ that has a slight bullish bias to profit from both a price pop as well as the high implied volatility in this underlying.
**Current Market Structure**
-Medium/Long term bullish trend
-Price is reaching some key support areas at 175, 171, 170
-Bearish weekly candle may see prices push lower but I expect buying pressure to quickly enter back into the market
**Trading Tips**
-Right now is a good opportunity to be selling premium as the implied volatility has spiked from the recent selloff
-IVR is much higher in QQQ than in SPY or DIA due to the tech heavy nature of the Nasdaq and the fact that much of the selling has been in tech
-I could see price dropping down to key supports but I expect strong buying to enter back in, so I selling premium with a bullish bias
-Breakevens are in good areas with the lower BE just below key support and the upper breakeven giving plenty of overhead room in case price starts running up quickly
**Trade Ideas**
-I sold 178 strike straddles w/ 53 DTE for $9.50 per contract($950 total profit)
-I am selling premium with a bullish bias to not only profit from the high IV but also to profit from a bullish directional move.
-My defensive strategy, in case either my put or call is breached, will be to roll the untested side and create an inverted strangle. If the price is tested on the put side I would likely sell new 16-30 delta naked puts to further profit from high IV and get more directional for a price pop.

EWZ - (Short Premium) Selling straddle into high IVRThere is no real clear price action direction, this chart has even room to run in both directions, and the 'IVR is high which makes it a good candidate for a short premium trade. I am selling a straddle as I can collect 10% of the underlying in premium in just 46 days.


NASDAQ / NQ - Inverse Head and Shoulders breakout buy signalOvernight the NASDAQ futures formed an inverse head and shoulders pattern following Trumps tariff threats. This pattern is showing that buying has quickly entered back into the market and we may see a large short squeeze with a quick pop in price. The price target based on the pattern and overhead resistance is around 7430. As with all patterns nothing is guaranteed so if you enter this position always protect yourself with stoplosses or use defined risk trades like the short put vertical spread.

FTSE 100 - Bullish 5-0The FTSE 100 is shaping up nicely on the 4h chart, I'm expecting this bullish 5-0 formation to complete within the next few weeks at the 50% retracement level.
The measurements for a valid 5-0 pattern are detailed below.
B: 1.13 - 1.618
C: 1.618 - 2.24
D: 0.50
We will be trading with a stop loss below the 0.618 retracement level at 7240. If we execute the trade, target is 7896.
You guys know what to do... Like, comment and share! More analysis on the way.

S&P 500 - Bullish AB=CD BAMMBullish AB=CD BAMM opportunity is now shaping up on the Standard and Poor's 500 index on the 4h chart.
This one to one measured move looks excellent, the AB=CD completion is beyond the ATH at 2877, this is complemented by the reciprocal ratio of 0.5 which is the 2.0 projection.
I'm expecting price to break resistance @ B followed by an acceleration in price action towards the pattern's completion. This move needs to be assessed in real time and we cannot use any limit orders, analyse price action upon the breakout of 2792 to determine the continuation.
We will be trading with a tight stop loss if executed, target is 2892.
You guys know what to do... Like, comment and share! I'll keep you all posted :)
