My View on Indusind Bank for April 2021If this channel breakout sustain for 2 3 days then indusind bank will hit the near term targets .
this view is only for educational porpose .I am Not Sebi Registered analyst .
!!!Always Use Stop Loss !!!
:-) HappY Investing :-)
INDUSINDBK

INDUSIND Back to Bullish MoodIndusind Bank is going to fire from these levels, Took support exactly from 5 months old trend line, break out of the downward move, and strong closing above 50 Day EMA. Expected to go 1100+ and 1200+ in the near term.

INDUSINBK LONG INTRADAY 25 Mar, 2021Dear trader,
If u look at the chart of INDUSINBK (analysis based intraday only) the INDUSINBK support at 963 and Target at 973 and Stop loss at 954.
The chart clearly indicates Bullish Trend you can also see the candle stick patters for more indepth analysis.
In Intraday most important thing is to enter and exit points.
Our signals are based on analytics, algorithms, mathematical derivatives.
Always be a responsible trader, kindly trade only when you have maximum opportunity in the market with minimum risk and with keynotes like data, analysis and proper strategies.
Kindly message us for strategies and analysis.

IndusInd LevelsIndus shouldn't break 981.30, below that you can expect following levels 981.30-952.85-931.20

INDUSINDBK INTRADAY FEB 18 2021 LONG FOR INTRADAYHi Friends!
Please refer to the Resistance & Support levels for today for clarity.
Based on our intraday trading analysis with Quality research we got these levels.
Dear traders kindly follow our signals for maximum profits, our signals are based on analytics, algorithms, mathematical derivatives.
Always be a responsible trader, kindly trade only when you have maximum opportunity in the market with minimum risk and with keynotes like data,analysis and proper strategies.


INDUSINDBK READY TO TAKE A BREAKOUT ?Let's see if the trendline broken in 15 min then we can see for the buy side target or else straight to the downside first target


BUY INDUSIND BANK ABOVE 953.50 TGT 1180 SL 858looking good on daily as well as weekly . will try to touch its trend line . high beta stock so small qty will also give you good returns.

Indusind Bank - LongIndusind Bank - It has crossed its Resistance of 910 and sustained above it.
Since its a high beta stock support of Bank Nifty Index is very much necessary which is also there.
+
There is Positive Moving Average Crossover
CMP - 922 , Target - 936 , 948 , 962 , SL - 910


BUY INDUSIND BANK above 938.75 sl 928 tgt 953intraday buy indusind above 938.75 tgt 953 sl 928 . will move very fast above 938.75 . keep risk also in mind and on system


INDUSIND BANKI'm not an expert I'm just sharing my views on INDUSIND BANK for next trading day
I'm not responsible for any profit or loss this is not a recommendation

#INDUSINDBK building up for 1200 #INDUSINDBK building up for 1200, we should see it sometime in Jan 2021 I feel.

Indusind Bank longIndusind Bank now moving on intermediate 5th Wave. here draw Strong Gann resistance Level.
we except to Gann level 1 or 3.
How to understand in level. when day Candle high come to touch this level and it not cross. we can conform.
when cross it will move to next level.

INDUSIND BANK MAKING DOUBLE TOP WITH NEGATIV RSI DIVERGENCEINDUSIND BANK MAKING DOUBLE TOP WITH NEGATIV RSI DIVERGENCE

indusind bank can retrace from currnent level after breakdownindusind bank can retrace from currnent level after breakdown

can short indusbank once breakdown from rising wedgecan short indusbank once breakdown from rising wedge RSI also giving negative diversions

INDUSINDBK- Looking good for Long TimeFrame- 2-3 DAYSINDUSINDBK- Looking good for Long TimeFrame- 2-3 DAYS

IndusInd Bank - Wave 5 to take it to higher levels...If my counting is right then, IndusInd Bank is currently has completed Wave 4 and now shall start Wave 5. Looks attractive at CMP 608/- with SL of 592/- for the targets around 680/-

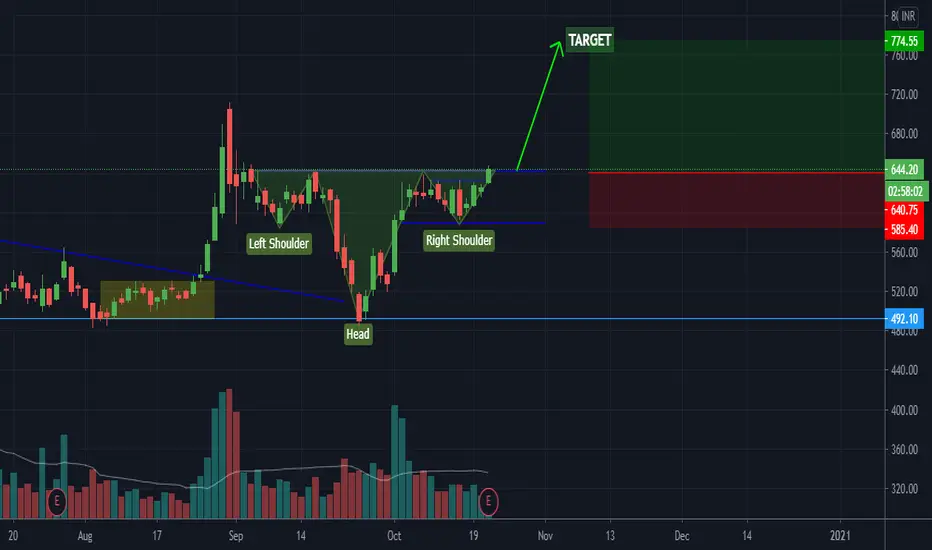
Indusind : Bullish SetupScrip has formed classic Inverse Head & Shoulder setup. All the key levels pointed in chart.