$DRE: Acting Like They Forgot About$PLD and $DRE, I believe, are setting up for a longer run here as the deflationary environment takes over. Don't forget about industrial REIT's or $DRE :)
Industrial

Infrastructure & Alternative Energy I mean need I say more than the company’s name? Just wait for that bill to be signed! This company has a backlog of $2 billion! At the same price level that took it from $12 to $24! I got the funds in place!

The DAX Battle: You predict, We follow On the DE30, price has been ranging inside this wedge since many weeks without any success to go out of it. Now, as the path becomes narrower, it's time for a real battle between the buyers and the sellers. The buyers of course have a higher winning ratio since the world is recovering from the covid-19's pandemic that has drastically hit the industrial sectors in every country.
Now let's see what are your predictions for this one !

Industrial metals are set to witness an upcoming rally
Industrial metals are set to witness an upcoming rally after Joe Biden's $6T budget proposal, The spending plans would fund investments roads, water pipes, broadband internet, electric vehicle charging stations and advanced manufacturing research.
CENX is an industrial metal stock that's being traded within a descending channel on the 4hr time frame since March 12.
Momentum and strength indicators are supporting that the stock would move upward to hit $14.65 and $16.25 levels consequitvely on the short term.
Century Aluminum shares CENX rose 7.62% in yesterday's trading in a strong session for metals.

Stag: trendlines broken new lines filled STAG ...what can we say technical about it.
The purple is a long term July '2017 trend line and the pink is a Aug '2018 trend.
We pass the 2017 trend line and are now touching, ever so slightly, the 2018 trend line.
We passed all resistance levels (long ago) and we are $3 a share away from the 50MA.
In the short term we expect some profit taking and a pull back but with the limited supply of large industrial spaces (suitable for ecommerce or distirubtion) we don't see a problem keeping these levels in tact.
Happy upside trading on STAG

YM30 Dow jones LONG signal The stop is in same placePreparation of trendline breakout signal... Take care friends ,trading is easy even artifical inteligence cannot outsmart dear brothers and sisters.

Element Solutions (ESI) Full Detail!Company Profile:
A Global Innovator of Advanced Specialty Chemical Solutions
Element Solutions is a leading specialty chemicals company whose operating businesses formulate a broad range of solutions that enhance the performance of products people use every day. Developed in multi-step technological processes, our innovative solutions enable our customers' manufacturing processes in several key segments, including electronic circuitry, communication infrastructure, automotive systems, industrial surface finishing, consumer packaging, and offshore energy.
Customers of our businesses use our innovation as a competitive advantage, relying on us to help them navigate in fast-paced, high-growth markets. For example, in-car technology, from infotainment to driver assistance, is accelerating the pace of new product development and changing the competitive playing field for automotive manufacturers. With a long-standing presence in automotive markets and a deep market expertise in electronics, we sit at the intersection of this fast-growing market. The breadth of our offerings provide strong strategic value to the end markets we serve.
Financials (Comparison vs DuPont)
Competitors: BP, DuPont, AtoTech
There are 7 things I compare when researching stocks. I make sure I find at least 2 strong competitors for the best analysis I can give! I only post 1 comparison for the sake of time.
1. Return on Investment Capital
2. Price to Book Ratio
3. Price to Earnings Ratio
4. Net Margin%
5. Return on Total Assets
6. Return on Equity
7. Earnings per Share
1. ROIC
Element Solutions
2019 1.15%
2020 3.26%
DuPont
2019 -0.69%
2020 -.511%
2. P/B Ratio
Element Solutions
2019 1.32
2020 1.16
DuPont
2019 1.16
2020 1.08
3. P/E Ratio
Element Solutions
2019 33.84
2020 22.02
DuPont
2019 96.40
2020 NO DATA
4. Net Margin %
Element Solutions
2019 4.30%
2020 7.58%
DuPont
2019 -3.00%
2020 -1.55%
5. Return on Total Assets
Element Solutions
2019 1.15%
2020 2.82%
DuPont
2019 -0.50%
2020 -4.22%
6. ROE
Element Solutions
2019 3.64%
2020 5.55%
DuPont
2019 -0.95%
2020 -7.59%
7. Diluted EPS
Element Solutions
2019 0.35
2020 0.14
DuPont
2019 0.67
2020 -0.11
Fundamental Analysis
To keep things simple, I like this stock due to their market exposure. They are involved with many sectors of industrial lines. Automotive, Computing, Consumer Goods, Energy/Resources, Military/Aerospace/Medical, Mobile, Printed Packaging, and Water Treatment. After looking at their financials the main thing I noticed in comparison with DuPont and BP was the Return on Investment Capital. DuPont ranged from -0.69% to -.511% in comparison to Element's 1.15% to 3.26%. These were yearly comparisons and it tells me that DuPoint and BP could be losing some value. I like the innovative drive that Element brings as well.
Technical Analysis
Stochastic RSI: White line is close to the orange line which means price is close to being oversold while also being in a support zone.
Fibonnaci: Ranged from the potential "New Support Zone" to the "New Resistance Zone". I'm looking for a retracement of the previous high being $19.36. I'm expecting a retracement of anywhere between 30% and up.
MacD Squatter: White line is crossing down below the zero line while in a support zone.
Entry Rule: Once crossover happens, I will go to the 5 or 15 min for confirmation before entry.
Current Price: $17.49
Strike Price: $18.24 - $19.36 and up if lucky.
Stop Loss: $16.66
OF COURSE I WANNA SEE YOU MAKE IT!
Follow, Like, Agree, ...or Disagree!
- Signed, Amateur Robinhood Trader lol


Weak Support & a fall to taste for PIDIliteWeak Support Strong point of entry below the zone and small SL.
THUS very lucrative entry point.

DJI next possible movesA daily vision makes possible a retest of 21,600 points. Then, perhaps, another move upside. Come November, perhaps another all time high.

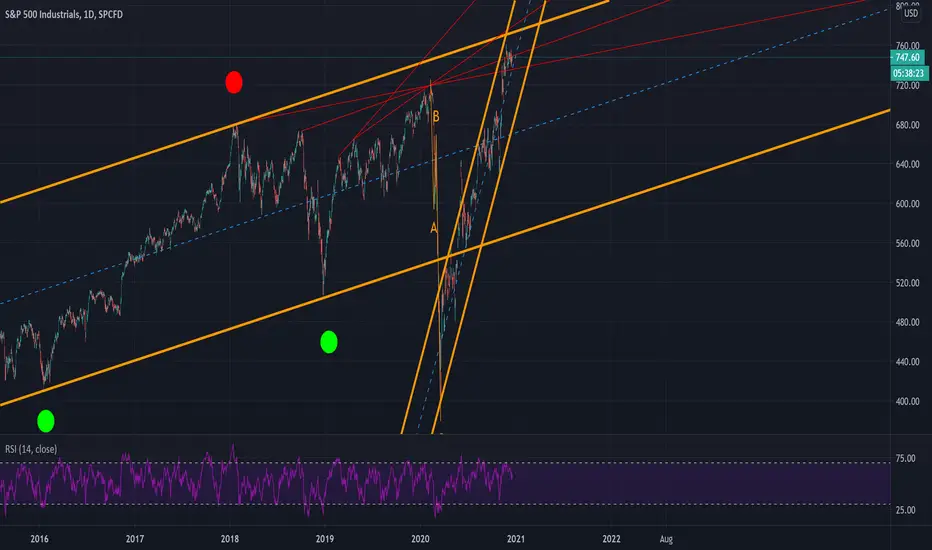
Dow Jones Industrial triple year reversalThis chart is showing that it is the 1st year ever that the famous index price movement range in engulfing the previous 3 years range.
This illustrates well the incredible volatility that we have seen so far this year.
Also notice the important range expansion shown (recent years have seen increasingly large range), often a preceding condition of important market tops (even though this might only come in a few years I believe).

Fortress Transportation (FTAI) short.All description on the chart.
Please, don't forget to like and follow.
Thank you.

AMAT MA MACD Histogram just turned positiveA buy signal is generated.This is a Bullish indicator signaling AMAT's price could rise from here. Traders may explore going long the stock or buying call options. I identified 40 similar cases where AMAT's MACD histogram became positive, and 34 of them led to successful outcomes. Odds of Success: 85%.

American Airlines $AALThere was super volume yesterday which will move the stock up its first target price.
12 months Consensus Price Target: $16.88
if you find my charts useful, please leave me "like" or "comment".
Please don't trade according to the ideas, always rely on your own knowledge.
Thx

Next leader in Thai stock marketFinancial sector is leading the market at the moment but petrolium within industrials is also showing signs of strength. $BCT stock is in a buy zone:
1) Relative strength curving up on daily and weekly - potential outperformance
2) RSI in buy zone
3) Massive falling wedge approaching its apex, watching breakout today
4) Volume signature shows the presence of buyers.
Long Friday open.

Spirit Airlines $SAVE$SAVE is still in bearish side and after it formed an unconfirmed cup, now it is looking for its direction. Breaking below $7.25 will confirm the cup w handle,inverted. There is a positive divergence which is a signal for upward. However, there are 20SMA (red one) and 50SMA ahed will work as the resistances.
I would wait to get above $18.68 to be long.
If you find my charts useful, please leave me "like"
thx

ANCOM-Adakah sedang ambil nafas untuk rebound?Kaunter ANCOM dari sektor Industrial Product & Services dengan aktiviti utama dalam sub sektor bahan kimia (chemical).
Dari segi FA, rating adalah neutral.
P/E Ratio: 20.63
ROE (%): 2.53
NTA (RM): 1.380
Dari segi TA, kaunter sedang uptrend dan berada di atas garisan MA20 (short term), MA50 (medium term) dan MA200 (long term).
Dari chart, nampak price sedang pullback dan berkemungkinan untuk rebound. Entry boleh consider pakai strategi Buy on Dip (BOD).
Support: 0.700
Resistance 1: 0.735
Resistance 2:0.770 (52 weeks high)

Bottom Here or $1.45 (GE)This one could get fun.
General Electric Company is a global digital industrial company. The Company's products and services range from aircraft engines, power generation, and oil and gas production equipment to medical imaging, financing and industrial products.

Dow Jones Industrial Death Cross Imminent The last time we had a death cross was December 2018. The previous death cross before that was January 2016. Go back in time and look at the charts. Both times the DJI dropped for approximately 5 more days and then started going back up. I expect the same thing to happen after this death cross.

JSE:STXIND Industrial Index Breaking StructureThe JSE Industrial Index has broken below the lows of the distribution trading range. Some support could be found at 5500 but after a backup to the trading range, the markdown should begin in earnest. The Industrial Index is stronger than the Top 40 index and the decline in this sector is slower than the rest of the stocks.

Here is a sell setup in Monadelphous Group $MNDThe stock is trading below all three moving averages and below the trendline.
Technical indicators are showing bears is still in control.
We are very likely to break that critical support line (yellow line) when we do, more downside to come.
I will not be holding this stock right now.

FMC BUYBuy signal at 93.47 $
Timeframe - 1 week.
I missed this signal, and I didn't go for this signal, but let it be in this profile.
FMC Corporation is a diversified chemical company serving agricultural, consumer and industrial markets. The Company operates in three business segments: FMC Agricultural Solutions, FMC Health and Nutrition, and FMC Lithium.
__________________________________________________________________________
You can use the signals independently or like indicator of trends together with other indicators in your trading strategy.
Know that the success of your strategy that based on those signals depends from your money management and the additional conditions that you make in these strategies.
You use these signals inside your strategies at your own risk.
The chart shows the last trades on the product + the last signal.
I have several strategies for different products, and I want to show you proof of it works on history, and you will be able to see it, when returns to that profile.
Therefore, subscribe and watch for that profile.
