GBIRYY - U.K Inflation (May/2025)ECONOMICS:GBIRYY
May/2025
source: Office for National Statistics
-The annual inflation rate in the UK edged down to 3.4% in May 2025 from 3.5% in April, matching expectations.
The largest downward contribution came from transport prices (0.7% vs 3.3%), reflecting falls in air fares (-5%) largely due to the timing of Easter and the associated school holidays, as well as falling motor fuel prices.
Additionally, the correction of an error in the Vehicle Excise Duty series contributed to the drop; the error affected April’s data, but the series has been corrected from May.
Further downward pressure came from cost for housing and household services (6.9% vs 7%), mostly owner occupiers' housing costs (6.7% vs 6.9%).
Services inflation also slowed to 4.7% from 5.4%. On the other hand, the largest, upward contributions came from food and non-alcoholic beverages (4.4% vs 3.4%), namely chocolate, confectionery and ice cream, and furniture and household goods (0.8%, the most since December 2023).
Compared to the previous month, the CPI rose 0.2%.
Inflation

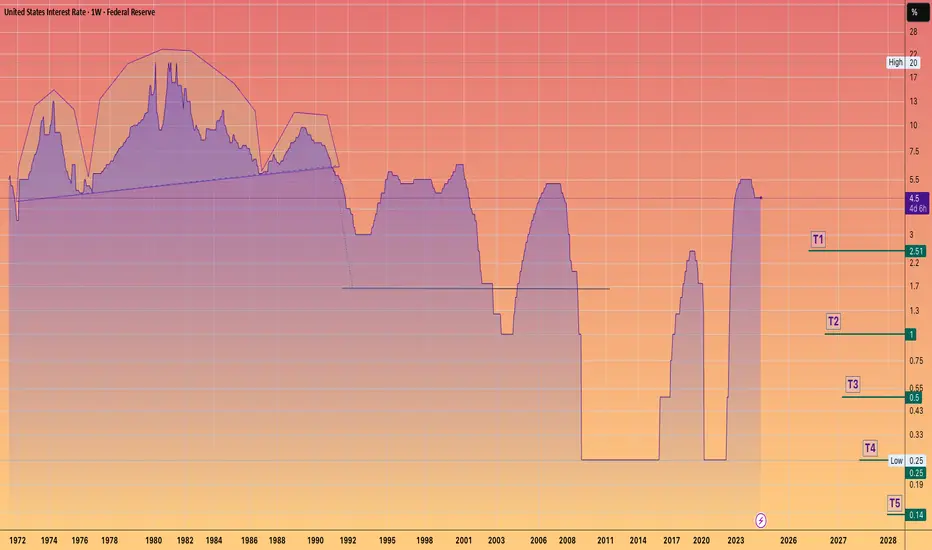
Mr. LATE drop the RATE!!"Jerome Powell aspires to be remembered as a heroic Federal Reserve chair, akin to Tall Paul #VOLKER.
However, Volker was largely unpopular during much of his tenure.
The primary function of the Federal Reserve is to finance the federal #government and ensure liquidity in US capital markets.
Controlling price inflation should not rely on costly credit.
Instead, it should be achieved by stimulating growth and productivity through innovation and by rewarding companies that wisely allocate capital, ultimately leading to robust cash flows... innovation thrives on affordable capital.
While innovation can lead to misallocations and speculative errors, this is a normal aspect of the process.
(BUT it is crucial that deposits and savings are always insured and kept separate from investment capital.)
By maintaining higher interest rates for longer than necessary, J POW is negatively impacting innovators, capital allocators, small businesses that need cheap capital to function effectively, job creators, and the overall growth environment.
Addressing price inflation is a far more favorable situation than allowing unemployment to soar to intolerable levels.
"Losing my job feels like a depression".
But if I have to pay more for eggs, I can always opt for oats.
$JPINTR -Japan Interest Rates (June/2025)ECONOMICS:JPINTR
(June/2025)
source: Bank of Japan
- The Bank of Japan kept its key short-term interest rate unchanged at 0.5% during its June meeting, maintaining the highest level since 2008 and aligning with market expectations.
The unanimous decision underscored the central bank’s cautious stance amid escalating geopolitical risks and lingering uncertainty over U.S. tariff policies, both of which continue to pose threats to global economic growth.
Tokyo and Washington agreed to extend trade talks after failing to achieve a breakthrough during discussions on the sidelines of the G7 Summit in Canada. Meanwhile, as part of its gradual policy normalization, the BoJ reaffirmed its plan to cut Japanese government bond purchases by JPY 400 billion each quarter through March 2026.
Starting April 2026, it will then slow the reduction to JPY 200 billion per quarter through March 2027, targeting a monthly purchase level of around JPY 2 trillion—signaling a measured but steady path away from ultra-loose monetary policy.

"Downside DAX" is what we will call it in July?Looking at the technical picture purely, we can see that weakness is starting to kick in. Will July be a negative month for DAX? Let's have a look.
XETR:DAX
Let us know what you think in the comments below.
Thank you.
77.3% of retail investor accounts lose money when trading CFDs with this provider. You should consider whether you understand how CFDs work and whether you can afford to take the high risk of losing your money. Past performance is not necessarily indicative of future results. The value of investments may fall as well as rise and the investor may not get back the amount initially invested. This content is not intended for nor applicable to residents of the UK. Cryptocurrency CFDs and spread bets are restricted in the UK for all retail clients.

US Unemployment Rising: How Is This NOT a Recession?The U.S. unemployment numbers are steadily climbing, as indicated by recent Bureau of Labor Statistics data. Typically, significant rises in unemployment correlate directly with recessions, which are shaded gray in historical data charts.
Currently, unemployment has reached over 7 million, significantly higher than recent lows. Historically, every similar increase has coincided with or preceded an official recession declaration. Yet, mainstream economic narratives have avoided labeling this a recession.
What does this data tell us, and is the market accurately pricing in the risk? Are we already in a recession, or is this time different?
Share your thoughts below. Let's discuss the disconnect between the unemployment reality and official recession narratives.

$USIRYY -U.S CPI Below Expectations (May/2025)ECONOMICS:USIRYY 2.4%
(May/2025)
source: U.S. Bureau of Labor Statistics
- The annual inflation rate in the US increased for the first time in four months to 2.4% in May from 2.3% in April, though it came in below the expected 2.5%.
Prices rose slightly more for food, used cars and new vehicles but shelter cost slowed and gasoline prices continued to decline.
Meanwhile, the annual core inflation rate held steady at 2.8%.
On a monthly basis, both headline and core CPI increased by 0.1%, falling short of market expectations.

US INFLATION, a decisive figure this week!This week, which runs from Monday June 9 to Friday June 13, sees two fundamental factors which will have a strong impact on the stock market: the continuation of the trade diplomacy phase which is currently acting as a fundamental red thread (particularly between China and the United States) and, above all, the US inflation update according to the PCI price index on Wednesday June 11.
The key issue is to determine whether tariffs in the so-called reciprocal tariffs trade war have begun to trigger a rebound in inflation. This is what the US Federal Reserve (FED) is watching to determine whether or not it should resume cutting the federal funds rate, which has been on hold since last December.
1) Federal funds rate cuts have been on hold since the end of 2024
Unlike the European Central Bank and other major Western central banks, the FED has paused its key interest rate cut since the beginning of the year. The ECB's key interest rate, meanwhile, has been cut several times and now stands at 2.15%, i.e. a key interest rate considered neutral for the economy (i.e. neither an accommodating nor a restrictive monetary policy).
This divergence in monetary policy between the FED and the ECB is perceived as a risk by the market, while the trade war could end up having a negative impact on US economic growth.
2) The market does not expect the FED to resume cutting rates before September.
But Jerome Powell's Federal Reserve (FED) is taking a hard line, believing that the Trump Administration's trade war could undermine its efforts to fight inflation. Although the FED's inflation target of 2% is not far off, according to the latest ECP and CPI updates, the FED wants confirmation that companies have not passed on sharp price rises to compensate for the tariffs. This is why the inflation figures published this May have a decisive dimension at a fundamental level. The Fed will be able to resume cutting the federal funds rate if, and only if, disinflation is not threatened by the trade war.
3) This is why the ICP US inflation update on Wednesday June 11 is the fundamental highlight of the week.
This Wednesday, June 11, we'll be keeping a very close eye on the publication of US inflation according to the ICP. The monthly reading will be closely watched, as will the year-on-year nominal and underlying inflation rates.
The consensus is relatively pessimistic, with inflation expected to rebound at both monthly and annual rates. Real-time inflation, as measured by TRUFLATION, is still under control, so the pessimistic consensus may be overturned.
DISCLAIMER:
This content is intended for individuals who are familiar with financial markets and instruments and is for information purposes only. The presented idea (including market commentary, market data and observations) is not a work product of any research department of Swissquote or its affiliates. This material is intended to highlight market action and does not constitute investment, legal or tax advice. If you are a retail investor or lack experience in trading complex financial products, it is advisable to seek professional advice from licensed advisor before making any financial decisions.
This content is not intended to manipulate the market or encourage any specific financial behavior.
Swissquote makes no representation or warranty as to the quality, completeness, accuracy, comprehensiveness or non-infringement of such content. The views expressed are those of the consultant and are provided for educational purposes only. Any information provided relating to a product or market should not be construed as recommending an investment strategy or transaction. Past performance is not a guarantee of future results.
Swissquote and its employees and representatives shall in no event be held liable for any damages or losses arising directly or indirectly from decisions made on the basis of this content.
The use of any third-party brands or trademarks is for information only and does not imply endorsement by Swissquote, or that the trademark owner has authorised Swissquote to promote its products or services.
Swissquote is the marketing brand for the activities of Swissquote Bank Ltd (Switzerland) regulated by FINMA, Swissquote Capital Markets Limited regulated by CySEC (Cyprus), Swissquote Bank Europe SA (Luxembourg) regulated by the CSSF, Swissquote Ltd (UK) regulated by the FCA, Swissquote Financial Services (Malta) Ltd regulated by the Malta Financial Services Authority, Swissquote MEA Ltd. (UAE) regulated by the Dubai Financial Services Authority, Swissquote Pte Ltd (Singapore) regulated by the Monetary Authority of Singapore, Swissquote Asia Limited (Hong Kong) licensed by the Hong Kong Securities and Futures Commission (SFC) and Swissquote South Africa (Pty) Ltd supervised by the FSCA.
Products and services of Swissquote are only intended for those permitted to receive them under local law.
All investments carry a degree of risk. The risk of loss in trading or holding financial instruments can be substantial. The value of financial instruments, including but not limited to stocks, bonds, cryptocurrencies, and other assets, can fluctuate both upwards and downwards. There is a significant risk of financial loss when buying, selling, holding, staking, or investing in these instruments. SQBE makes no recommendations regarding any specific investment, transaction, or the use of any particular investment strategy.
CFDs are complex instruments and come with a high risk of losing money rapidly due to leverage. The vast majority of retail client accounts suffer capital losses when trading in CFDs. You should consider whether you understand how CFDs work and whether you can afford to take the high risk of losing your money.
Digital Assets are unregulated in most countries and consumer protection rules may not apply. As highly volatile speculative investments, Digital Assets are not suitable for investors without a high-risk tolerance. Make sure you understand each Digital Asset before you trade.
Cryptocurrencies are not considered legal tender in some jurisdictions and are subject to regulatory uncertainties.
The use of Internet-based systems can involve high risks, including, but not limited to, fraud, cyber-attacks, network and communication failures, as well as identity theft and phishing attacks related to crypto-assets.

$CNIRYY -China CPI (May/2025)ECONOMICS:CNIRYY
May/2025
source: National Bureau of Statistics of China
- China's consumer prices dropped by 0.1% yoy in May 2025, matching the declines seen in the previous two months and slightly outperforming expectations of a 0.2% decrease.
This was the fourth straight month of consumer deflation, highlighting challenges from ongoing trade risks with the US, sluggish domestic demand, and concerns over job stability. Non-food prices were flat for the second month in a row, as increases in housing (0.1% vs 0.1% in April), clothing (1.5% vs. 1.3%), healthcare (0.3% vs 0.2%), and education (0.9% vs 0.7%) were offset by a sharper drop in transport (-4.3% vs -3.9%).
On the food side, prices fell at a steeper rate (-0.4% vs -0.2%), down for the fourth month.
Core inflation, which excludes volatile food and fuel prices, rose 0.6%, marking the highest reading since January and following a 0.5% gain in the prior two months.
On a monthly basis, the CPI declined by 0.2% in May, reversing a 0.1% gain in April and indicating the third monthly drop so far this year.

$EUINTR - Interest Rates Cut (June/2025)ECONOMICS:EUINTR
(June/2025)
source: European Central Bank
- The ECB cut key interest rates by 25 bps at its June meeting,
based on updated inflation and economic forecasts.
Inflation is near the 2% target, with projections showing 2.0% in 2025 (vs 2.3% previously), 1.6% in 2026 (vs 1.9% previously), and 2.0% in 2027.
Core inflation (excluding energy and food) is seen at 2.4% in 2025, then easing to 1.9% in 2026–2027.
GDP growth is forecast at 0.9% in 2025, 1.1% in 2026 (vs 1.2% previously), and 1.3% in 2027, supported by higher real incomes, strong labour markets, and rising government investment, despite trade policy uncertainties weighing on exports and business investment.
Scenario analysis shows trade tensions could reduce growth and inflation, while resolution could boost both.
Wage growth is still high but slowing, and corporate profits are helping absorb cost pressures.
President Lagarde said that the central bank is approaching the end of a cycle, suggesting a pause may be on the horizon following today’s reduction.

$EUIRYY - Europe CPI below 2% Target (May/2025)ECONOMICS:EUIRYY 1.9%
May/2025
source: EUROSTAT
- Eurozone CPI eased to 1.9% year-on-year in May 2025,
down from 2.2% in April and below market expectations of 2.0%.
This marks the first time inflation has fallen below the European Central Bank’s 2.0% target since September 2024, reinforcing expectations for a 25 basis point rate cut later this week and raising the possibility of additional cuts.
A key driver of the deceleration was a sharp slowdown in services inflation, which dropped to 3.2% from 4.0% in April, its lowest level since March 2022.
Energy prices continued to decline, falling by 3.6% year-on-year, while inflation for non-energy industrial goods held steady at 0.6%.
In contrast, prices for food, alcohol, and tobacco accelerated, rising 3.3% compared with 3.0% the previous month.
Meanwhile, core inflation, which excludes volatile food and energy components, slipped to 2.3%, the lowest reading since January 2022. source: EUROSTAT

$USPCEPIMC -U.S Core PCE (April/2025)ECONOMICS:USPCEPIMC
April/2025
source: U.S. Bureau of Economic Analysis
-The core PCE price index in the US, which excludes volatile and energy prices and is Federal Reserve's chosen gauge of underlying inflation in the US economy,
went up 0.1% from the previous month in April of 2025.
The result was in line with market expectations.
From the previous year, the index rose by 2.5% to slow from the 2.7% jump from March, the softest increase since March of 2021.

Japan core inflation hits two-year high, yen gains groundThe yen is higher on Friday. Iin the European session, USD/JPY is trading at 143.63, down 0.37% on the day.
Tokyo core CPI climbed to 3.6% y/y in May, up from 3.4% in April and above the market estimate of 3.5%. This marked the highest level since Jan. 2025. Tokyo core inflation is viewed as the leading indicator of nationwide inflation trends and is closely monitored by the Bank of Japan. Tokyo core CPI, which excludes fresh food, was driven higher due to due higher non-fresh food prices, particularly rice which has soared 93% over the past year.
The jump in core CPI bolsters the case for a BoJ rate hike. The markets had anticipated a rate hike in October but today's strong inflation report could accelerate the timing of the next rate hike. At the same time, the uncertainty caused by US trade policy may force the BoJ to delay any rate hikes until the impact of US tariffs on Japan's economy becomes clearer.
US President Trump's controversial tariffs have sent the financial markets on wild swings. Now, US courts are weighing in on whether Trump exceeded his authority when he imposed the tariffs. A trade court panel ruled this week that most of the tariffs were illegal but on Thursday, an appeals court granted the Trump administration a temporary pause, keeping the tariffs in effect.
The legal fight over the tariffs has just begun and could go all the way to the US Supreme Court. In the meantime, the legal challenge has blown a hole in Trump's tariff policy and is causing even more uncertainty in the financial markets.

Australian inflation higher than expected, Aussie extends lossesThe Australian dollar has extended its losses on Wednesday. AUD/USD is trading at 0.6415 in the North American session, down 0.44% on the day.
Australia's inflation rate remained unchanged in April at 2.4% y/y for a third straight month, matching the lowest rate since Nov. 2024. The reading was slightly higher than the market estimate of 2.3% but remained within the central bank's inflation target of 2%-3%. Trimmed mean inflation, the central bank's preferred indicator for underlying inflation, edged up to 2.8% from 2.7% in March.
The inflation report was mildly disappointing in that inflation was hotter than expected. Underlying inflation has proven to be persistent which could see the Reserve Bank of Australia delay any rate cuts.
The markets have responded by lowering the probability of a rate cut in July to 62%, compared to 78% a day ago, according to the ASX RBA rate tracker. A key factor in the July decision will be the second-quarter inflation report in late July, ahead of the August meeting.
The Reserve Bank lowered rates last week by a quarter-point to 3.85%, a two-year low. The central bank left the door open to further cuts, as global trade uncertainties are expected to lower domestic growth and inflation.
The Federal Reserve releases the minutes of its May 7 meeting later today. At the meeting, the Fed stressed that it wasn't planning to lower rates anytime soon and the minutes are expected to confirm the Fed's wait-and-see stance.
US President Trump has been zig-zagging on trade policy, imposing and then cancelling tariffs on China and the European Union. Fed Chair Powell said at the May meeting that the economic uncertainty due to tariffs means that the appropriate rate path is unclear and that message could be reiterated in the Fed minutes.

RBA Could Still Cut Despite Higher AU CPI: AU paid in focusToday I take a quick look at Australia's inflation figures and outline why I think the RBA could still cut in July, before moving on to charts for AUD/USD, AUD/NZD, EUR/AUD and AUD/JPY.
Matt Simpson, Market Analyst at City Index and Forex.com

New Zealand dollar sharply lower, RBNZ cut expectedThe New Zealand dollar is sharply lower on Tuesday. In the North American session, NZD/USD is trading at 0.5950, down 0.83% on the day. A day earlier, the New Zealand dollar touched a high of 0.6031, its highest level since Oct. 2024.
The Reserve Bank of New Zealand is widely expected to lower rates by a quarter-point to 3.25% on Wednesday. With little doubt about the decision, investors will be focusing on the Reserve Bank's updated forecasts. The markets are looking at another rate cut in July and perhaps one more later in the year, which would lower the cash rate below 3.0%.
The RBNZ has been dealing with a weak domestic economy and a deteriorating outlook for the global economy due to US President Trump's erratic tariff policy. The RBNZ would like to continue trimming rates and restore consumer and business confidence.
New Zealand's inflation was higher than expected in the first quarter at 2.5%, up from 2.2% in Q4 2024. This is within the Bank's inflation target of 1%-3% and means that inflation levels won't prevent the Bank from lowering rates on Wednesday.
US durable goods orders plunges, consumer confidence surges
In the US, Durable Goods Orders declined by 6.3% m/m in April, after a 7.5% gain in March, which was the fastest pace of growth since July 2020. The soft reading managed to beat the market estimate of -7.8%. The Conference Board Consumer Confidence index, which has fallen steadily this year, surged to 98.0 in May, up from 86.0 in April and blowing past the market estimate of 87.0.
We'll hear from more Federal Reserve members on Wednesday, which could provide some insights into the Fed's rate path. The Fed has adopted a wait-and-see stance and is widely expected to hold rates for a fourth straight time at the next meeting on June 18.
NZD/USD has pushed below support at 0.5978 and is testing 0.5955. Below, there is support at 0.5928
There is resistance at 0.6005 and 0.6028

Steepening Yields & Uncertainty: What says the Bond Markets?
CBOT:ZN1!
US Yield Curve in Image Above
Showing yields on May 27, 2024 vs May 27, 2025 . What happened in a year and how to understand this?
Looking at the image above, the yield curve was inverted on this day last year. Comparing last year’s term structure to today’s, we can see that the yield curve has steepened sharply.
What does this signify? Let’s dive deeper as we share our insights and assessment of what the bond market is doing.
At the March 16, 2022, meeting, the FED finally pivoted away from their "transitory inflation" narrative to a significant supply shocks narrative—supply-demand imbalances and Russia-Ukraine war-related uncertainty. This started a rate hike cycle, with rates peaking at 5.25%–5.50% in the July 26, 2023, meeting.
The Fed Funds rate was reduced by 100 bps, with a cut of 50 bps on September 18, 2024, and two cuts of 25 bps in the November and December 2024 meetings. The FED paused its rate cutting at the start of the year, citing—as we have all heard recently—that the inflation outlook remains tilted to the upside, and given policy uncertainty and trade tariffs, the risk to slowing growth continues to increase. Businesses are holding back spending due to this confusion and continued uncertainty. ** Refer to the image of FED rate path above.
The start of the rate hike cycle also began the FED’s balance sheet reduction program—from a peak of $8.97 trillion to the current balance of $6.69 trillion. **Refer to the image of FED's balance sheet above.
Rates remained elevated at these levels to bring down inflation, which peaked at 9.1% in June 2022. Inflation has currently eased to 2.3% as of April 2025. Refer to the CPI YoY image above.
Ray Dalio, Jamie Dimon, and most recently non-voter Kashkari (FED) highlighted stagflationary risks. FED Chair Powell noted risks to both sides of its dual mandate in its most recent meeting March 19, 2025.
In the March meeting, they also announced a slower pace of reducing Treasury securities, agency debt, and agency mortgage-backed securities. In this announcement, Treasury securities reduction slowed from $25 billion to $5 billion per month, while maintaining agency debt and agency mortgage-backed securities reduction at the same pace.
Many participants and analysts noted this as a dovish pivot. However, given the current market conditions and the supply-demand imbalance emerging within US Treasury and bond markets, we note the rising yields.
The yield curve steepening signifies that investors want better return on their bond holdings. The interesting turn of events here is that US Treasuries and bonds have not provided the safety they usually do in times of uncertainty and policy risk. The dollar has fallen in tandem with bonds, resulting in a devalued dollar and rising yields. Thirty-year yields touched the 5% level, and the DXY index traded at levels last seen in March 2022.
Looking deeper under the hood, we note that a repeat of COVID-pandemic-style stimulus measures may perhaps result in an uncontrollable inflation spiral. The ballooning twin deficits—i.e., trade and budget deficits—with the new “Big Beautiful Bill,” or as some analysts joked, noting this as a foreshadowing of the newest credit rating: “BBB.”
Any black swan event may just be the catalyst needed to tip these dominoes to start falling.
As we previously noted in some of our commentary, debt service payments are now more than defense spending.
The new bill, once passed, is going to add another $2.5 trillion to the deficit. While the deficit is an issue in the US, it is important to note that it is a global issue.
The key question here will be: in due time, will the US bond market and US dollar regain their usual haven status? Or will we continue seeing diversification into Gold, Bitcoin, and global markets?
So, to summarize these mechanics playing out in the US and global markets—in our view—sure, the US administration, one may debate, is not helping by creating this environment of uncertainty in global trade, coupled with a worsening deficit and higher-for-longer rates. The markets currently are perhaps at their most unpredictable stage, with so much going on in the US and across the world.
It is still too early to write off US exceptionalism, and there will be value in rotating back to US markets once the dust on policy uncertainty settles. We suggest that investors stay diversified, watch for any upside surprises to the inflation and do not chase yields blindly as the move may already be overstretched. It is also our view that we are past the extreme policy uncertainty having already noted Trump put when ES Futures fell over 20%.
Although note that near All-time highs or at 6000 level, we are likely to see further headline risks until trade deals are locked in. As always, be nimble, pragmatic and be ready to adjust with evolving market conditions.
Definitions
Plain-language definition: A “basis point” (bps) is 0.01%. So, a 50 bps cut = 0.50% reduction in interest rates.
Plain-language definition: A steep yield curve means long-term interest rates are much higher than short-term ones. This can reflect rising inflation expectations or increased risk.
A “black swan event”—an unpredictable crisis—could set off a chain reaction if confidence in US finances weakens further.
Trade deficit: Importing more than exports
Budget deficit: Government spending far more than it earns

$JPIRYY -Japan's CPI (April/2025)ECONOMICS:JPIRYY 3.6%
April/2025
source: Ministry of Internal Affairs & Communications
- Japan's annual inflation rate stood at 3.6% in April 2025,
unchanged from March while remaining at its lowest print since December.
Food prices rose the least in four months (6.5% vs 7.4% in March) even as rice costs jumped 94.8% y-o-y, hitting a new record for the 7th straight month due to poor harvests and rising demand from record tourist numbers.
Price growth also eased for clothing (2.7% vs 3.0%) and household items (4.1% vs 4.5%).
Cost of education fell much steeper (-5.6% vs -1.2%).
In contrast, inflation was stable for transport (at 2.7%) while accelerating for housing (1.0% vs 0.8%), healthcare (2.2% vs 2.0%), recreation (2.7% vs 2.0%), communications (1.1% vs 1.0%), and miscellaneous items (1.3% vs 1.1%).
Prices of electricity (13.5% vs 8.7% ) and gas (4.4% vs 2.4%) rose the most in three months, as the impact of government subsidies faded.
Core inflation climbed to an over 2-year high of 3.5% from 3.2% in March.
Monthly, the CPI rose 0.1%, easing from a 0.3% gain in March.

British Pound resumes rally as retail sales jumpThe British pound has posted gains on Friday. In the European session, GBP/USD is trading at 1.3484, up 0.49% on the day. The pound has gained 1.5% this week and is trading at levels not seen since Feb. 2022.
The markets were expecting a banner reading from April retail sales but the actual numbers crushed the forecast. Annual retail sales surged 5%, up from a downwardly revised 1.9% and above the market estimate of 4.5%. This marked the fastest pace of growth since Feb. 2022.
Monthly, retail sales climbed 1.2%, up from a downwardly revised 0.3% in March and blowing past the market estimate of 0.2%. The surge was driven by sharp gains in food store sales and department stores, as favorable weather brought out consumers.
The UK economy has been struggling and strong consumer spending has been a bright spot. Monthly retail sales have now increased for four straight months, which last occurred in 2020.
The UK consumer spending more and is showing more optimism. The GfK consumer confidence index for May improved to -20 from -23 and beat the market estimate of -22. The improvement is likely a result of the de-escalation in global trade tensions as well as the Bank of England rate cut in early May.
The impressive retail sales report, together with higher-than-expected inflation in April will raise expectations for the BoE to hold rates at its next meeting on June 18.
There are no key US releases today but we'll hear from three FOMC members. There has been plenty of Fedspeak this week, with a message that the US tariffs will take a toll on the US economy, even with the temporary deal with China, and that the Fed favors a wait-and-see stance before further rate cuts.
GBP/USD has broken above several resistance lines and is putting pressure in resistance at 1.3493.
There is support at 1.3393 and 1.3367

Will Middle East Tensions Ignite a Global Oil Crisis?The global oil market faces significant turbulence amidst reports of potential Israeli military action against Iran's nuclear facilities. This looming threat has triggered a notable surge in oil prices, reflecting deep market anxieties. The primary concern stems from the potential for severe disruption to Iran's oil output, a critical component of global supply. More critically, an escalation risks Iranian retaliation, including a possible blockade of the Strait of Hormuz, a vital maritime chokepoint through which a substantial portion of the world's oil transits. Such an event would precipitate an unprecedented supply shock, echoing historical price spikes seen during past Middle Eastern crises.
Iran currently produces around 3.2 million barrels per day and holds strategic importance beyond its direct volume. Its oil exports, primarily to China, serve as an economic lifeline, making any disruption profoundly impactful. A full-scale conflict would unleash a cascade of economic consequences: extreme oil price surges would fuel global inflation, potentially pushing economies into recession. While some spare capacity exists, a prolonged disruption or a Hormuz blockade would render it insufficient. Oil-importing nations, particularly vulnerable developing economies, would face severe economic strain, while major oil exporters, including Saudi Arabia, the US, and Russia, would see substantial financial gains.
Beyond economics, a conflict would fundamentally destabilize the geopolitical landscape of the Middle East, unraveling diplomatic efforts and exacerbating regional tensions. Geostrategically, the focus would intensify on safeguarding critical maritime routes, highlighting the inherent vulnerabilities of global energy supply chains. Macroeconomically, central banks would confront the difficult task of managing inflation without stifling growth, leading to a surge in safe-haven assets. The current climate underscores the profound fragility of global energy markets, where geopolitical developments in a volatile region can have immediate and far-reaching global repercussions.

Pound steady as UK inflation surgesThe British pound posted gains earlier but has failed to consolidate. In the European session, GBP/USD is trading at 1.3395, up 0.03% on the day. The pound has gained 1.1% this week and earlier today rose as high as 1.3468, its highest level since Feb. 2022.
UK inflation jumped to 3.5% y/y in April, up sharply from 2.6% in March and above the market estimate of 3.3%. This was the highest annual inflation rate since Jan. 2024 and was driven by higher prices for transport, housing and energy. Monthly, inflation soared to 1.2%, up from 0.3% and above the market estimate of 1.1%.
The news wasn't much better from core CPI, which rose to 3.8% from 3.4% and was higher than the market estimate of 3.6%. This was the highest reading since April 2024. Monthly, the core rate jumped to 1.4%, up from 0.5% and above the market estimate of 1.2%.
The rise in inflation can be partially attributed to the increase in the energy price cap and the Easter holidays, but is a disappointment for the government and for the Bank of England, as inflation had been trending lower.
The BoE will be concerned by the rise in core inflation, which will complicate plans to further reduce rates. The BoE trimmed the cash rate by a quarter-point earlier this month by 0.25%, but rates are still higher than other major central banks, with the exception of the Federal Reserve.
The Federal Reserve is taking a wait-and-see attitude before it lowers rates again, especially with the uncertainty swirling around US tariff policy. Atlanta Fed President Raphael Bostic said this week that even reduced tariffs would be "definitely economically significant" and said he favored one rate cut this year.

$GBIRYY - U.K Inflation Rate Accelerates (April/2025)ECONOMICS:GBIRYY
April/2025
source: Office for National Statistics
- The annual inflation rate in the UK jumped to 3.5% in April, the highest since January 2024, from 2.6% in March and above forecasts of 3.3%.
The main upward pressure came from higher electricity and gas prices after the Ofgem price cap increase, while new Vehicle Excise Duty on electric cars lifted transport costs, and food inflation also picked up.
Meanwhile, core inflation accelerated to 3.8%, the highest in a year.

Canada's inflation eases, Canadian dollar edges lowerThe Canadian dollar continues to have a quiet week. In the North American session, USD/CAD is trading at 1.3920, down 0.21% on the day.
Canada released the April inflation report, which indicated that headline and core inflation were moving in opposite directions. Headline CPI dropped sharply to 1.7% y/y, down from 2.3% but shy of the market estimate of 1.6%. This was the lowest annual inflation rate in seven months. The sharp drop was driven by the end of the consumer carbon tax, with gasoline prices dropping 18% lower compared to April 2024.
Core inflation accelerated in April, with two key indicators rising to an average of 3.15%, compared to 2.85% in March. This was above the market estimate of 2.9%.
The money markets have responded to the inflation data, lowering the probability of a rate cut at the June 4 meeting to 48%, down from 65% prior to the inflation release.
The Bank of Canada has been aggressive in its easing cycle, trimming rates seven straight times from June 2024 until April, when it held rates. The cash rate is currently at 2.75% but the BoC is hesitant to lower in the midst of the uncertainty over the US trade tariffs, which have led to sharp swings in the stock markets.
There are no US events on the calendar and the markets will be all ears as a host of FOMC members make public statements today. Investors will be looking for insights into the Fed's rate path. The Fed is widely expected to hold rates in June and may cut as little as twice in the second half of the year. That could change, depending on inflation, the US labor market and Trump's tariffs.
USD/CAD is testing support at 1.3936. Below, there is support at 1.3911
There is resistance at 1.3952 and 1.3977

We are watching USDCAD today and on ThursdayCanadian CPIs and PPIs are coming out on Tuesday and Thursday respectively.
Let's dig into the numbers.
FX_IDC:USDCAD
MARKETSCOM:USDCAD
Let us know what you think in the comments below.
Thank you.
77.3% of retail investor accounts lose money when trading CFDs with this provider. You should consider whether you understand how CFDs work and whether you can afford to take the high risk of losing your money. Past performance is not necessarily indicative of future results. The value of investments may fall as well as rise and the investor may not get back the amount initially invested. This content is not intended for nor applicable to residents of the UK. Cryptocurrency CFDs and spread bets are restricted in the UK for all retail clients.
