German inflation higher than expected, Euro dipsThe euro is calm on Wednesday. In the North American session, EUR/USD is trading at 1.1334, down 0.45% on the day.
Germany's inflation rate dropped to 2.1% y/y in April, down from 2.2% in March but above the market estimate of 2.0%. This was the lowest level in seven months, largely driven by lower energy prices. The more significant story was that core CPI, which excludes energy and food and is a more reliable indicator of inflation trends, rose to 2.9% from 2.6%. This will be of concern to policymakers at the European Central Bank, as will the increase in services inflation.
The ECB has to balance the new environment of US tariffs and counter-tariffs against the US, which will raise inflation, along with the strong rise in the euro and fiscal stimulus which will boost upward inflationary pressures. The ECB will be keeping a close look at Friday's eurozone inflation report, which is expected to follow the German numbers. Headline CPI is projected to drop to 2.1% from 2.2%, while the core rate is expected to rise to 2.5% from 2.4%.
The central bank would prefer to continue delivering gradual rate cuts in order to boost anemic growth, but this will be contingent on inflation remaining contained.
The markets were braced for soft US numbers but the data was worse than expected. ADP employment change declined to 62 thousand, down from a revised 147 thousand and below the market estimate of 115 thousand.
This was followed by first-estimate GDP for Q1, which declined by 0.3% q/q, down sharply from 2.4% in Q4 and lower than the market estimate of 0.3%. This marked the first quarterly decline in the economy since Q1 2022. The weak GDP reading was driven by a surge in imports ahead of US tariffs taking effect and a drop in consumer spending.
Inflation

Australian core CPI falls within the RBA target, Aussie shrugsThe Australian dollar has been showing strong movement this week but is calm on Wednesday. In the European session, AUD/USD is trading at 0.6391, up 0.14% on the day.
Australia released the CPI report for the first quarter. The Australian dollar didn't show much reaction, but the data could point to another rate cut from the Reserve Bank of Australia.
Headline CPI remained unchanged at 2.4% y/y, just above the market estimate of 2.3%. The significant news was that RBA Trimmed Mean CPI, the key core inflation indicator, dropped to 2.9% y/y from a revised 3.3% gain in Q4 2024. This is the first time in three years that core CPI is back within the RBA's target band of between 1-3%.
The drop in core inflation is good news for the government, with the national election on Saturday. Australian Treasurer Jim Chalmers jumped on the news, stating that the market expects four or five rate additional rate cuts this year, which would save households with mortgages "hundreds of dollars".
The Reserve Bank is expected to lower rates at its next meeting on May 20, which would mark only the second rate cut this year. After cutting rates in February, the central bank has stayed on the sidelines as US President Trump's tariffs have escalated trade tensions and sent the financial markets on a roller-coaster ride.
In the US, the markets are bracing for some weak data later today. ADP employment is expected to slip to 108 thousand, compared to 155 thousand in the previous release. ADP is not considered a reliable gauge for Friday's nonfarm payrolls, but a weak reading will only increase the anxiety of the nervous markets. US first-estimate GDP for Q1 is expected to slide to just 0.4% q/q, after a 2.4% gain in Q3. If there is a surprise reading from GDP, we could see a strong reaction from the US dollar after the release.
AUD/USD is testing resistance at 0.6403. Above, there is resistance at 0.6431
0.6357 and 0.6329 are the next support levels

Navigating Trump Tariffs on the Dow JonesNavigating the movements of the **US30 (Dow Jones Industrial Average)** can be challenging, especially amid shifting economic policies. The Dow, which tracks 30 major U.S. companies, is highly sensitive to trade policies, corporate earnings, and geopolitical risks. Trump’s plan to impose **10% across-the-board tariffs** and **60%+ tariffs on Chinese goods** has sparked concerns about inflation, supply chain disruptions, and retaliatory trade measures. Investors are closely watching how these policies could impact multinational companies within the index, particularly those reliant on global trade, such as **Boeing, Apple, and Caterpillar**.
For everyday Americans, higher tariffs could mean **rising prices on imported goods**, from electronics to household items, worsening inflation. While tariffs aim to protect domestic industries, they often lead to **higher production costs** for businesses that rely on foreign materials, potentially triggering job cuts or reduced consumer spending. The stock market’s reaction—volatility in the US30—reflects these uncertainties, as investors weigh the risks of slower growth against potential benefits for U.S. manufacturers.
Traders navigating the US30 must monitor **Fed policy, corporate earnings, and trade war developments**. If tariffs escalate, defensive stocks (utilities, healthcare) may outperform, while industrials and tech could face pressure. Long-term investors might see dips as buying opportunities, but short-term traders should prepare for turbulence. Ultimately, Trump’s tariff policies could reshape market dynamics, making adaptability key for those trading the Dow.

Yen extends gains, BOJ Core CPI lower than expectedThe Japanese yen has rallied for a third straight day. In the European session, USD/JPY is trading at 140.38, down 0.33% on the day. The yen has climbed 1.3% since Thursday, as the US dollar is under pressure against the major currencies.
BoJ Core CPI, a key inflation indicator, remained at 2.2% for a third consecutive month in March, shy of the forecast of 2.4%. This follows Japan's National Core CPI, which rose 3.2% y/y, matching expectations but higher than the 3.0% gain in February. National CPI eased to 3.6%, down from 3.7% in February and below the market estimate of 3.7%.
The inflation data comes a week before the BoJ's policy meeting next week. The central bank has signaled that it will continue to raise interest rates as wages and inflation have been rising. However, the risks to inflation and growth from US tariffs have muddied the rate outlook and the BoJ may decide to push off another hike until later in the year.
The finance ministers of Japan and the US will meet later this week, as Tokyo looks to carve out some tariff exemptions. The BoJ is likely to sit tight and see if the talks lead to a breakthrough. The US is expected to bring up the exchange rate, as President Trump has accused Japan of deliberately keeping the yen weak in order to protect its export sector.
There are no key releases out of the US today, but we'll hear from three FOMC members later today. The markets have priced in a rate cut in May at 10%, with a 62% probability of a rate cut in June.

Interest Rates don't seem to want to slow downWe believed that interest rates were going higher in Early April/Late March.
The Bullish Engulfing formation was a sign that higher interest rates were coming TVC:TNX
The 10 Yr Yield Downtrend was broken, it retraced some, we posted that it was likely consolidating, & seems to want to go a little higher.
Central Banks worldwide are lowering rates while the US is raising them.
---
Please see our profile for more info... We do post a lot.

$GBIRYY - U.K CPI (March/2025)ECONOMICS:GBIRYY 2.6%
March/2025
source: Office for National Statistics
- The annual inflation rate in the UK slowed to 2.6% in March 2025 from 2.8% in February and below market and the BoE's forecasts of 2.7%.
The largest downward contributions came from recreation and culture (2.4% vs 3.4%), mainly games, toys and hobbies (-4.2%) and data processing equipment (-5.1%). Transport also contributed to the slowdown (1.2% vs 1.8%), largely due to a 5.3% fall in motor fuel prices.
In addition, prices rose less for restaurants and hotels (3%, the lowest since July 2021 vs 3.4%), mostly accommodation services (-0.6%); housing and utilities (1.8% vs 1.9%); and food and non-alcoholic beverages (3% vs 3.3%).
In contrast, the most significant upward contribution came from clothing and footwear (1.1% vs -0.6%), with prices usually rising in March as spring fashions continue to enter the shops.
Compared to the previous month, the CPI edged up 0.3%, slightly below both the previous month’s increase and expectations of 0.4%.
Annual core inflation slowed to 3.4% from 3.5%.

After CAN CPIs, it's time to prepare for BoC rate decisionLooking at the CPI numbers that came out, we are noticing some weakness in the CAD right now. This weakness may spill over into tomorrow's trading, as the BoC is expected to keep the rates unchaged.
Let's dig in!
FX_IDC:USDCAD
MARKETSCOM:USDCAD
Let us know what you think in the comments below.
Thank you.
77.3% of retail investor accounts lose money when trading CFDs with this provider. You should consider whether you understand how CFDs work and whether you can afford to take the high risk of losing your money. Past performance is not necessarily indicative of future results. The value of investments may fall as well as rise and the investor may not get back the amount initially invested. This content is not intended for nor applicable to residents of the UK. Cryptocurrency CFDs and spread bets are restricted in the UK for all retail clients.

Will Coffee Remain an Affordable Luxury?Global coffee prices are experiencing a significant upswing, driven primarily by severe supply constraints in the world's major coffee-producing regions. Adverse weather conditions, notably drought and inconsistent rainfall linked to climate change, have crippled production capacity in Brazil (the largest arabica producer) and Vietnam (the largest robusta producer). Consequently, crop yield forecasts are being revised downwards, export volumes are shrinking, and concerns over future harvests are mounting, putting direct upward pressure on both arabica and robusta bean prices worldwide.
Adding complexity to the situation are fluctuating market dynamics and conflicting future outlooks. While recent robusta inventories have tightened, arabica stocks saw a temporary rise, sending mixed signals. Export data is similarly inconsistent, and market forecasts diverge significantly – some analysts predict deepening deficits and historically low stocks, particularly for Arabica, while others project widening surpluses. Geopolitical factors, including trade tensions and tariffs, further cloud the picture, impacting costs and potentially dampening consumer demand.
These converging pressures translate directly into higher operational expenses for businesses across the coffee value chain. Roasters face doubled green bean costs, forcing cafes to increase consumer prices for beverages to maintain viability amidst already thin margins. This sustained cost increase is impacting consumer behaviour, potentially shifting preferences towards lower-quality coffee, and diminishing the price premiums previously enjoyed by specialty coffee growers. The industry faces significant uncertainty, grappling with the possibility that these elevated price levels may represent a new, challenging norm rather than a temporary spike.

End of the US Dollar ****** end of INFLATED USD
Deflation is coming.
Food for thought.
Because THE CYCLES EXIST and THEY RHYME.

'Inflation is transitory' by FEDFED did that. And it was not elaborate lie. They made money on it. What is next ?

Long due Precipitous Drop in DXY is Making Gold Unstoppable? DXY tanking has gold making a higher high after a 20 week intermediate cycle. Is this a false breakout or the next leg up?

$USIRYY -United States CPI (March/2025)ECONOMICS:USIRYY
(March/2025)
source: U.S. Bureau of Labor Statistics
- The annual inflation rate in the US eased for a second consecutive month to 2.4% in March 2025, the lowest since September, down from 2.8% in February, and below forecasts of 2.6%.
Prices for gasoline (-9.8% vs -3.1%) and fuel oil (-7.6% vs -5.1%) fell more while natural gas prices soared (9.4% vs 6%).
Inflation also slowed for shelter (4% vs 4.2%), used cars and trucks (0.6% vs 0.8%), and transportation (3.1% vs 6%) while prices were unchanged for new vehicles (vs -0.3%).
On the other hand, inflation accelerated for food (3% vs 2.6%).
Compared to the previous month, the CPI decreased 0.1%, the first fall since May 2020, compared to expectations of a 0.1% gain.
The index for energy fell 2.4%, as a 6.3% decline in gasoline more than offset increases in electricity (0.9%) and natural gas (3.6%).
Meanwhile, annual core inflation eased to 2.8%, the lowest since March 2021, and below forecasts of 3%.
On a monthly basis, the core CPI edged up 0.1%, below expectations of 0.3%.

$CNIRYY -China's CPI (March/2025)ECONOMICS:CNIRYY
March/2025
source: National Bureau of Statistics of China
- China's consumer prices fell by 0.1% year-on-year in March 2025, missing market expectations of a 0.1% increase and marking the second consecutive month of drop, as the ongoing trade dispute with the U.S. threatens to exert further downward pressure on prices.
Still, the latest drop was significantly milder than February’s 0.7% fall, supported by a smaller decline in food prices as pork prices accelerated and fresh fruit costs rebounded.
Meanwhile, non-food prices rose by 0.2%, reversing a slight dip of 0.1% in February, driven by increases in housing (0.1% vs 0.1%), healthcare (0.1% vs 0.2%), and education (0.8% vs -0.5%), despite a continued decline in transport costs (-2.6% vs -2.5%).
Core inflation, which excludes volatile food and fuel prices, rose 0.5% in March, rebounding from a 0.1% decrease in February. On a monthly basis, the CPI declined by 0.4%, a steeper fall than a 0.2% drop in February, marking the second straight month of contraction.

Navigating the Correction using SPX, Platinum, and DXYLikely levels that all sectors tend to bottom at using Fibonacci retracement, measuring likely degrees of magnitude on falling knife bounces, as well as determining the PM sector bottom via platinum price, and looking at ratios.

$EUIRYY -Europe CPI (March/2025)ECONOMICS:EUIRYY
March/2025
source: EUROSTAT
- Annual inflation in the Euro Area eased to 2.2% in March 2025,
the lowest rate since November 2024 and slightly below market expectations of 2.3%.
Services inflation slowed to a 33-month low (3.4% vs. 3.7% in February),
while energy costs declined (-0.7% vs. 0.2%).
However, inflation remained steady for both non-energy industrial goods (0.6%) and processed food, alcohol & tobacco (2.6%), and unprocessed food prices surged (4.1% vs. 3.0%).
Meanwhile, core inflation, which excludes volatile food and energy prices, fell to 2.4%, slightly below market forecasts of 2.5% and marking its lowest level since January 2022.
On a monthly basis, consumer prices rose 0.6% in March, following a 0.4% advance in February.

FedEx: Balancing Act or Precarious Gamble?Recent market activity highlights significant pressure on FedEx, as the logistics giant grapples with prevailing economic uncertainty. A notable drop in its stock price followed the company's decision to lower its revenue and profit outlook for fiscal year 2025. Management attributes this revision to weakening shipping demand, particularly in the crucial business-to-business sector, stemming from softness in the US industrial economy and persistent inflationary pressures. This development reflects broader economic concerns that are also impacting consumer spending and prompting caution across the corporate landscape.
In response to these domestic headwinds, FedEx has adopted a more conservative operational stance, evidenced by a reduced planned capital spending for the upcoming fiscal year. This move signals an emphasis on cost management and efficiency as the company navigates the current economic climate within its established markets. It suggests a strategic adjustment to align spending with the revised, more cautious revenue expectations.
However, this domestic caution contrasts sharply with FedEx's concurrent and ambitious expansion strategy in China. Despite geopolitical complexities, the company is making substantial investments to enlarge its footprint, building new operational centers, upgrading existing gateways, and increasing flight frequencies to enhance connectivity. This dual approach underscores the central challenge facing FedEx: balancing immediate economic pressures and operational adjustments at home while pursuing a long-term, high-stakes growth initiative in a critical international market, all within an uncertain global environment.

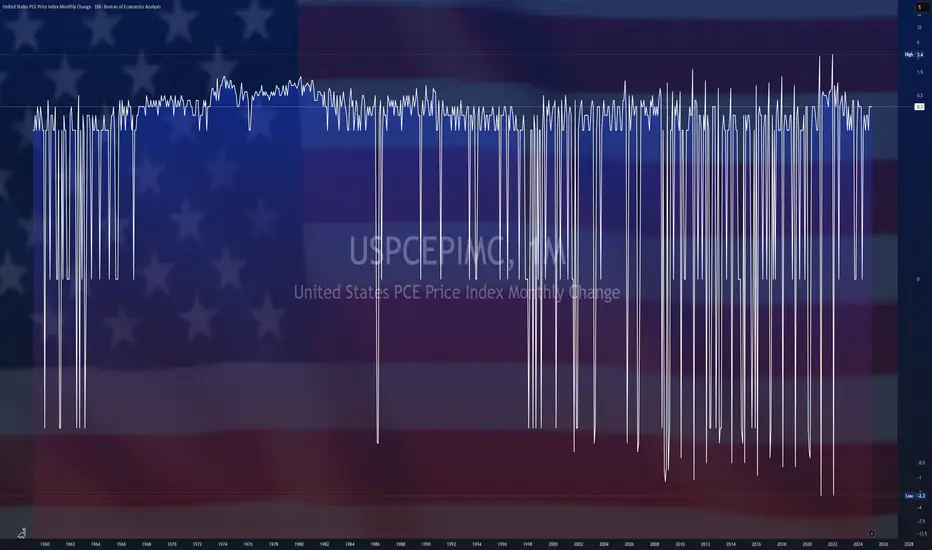
$USPCEPIMC -U.S Core PCE Inflation Rises More than ExpectedECONOMICS:USPCEPIMC
(February/2025)
source: U.S. Bureau of Economic Analysis
- The US PCE price index rose by 0.3% month-over-month in February, maintaining the same pace as the previous two months.
The core PCE index increased by 0.4%, the most since January 2024, surpassing the forecast of 0.3% and up from 0.3% in January.
On a year-over-year basis, headline PCE inflation remained steady at 2.5%, while core PCE inflation edged up to 2.8%, above the expected 2.7%.
GOLD 1H CHAR ROUTE MAP & TRADING PLAN FOR THE WEEKGOLD 1H Chart – 12th Feb 2025
Dear Traders,
Here’s the latest 1H chart analysis, outlining key levels and targets for the week.
Gold is currently trading between two critical levels, with a gap above 2905 and below 2883. A confirmed EMA5 crossover and lock above or below these levels will indicate the next price direction. Until then, expect price fluctuations as these levels are tested repeatedly.
Keep in mind that Inflation and CPI data are due today and tomorrow. While fundamental analysis plays a role in predicting gold's movement, our advanced technical analysis is essential for precise entry and exit points during these volatile geopolitical times.
Our strategy remains focused on buying dips and monitoring key levels to identify potential bounce opportunities. Stay sharp!
Resistance Levels: 2905, 2920, 2942, 2963, 2982, 3001, 3021, 3043
Support Levels: Gold Turn Levels : 2883, 2852, 2837, 2817,
Retracement Range: 2802 - 2817
Swing Range: 2747
EMA5 (Red Line) Analysis:
* Currently fluctuating between 2886 and 2905
* EMA5 positioning will be crucial in determining the next trading direction.
Bullish Targets:
EMA5 cross and lock Above 2905 → will open the following bullish Target 2920 ✅Done
EMA5 cross and lock Above 2920 → will open the following bullish Target 2942 ✅Done
EMA5 cross and lock Above 2942 → will open the following bullish Target 2963
EMA5 cross and lock Above 2963 → will open the following bullish Target 2982
EMA5 cross and lock Above 2982 → will open the following bullish Target 3001
EMA5 cross and lock Above 3001 → will open the following bullish Target 3021
EMA5 cross and lock Above 3021 → will open the following bullish Target 3043
Bearish Targets:
EMA5 cross and lock Below 2883 → will open the following bearish Target 2852
EMA5 cross and lock Below 2852 → will open the following bearish Target 2837
EMA5 cross and lock Below 2837 → will open the following bearish Target 2817
EMA5 cross and lock Below 2817 → will open the following bearish Target 2802 (Retracement Range)
EMA5 cross and lock Below 2802 → will open the following bearish Target 2747 (Swing Range)
Trading Plan:
* Stay bullish and buy pullbacks from key levels.
* Avoid chasing tops—focus on buying dips.
* Use smaller timeframes for entries at Goldturn levels.
* Aim for 30–40 pips per trade for optimal risk management.
* Each level can yield 20–40+ pips reversals.
Trade with confidence and discipline. Stay tuned for our daily updates! Please support us with likes, comments, and follows to keep these insights coming.
📉💰 The Quantum Trading Mastery

Copper's Grip: Stronger Than Oil's?Is the U.S. economy poised for a red metal revolution? The escalating demand for copper, fueled by the global transition to clean energy, the proliferation of electric vehicles, and the modernization of critical infrastructure, suggests a shifting economic landscape where copper's significance may soon eclipse oil. This vital metal, essential for everything from renewable power systems to advanced electronics, is becoming increasingly central to U.S. economic prosperity. Its unique properties and expanding applications in high-growth sectors position it as a linchpin for future development, potentially rendering it more crucial than traditional energy sources in the years to come. This sentiment is echoed by recent market activity, with copper prices hitting a new record high, reaching $5.3740 per lb. on the COMEX. This surge has widened the price gap between New York and London to approximately $1,700 a tonne, signaling strong U.S. demand.
However, this burgeoning importance faces a looming threat: the potential imposition of U.S. tariffs on copper imports. Framed under the guise of national security concerns, these tariffs could trigger significant economic repercussions. By increasing the cost of imported copper, a vital component for numerous domestic industries, tariffs risk inflating production costs, raising consumer prices, and straining international trade relationships. The anticipation of these tariffs has already caused market volatility, with major traders at a Financial Times commodities summit in Switzerland predicting copper could reach $12,000 a tonne this year. Kostas Bintas from Mercuria noted the current "tightness" in the copper market due to substantial imports heading to the U.S. in anticipation of tariffs, which some analysts expect sooner than previously anticipated.
Ultimately, the future trajectory of the U.S. economy will be heavily influenced by the availability and affordability of copper. Current market trends reveal surging prices driven by robust global demand and constrained supply, a situation that could be further exacerbated by trade barriers. Traders are also anticipating increased industrial demand as major economies like the U.S. and EU upgrade their electricity grids, further supporting the bullish outlook. Aline Carnizelo of Frontier Commodities is among the experts forecasting a $12,000 price target. However, Graeme Train from Trafigura cautioned that the global economy remains "a little fragile," highlighting potential risks to sustained high demand. As the world continues its march towards electrification and technological advancement, copper's role will only intensify. Whether the U.S. navigates this new era with policies that ensure a smooth and cost-effective supply of this essential metal or whether protectionist measures inadvertently hinder progress remains a critical question for the nation's economic future.

UK inflation cools more than expected, GBP/USD loses groundUK inflation for February rose 2.8% y/y, below the market esti mate of 2.9%. This was lower than the 3% gain in January. The main contribution to the drop in inflation was lower prices for clothing and housing. On a monthly basis, CPI rose 0.4%, up from 0.1% in January but lower than the market estimate of 0.5%. Core CPI also eased, falling from 3.7% to 3.5%.
The drop in inflation is good news, but the Bank of England remains concerned about the upside risk of inflation. Services inflation, which has been sticky, was unchanged at 5%.
The BoE will consider a rate cut at the next meeting in May, but will be monitoring the effects of increased employer taxes starting in April as well as today's Spring Statement.
At last week's meeting, the BoE expressed concern over worsening "global trade policy uncertainty" and pointedly mentioned US tariffs. The Trump administration's new trade policy has raised trade tensions and a global trade war would hurt growth and boost inflation.
The slight drop in inflation is also good news for Finance Minister Rachel Reeves, who is delivered the budget update earlier today. The update did not contain any further tax increases and announced deep spending cuts. Borrrowing a phrase from the Bank of England at last week's meeting, Reeves said "increased global uncertainty" had increased borrowing costs and led to economic instability.
GBP/USD has pushed below support at 1.2940. The next support level is 1.2864
There is resistance at 1.2940 and 1.2991

UK Inflation DeclinesUK Inflation Declines
Today, the latest UK Consumer Price Index (CPI) figures were released. According to ForexFactory:
The actual annual CPI came in at 2.8%,
Analysts had expected it to remain at the previous level of 3.0%.
As a result, the British pound weakened, and a slight spike in volatility was observed on the FTSE 100 stock index chart (UK 100 on FXOpen)
Technical Analysis of FTSE 100
In early March, bearish activity (indicated by an arrow) led to a break of the support level around 8757, which then acted as resistance.
However, as soon as bears pushed the price below the February low, bulls stepped in.
Currently, the UK stock index chart is forming a narrowing triangle, which can be interpreted as a sign of equilibrium between supply and demand. However, this pattern will eventually be broken.
It is possible that the release of significant news—such as developments in international trade tariffs—could disrupt the balance of supply and demand, triggering a trend movement for the FTSE 100 index (UK 100 on FXOpen).
This article represents the opinion of the Companies operating under the FXOpen brand only. It is not to be construed as an offer, solicitation, or recommendation with respect to products and services provided by the Companies operating under the FXOpen brand, nor is it to be considered financial advice.

Yen stabilizes after BoJ minutes hint at tighter policyThe Japanese yen has rebounded on Tuesday after sliding almost 1% a day earlier. In the European session, USD/JPY is trading at 150.11, down 0.39% on the day. The yen weakened to 150.94 in the Asian session, its lowest level since March 3.
The Bank of Japan raised rates at the January meeting for only the third time since the central bank started its tightening cycle in March 2024. At the meeting, the Bank raised rates by a quarter point to 0.5%, its highest level since the 2008 global financial crisis.
At the meeting, the BoJ revised upwards its inflation forecast as members have become more confident that rising wages will keep inflation sustainable close to the Bank's 2% target. The minutes noted that most members agreed that the likelihood of reaching the 2% target was rising.
The minutes reiterated that the BoJ plans to continue to tighten policy, provided that growth and inflation outlooks match the Bank's forecasts. The BoJ has telegraphed that it plans to continue rates but has left investors guessing about a timeline. The most likely dates for the next rate hike are June or July. The BoJ held rates last week, warning of uncertainty in the global outlook, particularly the impact of the new US administration's trade policy. The BoJ is keeping a close eye on the upside risk of inflation, due to the potential of a global trade war as well as rising wages.
Japan released BoJ core inflation, a key inflation indicator, earlier today. The February report came in at 2.2% y/y, unchanged from January and matching the forecast. BoJ core inflation remains at its highest level since March 2024.

$GBINTR - U.K Interest Rates (March/2025)ECONOMICS:GBINTR
March/2025
source: Bank of England
- The Bank of England voted 8-1 to keep the Bank Rate at 4.5% during its March meeting,
as policymakers adopted a wait-and-see approach amid stubbornly high inflation and global economic uncertainties. The bank highlighted that, given the medium-term inflation outlook, a gradual and cautious approach to further withdrawal of monetary policy restraint remains appropriate.
CPI inflation increased to 3.0% in January, and while global energy prices fell,
inflation is expected to rise to 3¾% by Q3 2025.
Also, the MPC noted that global trade policy uncertainties and geopolitical risks increased, with financial market volatility rising. source: Bank of England
