$QQQ - Where are we going now?NASDAQ:QQQ
A drop to $517 looks in the cards here and would be a good spot to bounce to keep the Symmetrical Pattern alive.
Further weakness would take us down to previous support at $510-$515.
Not financial advice
Inflation

My CPI/ Inflation PredictionECONOMICS:USCIR NASDAQ:QQQ AMEX:SPY AMEX:IWM
We are just 15 minutes away from some very important inflation data coming out.
Here is my prediction: 3.1 YoY CPI or Lower
- Double top to drop continues
- Had a small lower high form and deflect off the 9ema
- Curling over and pointed down again
- Bearish WCB is still thriving
- The trend is your friend and the trend says we are going to continue to fall lower
Not financial advice

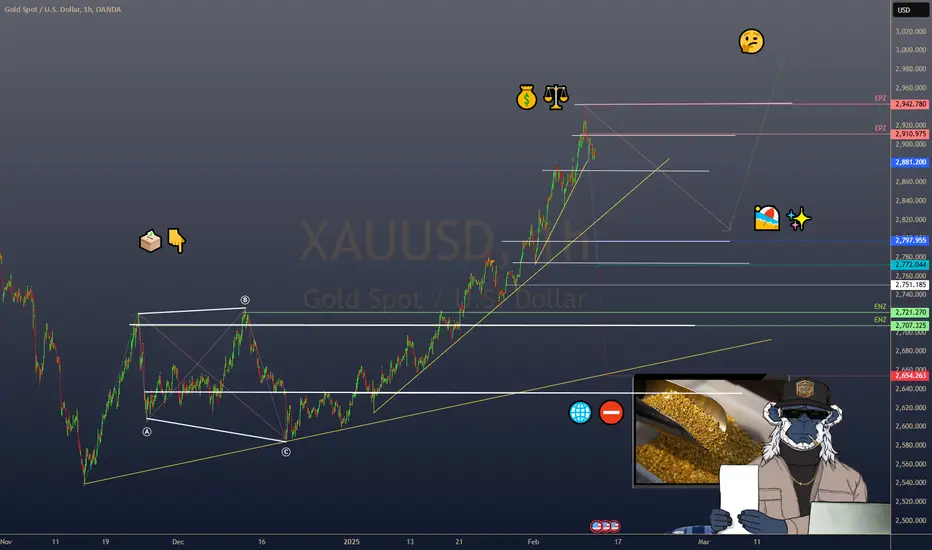
$GOLD EASES FROM RECORD HIGHS AHEAD OF U.S. INFLATION DATAGOLD EASES FROM RECORD HIGHS AHEAD OF U.S. INFLATION DATA
1/7
Gold hit a record high of $2,942.70/oz on Feb 11, fueled by safe-haven demand amid fresh U.S. tariffs. Today, it’s dipped 0.2% to $2,892.50 as investors take profits and watch U.S. inflation data. Let’s dig in! 💰⚖️
2/7 – RECENT PRICE ACTION
• All-time high at $2,942.70/oz—sparked by President Trump’s 25% tariffs on steel & aluminum
• Spot gold now at $2,892.50 (↓0.2%), with futures at $2,931.40 (↓0.1%)
• The rally’s paused—are we in for a short breather or a bigger correction? 🤔
3/7 – TARIFF TENSIONS
• 25% tariffs raise global trade war fears, boosting gold’s safe-haven appeal
• Markets worried about inflation, as import costs could climb
• Gold remains a hedge against economic uncertainty and currency devaluation 🌐⛔️
4/7 – MACROECONOMIC DRIVERS
• Fed Chair Powell’s hawkish comments on rate policy sent gold lower—higher rates often weigh on non-yielding assets
• U.S. inflation data (due soon) could shape the Fed’s next move—any upside surprise might strengthen the dollar, pressuring gold further
5/7 – INVESTOR SENTIMENT
• Profit-taking: After a massive run-up, traders might lock in gains
• Safe Haven: Still an underlying bullish sentiment if tariffs escalate
• The $2,900–$2,950 range is in focus—will gold consolidate or stage another breakout?
6/7 Where’s gold heading next?
1️⃣ Above $3,000—safe haven demand remains strong ✨
2️⃣ Sideways around $2,900—pausing for data 🏖️
3️⃣ Back under $2,850—hawkish Fed sinks gold ⬇️
Vote below! 🗳️👇
7/7 – STRATEGY WATCH
• Short-Term: Watch U.S. inflation data & dollar moves—gold typically moves opposite the greenback
• Long-Term: If tariffs stoke inflationary pressure, gold may shine even brighter. Keep an eye on geopolitical developments! 🌎
EURUSD Ahead of Inflation DataYesterday, EURUSD continued its upward movement, reaching 1,0381.
Later today, U.S. inflation data will be released.
This news has a significant impact and will determine the next move for the USD.
If the pair continues to rise, the target will be to break previous highs and reach 1,0568.
Be cautious of misleading price movements and avoid emotional trading!

$CNIRYY -China Inflation Rate Hits 5-Month PeakECONOMICS:CNIRYY 0.5%
(January/2025)
source: National Bureau of Statistics of China
- China’s annual inflation rate surged to 0.5% in January 2025 from 0.1% in the prior month, above consensus of 0.4%.
This was the highest figure since August 2024, driven by seasonal effects from the Lunar New Year.
Meantime, producer prices fell by 2.3% yoy, keeping the same pace as in December while declining for the 28th month.

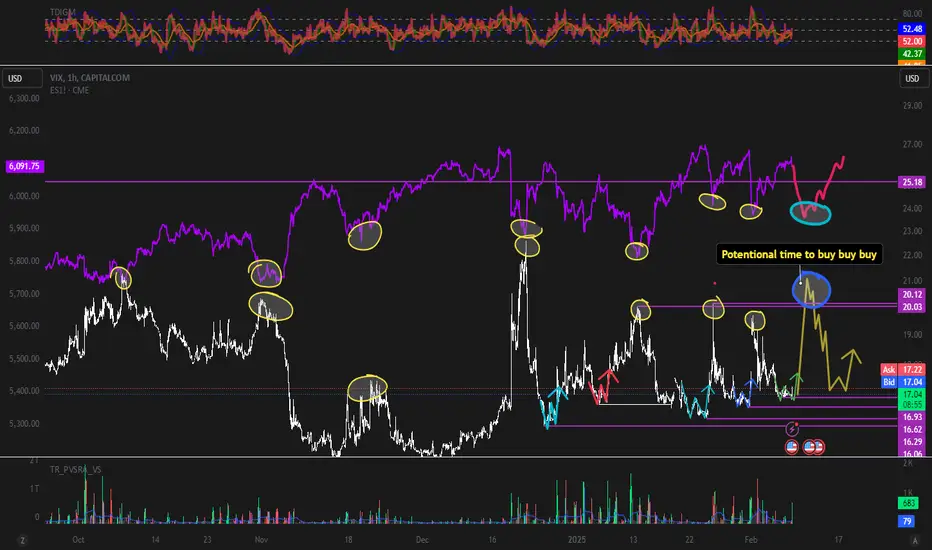
VIX & SXP There is some W on actual lows in VIX , so if it will play out ...It will be next higher low on VIX. It could lead in to higher high. Time will show how markets react on today employment data .I think it was little bit pro inflation with can lead in to stronger DXY situation ...
SPX500 programmed to have a correction.My analysis is straightforward. On the weekly timeframe, there is a significant bearish divergence on the RSI, indicating that the market is moving in the wrong direction relative to fundamentals. This divergence has been present for six months, so one might assume there’s no reason for a change.
The market is in a bubble, but it needs a catalyst to wake up. While I appreciate some of Trump's policies, certain aspects of his approach could crash the market.
- Imposing tariffs on most imports might seem like a good idea. Trump aims to make the U.S. a producer of goods rather than an importer. However, the U.S. has lost much of its manufacturing base, engineering expertise, and know-how. China now dominates these areas, making this policy difficult to implement within the short span of a four-year term.
Instead, tariffs on all imports would raise prices, worsening inflation. The market's prolonged rise has been largely driven by the Fed's efforts to control inflation. Higher inflation would force the Fed to raise interest rates, spooking the market. Another risk is a potential disagreement between the government and the Fed over policies, which would create uncertainty.
I believe that increased inflation, higher prices, and tariffs will ultimately undermine trust in U.S. monetary policies, leading to the opposite of the intended effect. The USD could weaken, and more countries may move away from dollarization (regardless of tariffs, as Trump cannot dictate other nations' monetary policies).
The market would likely react negatively, and the bearish divergence would play out, potentially causing a crash lasting at least a year, similar to what happened in January 2022.
I hope I’m wrong, but this scenario has a high probability of occurring.

EUR/USD slides on tariff turmoil, euro CPI risesThe euro has weakened at the start of the new week. EUR/USD slumped over the weekend and dropped as low as 1.0141, its lowest level since Nov. 2022. The euro has recovered somewhat on Monday and is trading at 1.0277 in the North American session. Still, the euro has dropped 0.76% since Friday's close.
US President Trump hasn't wasted any time and imposed 25% tariffs on Mexico and Canada over the weekend, effective February 4. Mexico and Canada have both announced retaliatory tariffs in response. Earlier today, just one day before the tariffs were to take effect, the US announced that the tariffs against Mexico would be delayed for a month. The breather is good news, but the US could still find itself embroiled in a trade war with its two neighbors, in what is the world's largest trade zone.
Trump hasn't slapped the European Union with any tariffs yet, but said on Friday that he would "absolutely" go after imports from the EU. Global markets have been hit by fears of a global trade war resulting from the US tariffs and the US dollar is up sharply against most of the major currencies, including the euro.
Inflation in the eurozone ticked upwards to 2.5% y/y in January from 2.4% in December, above the market estimate of 2.4%. This was the highest CPI level since July 2024, driven mainly by a sharp jump in energy prices. Core CPI, which excludes food and energy prices, remained unchanged at 2.7% y/y for a fifth straight month, just above the market estimate of 2.6%. This is above the European Central Bank's 2% target but is the lowest level since January 2022. Services inflation, which is closely watched by the ECB, eased to 3.9% in January, down from 4% in December.
Today's inflation report affirms that inflationary risks remain and could complicate the ECB's plans to reduce interest rates and kick-start the weak eurozone economy. The ECB meets next on March 6.
EUR/USD has pushed above resistance at 1.0244 and is testing resistance at 1.0297
There is support at 1.0203 and 1.0175
www.tradingview.com

Inflation vs gold correlation 60's to 80's Pattern.Gold seems to like inflation. Or, is inflation food for gold? These are chars that no one is showing you.
According to this chart, Gold has a seven year bull run ahead of it that should top at some point in 2032.
This a chart of the US Inflation rate on the 2 month (Blue line) right from the horses mouth, Bureau of labour statistics. On the top in gold or yellow is the gold chart. As you can clearly see, in the seventies gold was very heavily correlated with inflation. This is not my opinion this is a fact, and it will be again.
THIS IS A 2 FOR ONE GUYS. INFLATION AND GOLD FORCAST ALL IN ONE!!
Let me know what you think down below.
Kind regards,
WeAreSat0shi

TARIFFS Will Lead To Inflation!? NOPE!So many talking heads crying TARIFFS will be inflationary,
but it’s mostly uneducated fear-mongering.
Let’s look at the cold, hard USIRYY and CPI data to figure out the truth behind this.
From March 2018 through September 2019, President Trump had eight waves of tariff announcements on C-H-I-N-A, plus some steel and aluminum ones on Mexico and Canada.
In order to combat these inflation worries, Trump did what he said he was going to do…
DRILL BABY DRILL.
For the first time since 1949, the US would be a net exporter of oil.
We can see there was a quick spike in inflation from stockpiling imports before tariffs were fully implemented, but inflation quickly plummeted nearly in half as the US became a net exporter.
Fast-forward to today, and coincidentally inflation is at 2.9% which is right around where it was when Trump imposed the tariffs during his last presidency. Funny how that works out, eh ;)
Trump has declared the US will DRILL BABY DRILL bigger than ever, which should lead us to believe that this time is NOT different and inflation will go down again.

Tokyo core inflation hits one-year high, yen lowerJapan's Tokyo's core inflation rate accelerated to 2.5% y/y in January, up from 2.4% in December and in line with market expectations. This marked the highest level since February 2024 and reflects rising inflationary pressure. Tokyo CPI jumped to 3.4% y/y, its highest in almost two years, as food prices rose sharply.
Tokyo core CPI is closely monitored by Bank of Japan policymakers and supports last week's central bank decision to raise interest rates by a quarter point to 0.50%. The current cash rate is far below other central banks but is the highest in Japan since the global financial crisis in 2008.The Japanese yen has reversed directions on Friday and has edged lower. In the European session, USD/JPY is trading at 154.73, up 0.28% on the day.
At the meeting, the BoJ revised higher its inflation forecasts and also hinted at further rate hikes. Deputy Governor Himino echoed this stance earlier this week, stating that the BoJ would consider further hikes if economic and inflation data continued to move in accordance with the Bank's projection. This flurry of hints about rate hikes is unusual for the BoJ, which tends to reveal little and keep speculators in the dark about its rate plans.
This secretive approach often results in sharp volatility from the yen after BoJ meetings, and Bank policymakers may be looking to avoid further sharp swings from the yen. It seems clear that further rate hikes are a question of time as the BoJ moves forward, albeit cautiously, towards normalization. The BoJ meets next on March 19 and investors will be looking for more clues about a possible rate hike at that time.
USD/JPY has pushed above resistance at 154.48. Next, there is resistance at 155.16
153.59 and 152.91 are the next support levels

GALAComprehensive Analysis of GALA
🔹 Project Introduction:
GALA is a blockchain-based ecosystem focused on developing decentralized gaming (GameFi) and NFTs. The project aims to give players full control over their in-game assets while introducing a new economic model for the gaming industry.
📊 Technical Analysis of GALA/USDT
🔍 Overall Market Condition:
GALA is currently trading within a mid-term ascending channel and is sitting at a key support zone that will determine the next major price direction.
🟢 Bullish Scenario:
Key Support Zone:
$0.02435 – $0.02684 (Blue Box)
If this support holds, the price could move toward the midline of the ascending channel.
The next major resistance lies within the red zone:
$0.05949 – $0.06914
This resistance acts as a crucial ceiling for the price.
🚀 Potential Targets After Breaking the Red Resistance:
✅ TP1: Channel Top
✅ TP2: Breakout Above the Channel → Higher Price Levels
🔴 Bearish Scenario:
If the blue support zone fails to hold:
The price could drop to the bottom of the ascending channel + weekly support
🏁 (Gray Box)
Losing this level may trigger a new bearish trend.
📈 Trend Confirmation Factors:
✔ Increasing volume on breakouts → Confirms bullish momentum
✔ Declining volume on pullbacks → Indicates weak selling pressure
✔ RSI near 50: A move towards 70 (Overbought Zone) signals bullish strength
📌 Summary & Suggested Strategy:
🔹 Holding the blue support → Targeting the red resistance
🔹 Breaking the red resistance → Potential move towards TP1
🔹 Breakout above the channel → Strong bullish rally
🔹 Heavy rejection → Key support at the bottom of the channel (Gray Box)
⚠️Risk Management:
Monitor trading volume & RSI behavior to confirm breakouts or reversals.

$USINTR -U.S Interest Rates ECONOMICS:USINTR
(January 2025)
source: Federal Reserve
-The Fed kept the funds rate steady at the 4.25%-4.5% range as expected, pausing its rate-cutting cycle after three consecutive reductions in 2024.
The Fed showed more optimism about the labor market and noted that inflation remains somewhat elevated, removing the reference to ongoing progress toward the 2% target.
The Fed also said the economic outlook is uncertain, and is attentive to the risks to both sides of its dual mandate.

Australian dollar extends losses on soft Aussie CPIThe Australian dollar is down for a third straight trading day and has declined 1.3% this week. In the North American session, AUD/USD is trading at 0.6228, down 0.37% on the day.
Australia's annual inflation rate dropped to 2.4% in the fourth quarter of 2024 from 2.8% in Q3. This was below the market estimate of 2.5% and was the lowest reading since Q1 2023. Electricity prices were sharply lower due to an energy bill rebate and services inflation dropped to 4.3% from 4.6%, its lowest level in three quarters. On a quarterly basis, CPI remained unchanged at 0.2% in Q4, below the market estimate of 0.3%.
The Reserved Bank of Australia's trimmed mean CPI, a key indicator of underlying inflation, slowed to 0.5% q/q in Q4, lower than 0.8% in Q3 and below the market estimate of 0.6%. Annually, trimmed mean CPI fell to 3.2%, compared to a revised 3.6% in Q3 and below the market estimate of 3.3%.
The soft inflation report has raised expectations that the RBA will lower rates at the Feb. 18 meeting, with the market pricing in a quarter-point cut at 80%. That would bring the cash rate to 4.10%, its lowest since Oct. 2023. Today's inflation report has added significance as it is the final tier-1 event prior to next month's rate meeting.
Investors are awaiting the Federal Reserve's rate announcement later today, although it would be a massive surprise if the Fed did not maintain the current benchmark interest rate of 4.25%-4.5%. The Fed has cut rate three consecutive times, including a jumb0 half-point chop in September 2024, but the resilient US economy has stalled plans to aggressively lower rates further and currently the Fed is projected to cut rates only once or twice in 2025.
AUD/USD is testing support at 0.6228. Below, there is support at 0.6204
0.6262 and 0.6286 are the next resistance lines

AUD/USD slides on Trump tariff threatsThe Australian dollar is in negative territory on Tuesday. In the North American session, AUD/USD is trading at 0.6252, down 0.62%.
Investors are keeping a closer eye on the third-quarter inflation report, which will be released early on Wednesday. CPI is expected to ease to 2.5% from 2.8%. This is the final tier-1 event prior to the Reserve Bank of Australia's rate meeting on Feb. 18 and could be the determining factor as to whether the RBA finally lowers interest rates. The markets have priced in about an 80% chance of a quarter-point cut at the February meeting. The RBA has maintained the cash rate at 4.35% since Nov. 2023 and has been an outlier among other major central banks, most of which have entered an easing cycle.
The US dollar is showing broad strength today, after US President Trump said on Monday that he would impose tariffs on steel, aluminum and copper imported to the U.S. Trump reiterated that he plans to levy a baseline universal tariff on all imports. Trump's tariff plans would likely raise inflation and could destabilize the financial markets, which displayed strong swings during Trump's first week in office.
China's services and manufacturing sectors both decelerated in January and missed expectations. The non-manufacturing PMI fell to 50.2, down from 52.2 in December and shy of the forecast of 51.8. With the exception of November, service activity has been stagnant, with readings barely above the 50 level, which separates expansion from contraction. Domestic demand weakened and the uncertainty surrounding Donald Trump's trade policies have dampened foreign sales.
The manufacturing sector is struggling and contracted in January, easing to 49.1, compared to 50.1 in December and missing the market estimate of 50.1. This was the first contraction since September 2024 and the sharpest decline in five months. Manufacturing output and foreign orders weakened in January and the weak global economy could mean further headwinds in 2025 for the manufacturing sector.
China's government has implemented stimulus measures in order to boost the economy and GDP hit 5% in 2024. Still, deflation has persisted and consumer spending remains weak. The government will have to inject further stimulus in order to boost domestic consumption, a key engine of economic growth.
AUD/USD is testing support at 0.6278. Below, there is support at 0.6225
0.6366 and 0.6419 are the next resistance lines

AUD/USD slides on soft Chinese dataThe Australian dollar is in negative territory on Monday. In the North American session, AUD/USD is trading at 0.6276, down 0.59%. The Australian dollar is coming off its best weekly performance since Nov. 2023, gaining 2% against the US dollar.
China's services and manufacturing sectors both decelerated in January and missed expectations. The non-manufacturing PMI fell to 50.2, down from 52.2 in December and shy of the forecast of 51.8. With the exception of November, service activity has been stagnant, with readings barely above the 50 level, which separates expansion from contraction. Domestic demand weakened and the uncertainty surrounding Donald Trump's trade policies have dampened foreign sales.
The manufacturing sector is struggling and contracted in January, easing to 49.1. compared to 50.1 in December and missing the market estimate of 50.1. This was the first contraction since September 2024 and the sharpest decline in five months. Manufacturing output and foreign orders weakened in January and the weak global economy could mean further headwinds in 2025 for the manufacturing sector.
China's government has implemented stimulus measures in order to boost the economy and GDP hit 5% in 2024. Still, deflation has persisted and consumer spending remains weak. The government will have to inject further stimulus in order to boost domestic consumption, a key engine of economic growth.
Australia releases the National Australia Bank business confidence index early on Tuesday. The index fell sharply to -3 in November, down sharply from 5 in October. The markets are expecting a rebound for December, with a forecast of 3 points. Investors are also keeping an eye on the third-quarter inflation report, which will be released on Wednesday. CPI is expected to ease to 2.5% from 2.8%. This is the final tier-1 event prior to the Reserve Bank of Australia's rate meeting on Feb. 18.
AUD/USD is testing support at 0.6284. Below, there is support at 0.6256
0.6308 and 0.6336 are the next resistance line

Can Turkey's Lira Dance with the Dollar?Turkey stands at a pivotal moment in its economic journey, navigating through the complexities of fiscal management and monetary policy to stabilize the Turkish Lira against the US Dollar. The nation has embarked on a strategic pivot towards domestic funding, significantly increasing the issuance of Turkish Government Bonds to manage soaring inflation and debt service costs. This approach, while stabilizing in relative terms, challenges Turkey to balance between stimulating growth and controlling inflation, a dance that requires both precision and foresight.
The Central Bank of Turkey's decision to cut rates amidst rising inflation paints a picture of calculated risk and strategic optimism. The bank is threading a needle between fostering economic activity and maintaining price stability by targeting a reduction in inflation over the medium term while allowing short-term increases. This policy shift, coupled with a focus on local funding, not only aims to reduce external vulnerabilities but also tests the resilience of Turkey's economy against global economic currents, including the impact of international political changes like the US election.
Globally, the economic landscape is fraught with uncertainties, and Turkey's strategy of maintaining a stable credit rating while forecasting a decrease in inflation sets an intriguing stage. The country's ability to attract investment while managing its debt profile, especially in light of global monetary policy shifts by major players like the Federal Reserve and the ECB, will be a testament to its economic stewardship. This narrative invites readers to delve deeper into how Turkey might leverage its economic policies to not only survive but thrive in a fluctuating global market.
The enigma of the USD/TRY exchange rate thus becomes a compelling study of economic strategy, where every policy decision is a move in a larger game of financial chess. Turkey's attempt to balance its books while dancing with the dollar challenges conventional economic wisdom and invites observers to ponder: Can a nation truly master its currency's fate in the global marketplace?

BoJ hikes rates, yen pares gainsThe Japanese yen gained as much as 0.8% earlier today but has failed to consolidate these gains. In the European session, USD/JPY is trading at 156.03, dwon 0.02% on the day.
The Bank of Japan hiked its policy rate by 25 basis points earlier today, as expected. This brings the policy rate to 0.5%, its highest level since October 2008, during the global financial crisis. The Japanese yen climbed sharply after the decision but was unable to consolidate these gains.
The BoJ has been signaling that it planned to raise rates at today's meeting, although the BoJ tends to surprise the markets and a rate hike, while expected, was not a given. The BoJ statement expressed hope that this year's wage negotiations would result in strong wage increases, as was the case last year. Governor Ueda has said in the past that he would raise rates provided that inflation was driven by higher wages, which would show that inflation was sustainable. Wage growth has been moving higher and this resulted in today's rate hike.
Japan's inflation rate has been moving higher and the December inflation report, which came out today, showed core CPI climbed to 3%, up from 2.7% in November and in line with the market estimate. The core rate has hovered above the BoJ's 2% target for 2.5 years and at today's meeting, the BoJ upgraded its inflation outlook to above 2% until 2026.
Predictably, Governor Ueda didn't provide a timeline for the next rate hike at his post-meeting press conference, but a May rate hike is on the table if the wage negotiations result in higher wages and inflation does not weaken unexpectedly. Another key factor in the timing of the next rate hike will be President Trump's trade policy. Trump had promised to levy tariffs on US trading partners on his first day in office but has delayed the tariffs until at least Feb. 1. The BoJ will want to see which direction Trump's trade policy is going before raising rates again.
There is support at 154.78 and 153.27
156.49 and 158.00 are the next resistance lines

$JPIRYY -Japan Inflation Rate Highest in Near 2 YearsECONOMICS:JPIRYY 3.6%
(December/2024)
source: Ministry of Internal Affairs & Communications
- The annual inflation rate in Japan jumped to 3.6% in December 2024 from 2.9% in November,
marking the highest reading since January 2023 as food prices rose the most in a year.
Meanwhile, the core inflation rate climbed to a 16-month peak of 3%, in line with estimates.

Bank of Japan expected to raise rates, yen calmThe Japanese yen is slightly lower on Thursday. In the European session, USD/JPY is trading at 156.25, down 0.16% on the day.
All eyes are on the Bank of Japan, which meets early on Friday. The BoJ is expected to raise interest rates by 25 basis points which would bring the cash rate to 0.50%. The BoJ has said that it will raise rates if it sees higher wage growth, which would indicate that inflation is sustainable. BoJ policymakers have expressed confidence that wages are moving higher and Deputy Governor Himino said last week that many firms plan to raise wages at least as much as last year.
Investors will be keeping a close eye on the BoJ's rate statement. The tone of the statement could be dovish as BoJ policymakers are concerned about President Donald Trump's threats to levy trade tariffs as early as Feb. 1, a move which could destabilize the financial markets. The BoJ will have to be cautious as it gauges the 'Trump factor".
Another factor supporting a rate hike is the poor performance of the Japanese yen, which has declined around 9% in the past three months. The Federal Reserve is sounding more hawkish and might raise rates only once or twice this year. If the BoJ stays on the sidelines again, the yen could fall further.
Overshadowed by the BoJ meeting, Japan releases December core CPI. Japan's core inflation rate has been climbing higher and is expected to climb to 3% y/y, up from 2.7% in November which was a three-month high. The core rate, which is closely watched by the BOJ, has hovered above the central bank's target of 2% for over two years.
USD/JPY is testing support at 156.20. Below, there is support at 155.68
157.04 and 157.56 are the next resistance lines

Internet Computer (ICP)Comprehensive Analysis of ICP
Introduction
The Internet Computer Protocol (ICP) is one of the leading projects in the blockchain space, developed with the aim of creating a decentralized internet. This project enables decentralized applications (dApps) to run directly on the blockchain without relying on centralized infrastructure. Due to these features, ICP has captured the attention of developers and investors alike, showcasing significant growth potential in the future.
From a price perspective, ICP has experienced substantial volatility since its launch. It is currently trading within a medium-term ascending channel, which plays a critical role in determining its future price trend.
🔍 Current Status
At present, ICP has entered a correction phase after encountering a weekly resistance zone at $14.623 - $15.704. It is now approaching the lower boundary of its ascending channel and the key weekly support zone at $6.166 - $6.944, which are crucial for preventing further price decline.
Conversely, significant resistance levels at higher zones could limit the upward momentum of the price.
🚀 Key Levels Analysis
Support Levels:
Lower boundary of the ascending channel
Weekly support zone: $6.166 - $6.944
Resistance Levels:
Daily resistance zone: $11.089 - $11.767
Weekly resistance zone: $14.623 - $15.704
Breaking these resistance levels, accompanied by increased trading volume, could strengthen the bullish price movement.
📈 Entry Strategy and Stop Loss
First Entry Point:
When to Enter: If the price bounces off the lower boundary of the ascending channel and the gray support zone ($6.166 - $6.944), a gradual entry is recommended.
Stop Loss: Below the gray support zone at $6.
Second Entry Point:
When to Enter: If the daily resistance zone ($11.089 - $11.767) is broken, initiating a second entry is advisable.
Stop Loss: Below the gray support zone at $6.
Complementary Entry:
A breakout of the 50-level on RSI can serve as an additional confirmation signal for entry.
🎯 Price Targets
Target 1: $21.158 - $23.555
Target 2: $36.722 - $40.641
Achieving these targets requires a confirmed breakout above the weekly resistance zone ($14.623 - $15.704).
⚠️ Key Considerations
Trading Volume: Resistance breakouts must be confirmed by a significant increase in trading volume.
Risk Management: Gradual entry strategies and defined stop losses are essential for minimizing risk.
Ascending Channel: As long as the price remains above the lower boundary of the ascending channel, the medium-term uptrend remains intact.
Alternative Scenario
If the weekly support zone ($6.166 - $6.944) is broken and a candle closes below it, the price could drop further toward $4.5. In this scenario, exiting long positions is recommended.
🔗 Conclusion
The analysis indicates that ICP holds considerable growth potential. However, maintaining proper risk management and closely monitoring key support and resistance zones is crucial. Entering at support zones with a stop loss below $6 and confirming resistance breakouts with high trading volume can be a solid strategy for investment.

USD/JPY climbs, markets eye TrumpThe Japanese yen is in negative territory on Wednesday. In the North American session, USD/JPY is trading at 156.53, up 0.68% on the day.
There are no key releases in the US today. On Thursday, the US releases unemployment claims and President Trump will address the World Economic Forum. Trump has vowed to levy tariffs on US trading partners, including China and the European Union. The financial markets are taking his threats seriously, and on Monday, his first day in office as President, Trump announced that he was delaying applying tariffs until Feb. 1. That announcement was a relief for the market and the US dollar fell sharply against many of the majors, although the yen failed to gain ground. Will Trump's comments at the World Economic Forum shake up the financial markets?
Investors are keeping a close eye on the Bank of Japan rate decision and December Core CPI on Friday. The central bank has hinted at a rate hike at the rate meeting and is widely expected to raise rates to 0.50%, which would be the highest level since the 2008 global financial crisis. After decades of deflation and an ultra-loose monetary policy, inflation has taken root and the BoJ is slowly moving towards normalization. The BoJ's tightening cycle makes it an outlier among the major central banks, most of which are easing rates in response to lower inflation.
Japan's core inflation rate has been steadily rising and is expected to climb to 3% y/y in December 2024, up from 2.7% in November which was a three-month high. The core rate, which is a key gauge of inflation trends, has remained above the BoJ target of 2% for over two years and is a key reason why the BoJ is tightening policy.
USD/JPY has pushed above resistance at 155.51 and 156.24. Above, there is resistance at 156.97
154.78 and 154.05 are the next support levels

1inch Network (1INCH)Comprehensive Analysis of 1INCH/USDT 🪙
Introduction
1INCH is the native token of the 1inch Network, a DEX aggregator designed to optimize trades in the DeFi space. This platform enables users to access the best rates across various decentralized exchanges. The 1INCH token serves multiple purposes, such as reducing transaction fees, offering discounts, and acting as a governance token.
🔍 Technical Analysis Breakdown
1. Long-Term Descending Channel
1INCH has broken out of its long-term descending channel and is currently retesting the channel boundary. This pullback is a positive sign for a potential bullish continuation, but further confirmation is needed.
2. Daily Support Zone (Red)
The $0.3377 - $0.3757 range is identified as a key daily support level.
If the price stabilizes within this zone and starts to rise, it could confirm the pullback and signal the beginning of an upward move toward higher resistance levels.
3. Weekly Resistance Zone (Green)
The $0.6276 - $0.7049 range represents a significant resistance in the weekly timeframe.
A breakout above this zone, accompanied by increased trading volume, could lead to a rally toward the blue target zone ($1.1819 - $1.450).
4. Support in Case of a Drop
If the red support zone fails to hold:
The price might re-enter the descending channel and move toward the weekly support zone ($0.2101 - $0.2338), marked in gray.
📌 Suggested Entry Points
1. Breakout-Based Entry:
Condition: Price breaks above the green resistance zone with increased trading volume and stabilizes above this range.
2. Pullback-Based Entry:
Red Zone ($0.3377 - $0.3757): Enter with a stop-loss below the red support zone.
Gray Zone ($0.2101 - $0.2338): Enter with a stop-loss below the gray support zone.
Note: The gray zone offers a higher risk-to-reward ratio but comes with greater risk.
📈 Entry Triggers and Confirmation Signals
RSI Support:
Price holding above the midline on higher timeframe RSI charts can confirm the start of an uptrend.
Increased Trading Volume:
Breakouts of key zones must be validated by significant volume increases.
Low-volume breakouts could indicate false signals (fakeouts).
⚠️ Key Risk Management Tips
Volume Monitoring:
Ensure volume spikes during breakouts to avoid falling for fakeouts.
Capital Management:
Given the sensitivity of this analysis, strictly adhere to proper capital management strategies and set stop-loss orders at the identified levels.
Patience and Confirmation:
Avoid impulsive entries. Wait for clear confirmation signals before committing to a trade.
✨ Final Conclusion
1INCH is at a critical juncture from a technical perspective:
The breakout from the descending channel and the pullback to the support zone indicate a positive setup for a bullish continuation.
Close monitoring of price behavior in the key zones (red and green) is essential, with confirmations such as rising trading volume and RSI support being mandatory for entry.
A successful breakout of the weekly resistance (green) could lead to targets in the blue zone ($1.1819 - $1.450).
However, if the red support zone fails to hold, a decline toward the gray support zone becomes a strong possibility.
