Infosys on getting ready for new high? - {20/07/2025}Educational Analysis says that Infosys (Indian Stock) may give trend Trading opportunities from this range, according to my technical analysis.
Broker - NA
So, my analysis is based on a top-down approach from weekly to trend range to internal trend range.
So my analysis comprises of two structures: 1) Break of structure on weekly range and 2) Trading Range to fill the remaining fair value gap
Let's see what this Stock brings to the table for us in the future.
DISCLAIMER:-
This is not an entry signal. THIS IS FOR EDUCATIONAL PURPOSES ONLY.
I HAVE NO CONCERNS WITH YOUR PROFITS OR LOSS on trades you take from my setup educated analysis.
My Analysis is:-
Short term trend may be go to the Internal demand zone.
Long term trend breaks the creates all time new high.
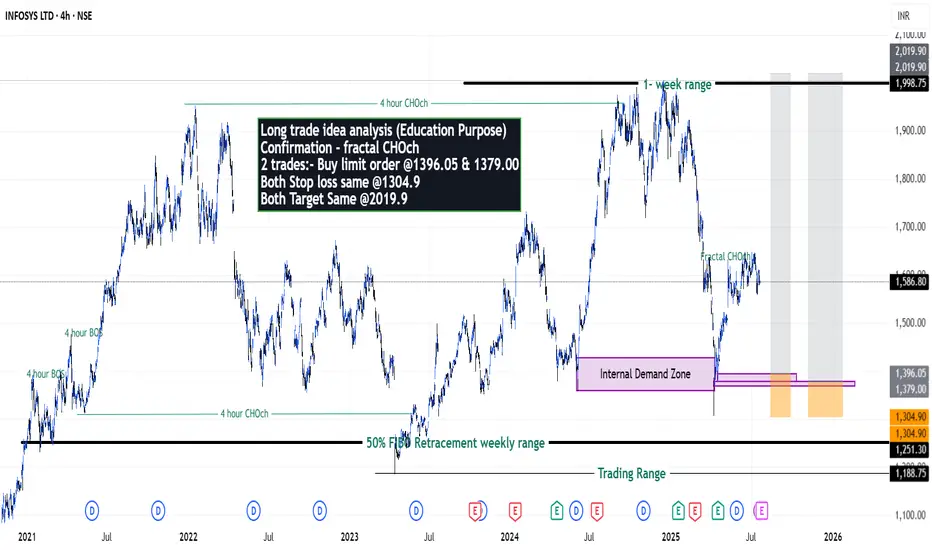
Long trade idea analysis (Education Purpose)
Confirmation - fractal CHOch
2 trades:- Buy limit order @1396.05 & 1379.00
Both Stop loss same @1304.9
Both Target Same @2019.9
Happy Trading,
Stocks & Commodities TradeAnalysis.
Infosys
INFOSYS 📊 Chart Analysis – Infosys Ltd (INFY)
Currently, the stock is testing a key resistance zone between ₹1620–₹1630.
If the price breaks and closes above this resistance, it can signal a strong bullish breakout.
---
💼 Trade Setup (Based on Cup and Handle Pattern):
Entry (Buy): On a closing above ₹1640
Stop Loss: ₹1570
Target 1: ₹1700
Target 2: ₹1780
---
This is a classic Cup and Handle breakout setup, which often indicates the start of an upward trend.
If you find this helpful and want more FREE forecasts in TradingView, Hit the 'BOOST' button
Drop some feedback in the comments below! (e.g., What did you find most useful?
How can we improve?)
Your support is appreciated!
Now, it's your turn!
Be sure to leave a comment; let us know how you see this opportunity and forecast.
Have a successful week
DISCLAIMER: I am NOT a SEBI registered advisor or a financial adviser. All the views are for educational purpose only

INFY 1H Chart Analysis (Bullish Bat + Falling Wedge)NSE:INFY
INFY 1H Chart Analysis (Bullish Bat + Falling Wedge)
In this 1-hour chart of Infosys Ltd (NSE: INFY), a Bullish Bat Harmonic Pattern has completed at point D, suggesting a potential reversal zone. Additionally, a falling wedge formation adds to the bullish confluence.
1. Pattern Structure:
The chart displays a complete Bullish Bat Pattern (X-A-B-C-D).
Point D aligns with the PRZ (Potential Reversal Zone), with a CD leg extending \~1.618 of BC, supporting a bullish reversal.
2. Falling Wedge Pattern;
A falling wedge, generally a bullish pattern, has formed from point C to D.
A breakout above the wedge trendline may confirm a bullish move.
3. Price Action:
The price is testing the upper boundary of the wedge.
Buying interest is visible at the P,R,Z near ₹1,540–₹1,545.
Trade Plan:
Buy Entry: Above ₹1,555 (confirmation breakout above wedge)
Stop Loss: Below ₹1,538 (beneath point D and wedge support)
Target 1: ₹1,568 (previous resistance)
Target 2: ₹1,611 (mid-term resistance)
Target 3: ₹1,631 (major swing high)
A strong bullish confluence exists with the harmonic pattern and falling wedge. Wait for confirmation above ₹1,555 before entering. Maintain proper risk-reward with a stop below ₹1,538.
NSE:INFY NSE:NIFTY NSE:CNXIT

INFY - Infosys Ltd (2 hours chart, NSE) - Long PositionINFY - Infosys Ltd (2 hours chart, NSE) - Long Position; short-term research idea.
Risk assessment: Medium {volume & support structure integrity risk}
Risk/Reward ratio ~ 2.83
Current Market Price (CMP) ~ 1480
Entry limit ~ 1455 to 1435 (Avg. - 1445) on April 28, 2025
1. Target limit ~ 1485 (+2.77%; +40 points)
2. Target limit ~ 1530 (+5.88%; +85 points)
Stop order limit ~ 1415 (-2.08%; -30 points)
Disclaimer: Investments in securities markets are subject to market risks. All information presented in this group is strictly for reference and personal study purposes only and is not a recommendation and/or a solicitation to act upon under any interpretation of the letter.
LEGEND:
{curly brackets} = observation notes
= important updates
(parentheses) = information details
~ tilde/approximation = variable value
-hyphen = fixed value

Infosys Vs Nifty IT The markings on the chart are based on the Elliott Wave theory.
The IT index has lagged in strength over the last 1+ year and now seem to enter the next wave C down. While the index made a new high, the internal moves are corrective and divergent on the RSI which makes it a better wave (B) candidate.
The next few weeks should be a sharp fall in the IT stocks as wave (c) tend to be quick and less time taking.

INFOSYS looking to take out liquidityINFY is looking for BuyStops below the the target price. Price is likely to start looking for the Sell side liquidity targets soon. Even if SL gets taken it may be possible that the price fails to push higher.

Infosys is building up positive information for investorsInfosys Ltd. is a digital services and consulting company, which engages in the provision of end-to-end business solutions. It operates through the following segments: Financial Services, Retail, Communication, Energy, Utilities, Resources, and Services, Manufacturing, Hi-Tech, Life Sciences, and All Other. Infosys is one of the top Indian companies and an Indian global MNC.
Infosys Ltd. CMP is 1879.80. The positive aspects of the company are Company with No Debt, Company with Zero Promoter Pledge, MFs increased their shareholding last quarter, FII / FPI or Institutions increasing their shareholding and Company able to generate Net Cash - Improving Net Cash Flow. The Negative aspects of the company are high Valuation (P.E. = 29).
Entry can be taken after closing above 1880 Targets in the stock will be 1943. The long-term target in the stock will be 1993. Stop loss in the stock should be maintained at Closing below 1732 or 1719 depending upon your risk taking ability.
Disclaimer: The above information is provided for educational purpose, analysis and paper trading only. Please don't treat this as a buy or sell recommendation for the stock. We do not guarantee any success in highly volatile market or otherwise. Stock market investment is subject to market risks which include global and regional risks. We will not be responsible for any Profit or loss that may occur due to any financial decision taken based on any data provided in this message.

bearish flag pattern - INFY (Infosys)The chart for Infosys (INFY) displays a bearish flag pattern, suggesting a potential downward movement in the near term. Based on the current setup, the stock appears likely to reach the support level around 1725.

#INFY; Multi-Year Breakout#INFY; Multi-Year Breakout, Results may add fuel to achieve the upside target - 2085.
Backed by strong Fundamentals, worth a review!

INFYHi guys,
In this chart i Found a Demand Zone in INFY CHART for Positional entry,
Observed these Levels based on price action and Demand & Supply.
*Don't Take any trades based on this Picture.
... because this chart is for educational purpose only not for Buy or Sell Recommendation..
Thank you

Infosys-Bullish Swing- Retracement or Pullback?
12.08.2024
Buy 1799
Target 1881
StopLoss 1716
Risk Reward- 1:1
1. Inside bar breakout
2. Rejection from resistance turned to support
3. Lower volumes found in downtrend
4. RSI Reversal with double bottom

INFOSYS trading analysisInfosys the IT giant of India is going to form a reverse cup with handle chart pattern. The company although giving consistent profits has not formed a new high in the previous 2.5 years. Now after forming this chart pattern it may break its previous high. The buy point is 1910 an selling point is 2500. This will give a 31% return. The stock will achieve this target before 2025 Diwali giving a 30% return in approximately 15-16 months.
Hope you like my analysis.
Please do your own analysis before investing.
Do like and follow and share among your friends and family.
Thank you.

Infosys-Strong Buy-Swing/Short term
Buy
Target:1644
SL: 1518
1. Inside Candle breakout in Day TF & Week TF
2. 50% Fibonacci crossed in last downtrend.
3. Good Momentum candles in last few days.
4. Price reached last 3 months high.
5. EMAs crossover & Rejections.
6. Good Volume breakout.
7. IT Sector in good uptrend

INFY ASCENDING TRIANGLE IDENTIFIEDINFY has formed an ascending triangle pattern on the hourly chart. A bullish candle has closed just above the resistance level, indicating potential upward movement. However, for a confirmed bullish trend, we await a clear breakout above the resistance. It's essential to note that a bearish breakout would invalidate this bullish projection, emphasizing the need for cautious observation.

Infosys Wave AnalysisHey Guys,
Today, I would like to share some insights regarding Infosys' recent stock performance. Despite prevailing bearish sentiments since February 6, 2024, Infosys has surprised many community analysts, causing some predictions to falter.
Upon conducting an in-depth analysis, it became apparent that the stock has been undergoing a correction characterized by an irregular flat pattern. This pattern has created several challenges for traders, often resulting in unexpected outcomes and trapping many individuals in their positions. Allow me to elucidate the bearish sequence:
1. The first leg of the flat pattern, comprising three waves (abc), concluded on February 14, 2024, with a price level of Rs. 1635.50.
2. Subsequently, the second leg of the flat pattern, also consisting of three waves (abc), concluded on February 19, 2024, with a price level of Rs. 1711.50.
3. Following the completion of the second leg, the stock experienced a downward impulsive movement, culminating in a five-wave structure.
It's noteworthy that this irregular flat pattern is characterized by a subdivision of 3-3-5, exceeding the expectations of many traders and leading to lingering positions or exits triggered by stop losses.
Based on this analysis, there's a possibility that Infosys might reach a new high. Conservatively, we could anticipate a retracement of at least 61.8%. However, we remain optimistic about the potential for even higher levels beyond that threshold.
Thank you for your attention to this analysis. Don't forget to like, share, and subscribe for more updates.
Disclaimer: The above analysis is based on personal observations and research, and it should not be considered as financial advice. Always conduct thorough research or consult with a qualified financial advisor before making any investment decisions.

Short term Investment Idea | Infosys | 25% Upside Potential
Short term Investment Idea | NSE:INFY | 25% Upside Potential
✅ Buy Level - Rs 1485-1499
✅ SL - Rs 1431
✅ Target - Rs 1734 / Rs 1832
✅ Support on 200 DSMA
✅ Trading at the bottom of the parallel channel
✅ Completed Fibonacci Retracement of 38.2
Look at the chart for more information
Thanks
Thanks

INFY If you're interested in trading with Infosys, here are some levels that you may want to consider.

Found Simple Bull Run In InfosysEverything is pretty much explained in the chart itself.
For any query kindly dm.
Thank you So Much.

INFOSYS LTDits taking support (0.5) retracement level 1980 rs above breakout and need for retracement , trend based target 1 is 2327 rs ,and target 2 is 2648 target 3 is 3525rs

INFOSYS LTDThis stock breakout 2years major resistance level and TGT will be ATH level
only for educational purpose

INFY : Range bound // Below Gaps need to be filled.www.tradingview.com
INFOSYS (NSE: INFY) : It seems currently in a range bound of 1520-1570. Until it is not breaking 1520 at lower level, it is not going to fill the historical gaps lefts below. For higher side, it need to break 1570 to test its 52w high at 1619. The next target at higher side will be last swing high at 1660 approx.

Navigating Infosys: A Trade Insight
Currently, Infosys is making its way down to a 15-minute Demand Zone. Let's unpack this potential trade:
Zone Quality Check 🕒:
The 15-minute Demand Zone Infosys is approaching exhibits notable strength, characterized by a robust follow-through. This suggests a compelling setup for potential trades.
Intermediate Frame Exploration 🔄:
Zooming out to the 75-minute Intermediate Time Frame (ITF), Infosys finds itself comfortably within the zone, with the trend pointing upward. This aligns well with the broader context.
Daily Location Analysis 📊:
Shifting to the daily timeframe, which acts as our higher time frame (HTF) for location analysis, we find Infosys trading in an affordable area. This positioning enhances the appeal of the trade execution.
Trade Execution Plan 🎯:
Here's the plan:
- Entry: Enter at the 15-minute Demand Zone or slightly above AROUND 1445.
- Stop Loss: Place it below the 15-minute Demand Zone.
- Target: Aim for a minimum risk-to-reward ratio of 1:3.
🚀 Trade Insight:
This trade aligns well with the strength of the 15-minute Demand Zone, the upward trend in the 75-minute timeframe, and Infosys' affordable position on the daily chart.
📝 Note: This analysis is for educational purposes only. I'm not a SEBI registered analyst.
Trade Smart, Execute Confidently! 💹✨

Infy - Retest, Basing, Momentum- Restest of 1st Trendline
- 0.5 retracement of the first wave
- Strong Momentum
- Enter Between 1500-1520, SL- 1420, T1- 1670, T2- 1820
- Major Resistance - Related to the event, Breakdown from base & Gap Down
