INJUSDT 1WINJ ~ 1W Analysis
#INJ Test this support, buy gradually from here with a short -term target of at least 20%+.
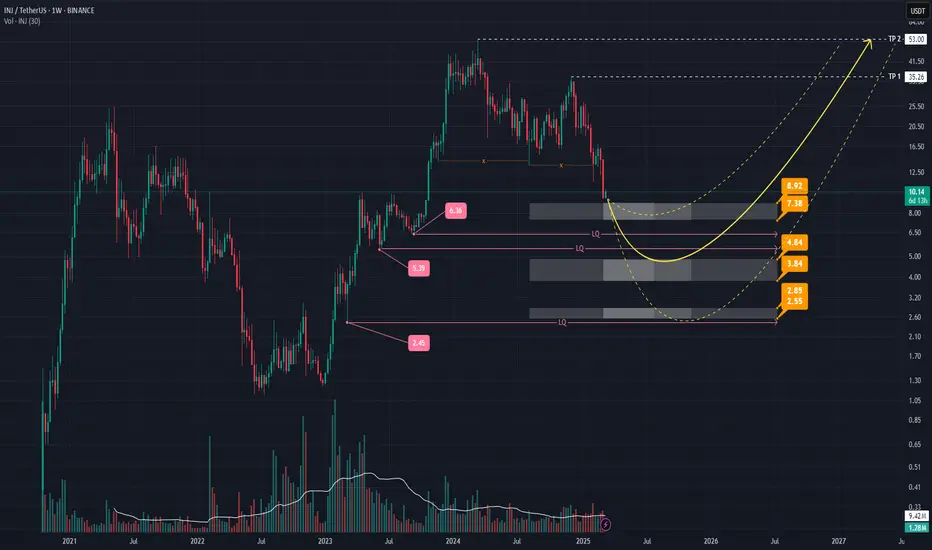
Injective

INJ Price Analysis: Key Zones & Reversal ScenariosHey everyone! 👋
Let's dive into this price chart and see what’s going on with INJ.
Overview:
We’re looking at INJ on a weekly timeframe , and there are some interesting levels to watch. The chart shows **three key zones** where price reactions might happen, marked with price levels. There are also areas of liquidity (LQ) , where the market might make a move before reversing direction.
Potential Reversal Scenarios:
Three possible price movements are shown with yellow arrows , each representing a different way the price might reverse. The second arrow is the primary scenario, suggesting that after sweeping at least one liquidity level, the price could bounce back up—especially if there’s solid volume and a strong candlestick pattern.
- Main Support Zone (3.84 - 4.84): This area is the most important. If the price reaches this zone and shows good volume and a strong candlestick pattern, it could signal a trend change.
- Other Support Zones (2.55 - 2.85 and 7.38 - 8.92): These are additional key levels. A drop below these could change the outlook.
Take Profit (TP) Targets:
TP levels are marked on the chart. If the price reverses as expected, these targets may be reached.
Final Thoughts:
Nothing in crypto is guaranteed! Always look for confirmations like volume and candlestick patterns before making decisions. Stay informed, trade smart, and always do your own research! 📊💡
INJ 100$INJ is aiming for $100! The project has completed unlocking tokens, 80% of the entire issue is in the hands of the project team and their investors. We also formed a bullish flag and pushed from its lower boundary. Pay attention to this project!
Horban Brothers.

#INJ/USDT#INJ
The price is moving in a descending channel on the 1-hour frame and is adhering to it well and is heading to break it upwards strongly, and retest it
We have a rebound from the lower limit of the descending channel, this support is at a price of 12.
We have a downtrend on the RSI indicator that is about to break and retest, which supports the rise
We have a trend to stabilize above the moving average 100
Entry price 14.60
First target 15.57
Second target 16.77
Third target 18.22


Time to BUY Injective Protocol!Hi fellow traders, INJUSDT is ready to make a move higher after completing the complex correction in WXY formation. Target the 58.4946 level. Good luck and trade safe!


INJUSDT - Matter of time!3D chart displays a consolidation of symmetrical triangle pattern.
The triangle pattern is one of the most renowned formations, known for triggering significant price breakouts once it’s breached.
Any short-term pullback is a chance to accumulate, and as soon as the pattern is broken, the price could reach 120 USD.
Best regards Ceciliones🎯


#INJ/USDT#INJ
The price is moving in a descending channel on the 1-hour frame and is expected to continue upwards
We have a trend to stabilize above the moving average 100 again
We have a descending trend on the RSI indicator that supports the rise by breaking it upwards
We have a support area at the lower limit of the channel at a price of 20.14
Entry price 20.40
First target 20.90
Second target 21.45
Third target 22.00

$INJ: Bullish reversal detected on the $INJ daily timeframe.CRYPTOCAP:INJ is a highly underrated project with immense potential. As part of the Cosmos ecosystem, it boasts a state-of-the-art blockchain featuring advanced tools, high speed, and low gas fees.
I’ve been tracking CRYPTOCAP:INJ closely as one of my favorite tech projects. While it’s not as popular as CRYPTOCAP:SUI , I have strong faith in its technology and long-term potential.
Looking at the charts, CRYPTOCAP:INJ has underperformed compared to other altcoins due to a bearish correction on the daily timeframe. However, this correction seems to be nearing its end.
With the weekly timeframe still showing bullish momentum, CRYPTOCAP:INJ appears primed for a double push-up. Based on this analysis, I anticipate a strong rally, potentially reaching $30 and even $40 within the next month or two.
DYOR!


INJUSDT Breakout Could Trigger 100-200% Move!INJUSDT Technical analysis update
BINANCE:INJUSDT price broke the previous $28 resistance and is now moving toward the $33 resistance level. If the price breaks $33, we can anticipate a strong bullish move. A rise in volume is observed near the resistance, and the price is trading above the 100 and 200 EMAs on the daily chart. If a breakout occurs, a 100–200% move in INJ could be expected.

$INJ: Steady Progress with Big Potential** CRYPTOCAP:INJ : Steady Progress with Big Potential**
CRYPTOCAP:INJ has faced repeated rejections at **$30**, indicating significant sell orders at this level. However, the overall trend remains bullish, driven by genuine organic growth rather than market manipulation.
Its uptrend is consistent and precise, following technical indicators like a **Swiss clock**.
Once CRYPTOCAP:INJ breaks above **$31** and establishes it as a support level, we could witness an impressive rally. 🚀
Patience is key—focus on long-term investments in quality projects. Recently, CRYPTOCAP:INJ bridged its meme with Solana, which is expected to bring in additional liquidity and strengthen the ecosystem.
A solid buy, in my opinion, backed by fundamentals and a promising outlook.
**DYOR!**

INJUSDT | Next Move? Are You Ready?Injective (INJ) has been showing tremendous potential due to its innovative blockchain features and increasing adoption within the crypto space. The current market conditions and technical analysis suggest that the blue boxes on the chart represent optimal zones for spot buying.
Why INJ/USDT Has Huge Potential
Fundamental Strength: Injective offers unique decentralized finance (DeFi) capabilities, including cross-chain functionality, high-speed transactions, and low fees. These features position it as a leading blockchain solution for DeFi projects.
Adoption and Ecosystem Growth: The Injective ecosystem is rapidly expanding with new projects, partnerships, and integrations, driving demand for INJ tokens.
Positive Market Sentiment: With growing interest in DeFi and blockchain scalability, INJ is attracting attention as a high-potential asset.
Technical Setup: The blue boxes on the chart highlight demand zones, where the price historically shows strong support. These zones likely represent areas of buyer accumulation, making them ideal for spot entry.
Why the Blue Boxes are Key Levels
Demand Zones: These areas reflect points of interest where institutional or large buyers may step in. Buying at these levels increases the likelihood of capturing a significant upward move.
Risk-Reward Ratio: Entering near the blue boxes minimizes downside risk while offering a higher potential for profit as the price bounces back.
Confirmation: Previous interactions at these levels have led to strong reversals, adding confidence to the accumulation strategy.
Strategy for Spot Buying
Set Buy Orders: Place spot buy orders within the blue boxes to accumulate INJ at optimal prices.
Monitor Closely: Watch for confirmations like bullish candlestick patterns or increased volume near these zones.
Hold for Long-Term Growth: INJ's potential lies in its fundamentals and ecosystem expansion, making it a strong candidate for long-term investment.
I keep my charts clean and simple because I believe clarity leads to better decisions. Trading doesn’t have to be overly complicated, and I enjoy sharing setups that have worked well for me.
My approach is built on years of experience and a solid track record. I don’t claim to know it all, but I’m confident in my ability to spot high-probability setups. It’s all about learning and growing together as traders, and I’m here to share what I see.
The markets can confirm what the charts whisper if we’re paying attention. I hope these levels help you as much as they’ve helped me in the past. Let’s see how this plays out!
🐶 DOGEUSDT.P: Next Move
🎨 RENDERUSDT.P: Opportunity of the Month
💎 ETHUSDT.P: Where to Retrace
🟢 BNBUSDT.P: Potential Surge
📊 BTC Dominance: Reaction Zone
🌊 WAVESUSDT.P: Demand Zone Potential
🟣 UNIUSDT.P: Long-Term Trade
🔵 XRPUSDT.P: Entry Zones
🔗 LINKUSDT.P: Follow The River
📈 BTCUSDT.P: Two Key Demand Zones
🟩 POLUSDT: Bullish Momentum

Trading opportunity for INJUSDTBased on technical factors there is a Buy position in :
📊 INJUSDT
🔵 Buy Now
🪫Stop loss 29.00
🔋Target 1 35.00
🔋Target 2 37.00
🔋Target 3 39.50
💸RISK : 1%
We hope it is profitable for you ❤️
Please support our activity with your likes👍 and comments📝

Injective INJ/USDT: Long, 200D SMA Bull regime & Golden CrossThis indicator helps traders identify market regimes using the powerful combination of 50 and 200 SMAs. It provides clear visual signals and detailed metrics for trend-following strategies.
We've just had our bull regime print and are trading just 21 days of bull regime duration.
Golden cross is HERE: 200D x 50D SMA crossover
Key Features:
- Dual SMA System (50/200) for regime identification
- Colour-coded candles for easy trend visualisation
- Metrics dashboard
Core Signals:
- Bullish Regime: Price < 200 SMA
- Bearish Regime: Price > 200 SMA
- Additional confirmation: 50 SMA Cross-over or Cross-under (golden cross or death cross)

$INJ Poised for $70: Bullish Breakout in PlayCRYPTOCAP:INJ is catching up, similar to how LSE:TIA expanded. This one is on track for $70.
Buys below $27 are favorable, and if we see a retest of $22 (unlikely), it would be a great opportunity.
The weekly trend is active and showing strong momentum with conviction. BINANCE:INJUSDT

TradeCityPro | INJUSDT Altcoins Gaining Momentum Amid BTC.D Drop👋 Welcome to the TradeCityPro channel!
Let's dive into the INJ/USDT chart and explore key trading triggers as altcoins show strong moves due to declining Bitcoin dominance (BTC.D).
🌐 Market Context
Bitcoin is consolidating below the $99K resistance, with whales showing calmness. This has led to capital rotation into altcoins, as reflected by the drop in BTC.D.
BTC.D is approaching a crucial support at 58.66%. A continued decline, along with Bitcoin's sideways or slight upward movement, could trigger massive altcoin pumps.
📊 INJUSDT Weekly Timeframe
Trend: INJ is attempting to close above its weekly resistance with significant volume, signaling a potential bullish breakout.
Buy Trigger: A close above this weekly resistance with a stop-loss at $16.20 provides a solid entry for spot positions.
Correction Opportunity: The coin has already corrected to $16.20, and a break above the trendline could lead to further gains.
📈 INJBTC Pair Perspective
INJ is relatively stronger than most altcoins against Bitcoin, trading at higher levels in its BTC pair.
Trigger: A breakout above 0.0004325 BTC could confirm an upward move, with potential targets at 0.0009526 BTC, provided the overall market remains bullish.
📝 Final Thoughts
Avoid FOMO: Don’t rush into the market; wait for clear triggers and manage risk responsibly.
Altcoin Opportunities: Early in an "alt-party," altcoins often outperform. However, INJ is already trading higher than many altcoins, making it essential to approach with a strategy.
Stay calm, trade wisely, and let's capture the market's best opportunities!
This analysis reflects our opinions and is not financial advice.
Share your thoughts in the comments, and don’t forget to share this analysis with your friends! ❤️

INJUSDTPPA has been moving within a 12hr since Futures Perp for INJ was launched by Binance in August whose PA chart I am banking on for this analysis.
The opening day's trading in August immediately left supply liquidity which although induced already, has still not been mitigated still, and it looks juicy for me.
There has not been any major news coming from the team lately, although the team has been strategic with certain beneficial partnerships which will hopefully yield results soon, and into the next bullrun. I believe this would push prices right into the liquidity up top, to send it crashing all the way down.
Might take some days or weeks to trigger, but the market favours the patient.

#INJ/USDT Ready to go up#INJ
The price is moving in a descending channel on the 1-hour frame and sticking to it well
We have a bounce from the lower limit of the descending channel, this support is at 23.40
We have a downtrend, the RSI indicator is about to break, which supports the rise
We have a trend to stabilize above the moving average 100
Entry price 24.50
First target 25.23
Second target 26.34
Third target 27.81

injective consolidated enough. created enough compression forInjective seems to be lagging but, It is compressiong which usually preceeds big impulse waves.
We have an H4 setup for a shorter trade. the impulse of said trade will dictate my bias for the rest of the move

$INJ update on 1HCRYPTOCAP:INJ is currently consolidating with a target of $28.
- Monthly indicators are bullish, signaling sustained growth.
- Weekly indicators are also bullish, confirming the monthly trend.
- Daily indicators are neutral, with the MACD needing to decide whether to continue consolidating or cross into another pump.
- Hourly indicators show continued consolidation.
CRYPTOCAP:INJ is not a meme coin; it’s growing steadily and gradually. There’s also a major CRYPTOCAP:INJ conference at Devcon today.
Growth signs align with CRYPTOCAP:INJ ’s seasonality when compared to 2023.
