inj buy long setup, scalp intraday setupTake it tension free sl is very tigh, wick below the sl doesn't matter candle closed then setup is invalid. If tp hits without filling entry then setup is not valid
INJUSDT

INJUSDT Forming Bullish PennantINJUSDT has recently emerged as one of the more promising crypto pairs to watch, attracting significant investor interest with strong trading volume. While no specific pattern is clearly defined on the chart right now, the market structure indicates that accumulation is happening at key support zones, hinting at a potential bullish breakout. Traders expecting an 80% to 90%+ gain see this as an opportunity to ride a strong upward trend as Injective Protocol continues to grow in the decentralized finance (DeFi) sector.
Injective Protocol (INJ) is well-known for its innovative approach to decentralized derivatives trading, offering a fully decentralized layer-2 exchange and robust DeFi ecosystem. As the crypto market shifts focus towards real utility projects, INJ stands out due to its unique value proposition and active developer community. This strong fundamental backing is one of the reasons investors are accumulating positions now before any major breakout happens.
Technically, INJUSDT is poised for a move once it clears resistance levels that have capped its price in recent months. Increasing volume suggests that traders are building positions in anticipation of a breakout, which could be fueled by positive news or broader crypto market momentum. Keep an eye on potential catalysts like protocol upgrades, partnerships, or DeFi adoption that could propel INJUSDT towards its projected gain.
✅ Show your support by hitting the like button and
✅ Leaving a comment below! (What is You opinion about this Coin)
Your feedback and engagement keep me inspired to share more insightful market analysis with you!

INJ Long Swing Setup – Structural Recovery with SMA ReclaimINJ has retraced to a key support zone and is showing early signs of recovery, reclaiming its 20-day SMA. With structural strength returning, the $11.00–$11.60 range offers a solid swing entry—contingent on BTC holding key levels.
📌 Trade Setup:
• Entry Zone: $11.00 – $11.60
• Take Profit Targets:
o 🥇 $14.00 – $16.00
o 🥈 $19.80 – $23.00
• Stop Loss: Daily close below $9.50 (Exit early if BTC breaks major support)

#INJ/USDT#INJ
The price is moving within a descending channel on the 1-hour frame and is expected to break and continue upward.
We have a trend to stabilize above the 100 moving average once again.
We have a downtrend on the RSI indicator that supports the upward move with a breakout.
We have a support area at the lower limit of the channel at 0.04263, acting as strong support from which the price can rebound.
Entry price: 10.70
First target: 11.11
Second target: 11.43
Third target: 11.86

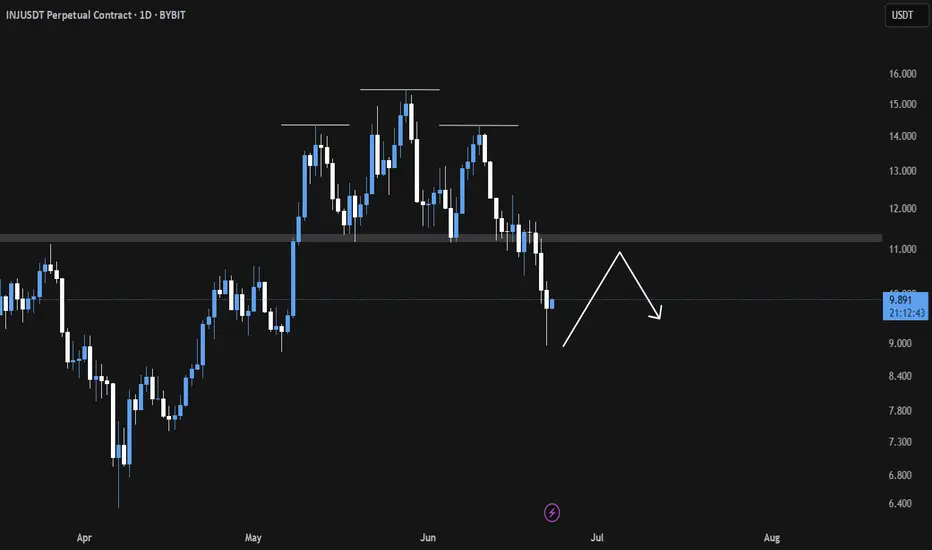
inj swing trade setupInj has broken downside, expecting more downfall before any leg up, wait for the entries to be filled, these are swing trades based on 1 day TF, so here wick doesn't matter wait for the closing, you can hold them without SL if entry achieved, take 1st entry on mentioned points 2nd entry below SL, and then wait for the closing, IF any entry achieved and candle closed above the short then wait for the pullback and close on entry points if long entry achieved then hold the trade 2nd entry take from previous wick low and wait for the tp this leg down will be the final shakeout before any major move. That's why giving you some short entries. BTC will take a final leg down sooner or later, then Boom your alt season starts.

INJ Breakdown in Play Eyeing the Neckline for Precision ShortsINJ/USDT Analysis
〽️ The Head and Shoulders pattern has broken down successfully, confirming a bearish structure.
💠We anticipate a potential relief bounce towards the $11 region which aligns closely with the neckline retest zone. This area is likely to act as a liquidity trap, where institutional sellers may re-enter aggressively 👀.
🎯 Key downside targets remain at
1. $8.98
2. $8.03
3. $6.92
Strategic Plan 🎖️
Look to initiate short positions around the neckline retest near $11, as the risk-reward becomes increasingly favorable from that level.
Trade with discipline. Let the structure lead the execution. 🫡🧠
INJUSDTA breakout of the last lower low, a retest of resistance, and a rise above the breakout candle.
A 15% target at $15.

Injective INJ price analysis🔼 We saw an infographic showing that the #Injective ecosystem currently ranks second in terms of capital inflow and retention. (First place goes to #Ethereum CRYPTOCAP:ETH with a threefold lead.)
🕯 Now let's check this information on the OKX:INJUSDT price chart, and we can see that there is indeed “buyer power”. After two months of growth, the price of #INJUSD is now adjusting quite moderately.
🍿 So, if #Injective is “preparing something really interesting” for the summer, then the price of their #INJ token should not fall below $10.
From there, it will be possible to organize “modest” growth, at least up to $27.
_____________________
Did you like our analysis? Leave a comment, like, and follow to get more

$INJ - Inverted head and shouldersCRYPTOCAP:INJ
BINANCE:INJUSDT.P
The price recently broke out from the inverted head and shoulders pattern; now, the price is going to retest the pattern's neckline.
If the price hits and bounces above the white line zone, or if the 4H candle hits and closes above the upper white line, it will be a good long opportunity.
TP: YELOW LINES
SL: 12.052 / 4H CC BELOW
NFA, DYOR
FOLLOW FOR MORE AND SHARE WITH YOUR COMMUNITY.
DON'T FORGET TO HIT THE BOOST BUTTON.

Injective & Elliott WavesAn impulse leads to a correction. A correction leads to an impulse.
The chart here starts with a bullish impulse. 1,2,3,4,5—blue-left. This impulse leads to a correction. ABC—orange.
The first ABC correction, the bear market, ends June 2022.
A correction leads to an impulse so a new bullish impulse starts right after and we have a new 5-up waves. 1,2,3,4,5—blue-center.
The bullish impulse ends March 2024 and this leads to a new ABC correction. Orange-right. The correction hits bottom 7-April 2025. The end of the correction signals the start of a new bullish impulse, 1,2,3,4,5 blue-right. The 2025 bull market.
This is Elliott Wave Theory simplified.
Namaste.

Injective Easy 584% Bullish Wave Now PossibleInjective is now ready after a very long period of correction. The peak for this pair happened in March 2024 and in December 2024 there was no higher high, instead, a classic lower high and now a complete ABC correction. This ABC correction comes after a perfect, long-term, 1,2,3,4,5 bullish impulse.
After this correction ends will be the start of a new bullish impulse which will lead to a new All-Time High. The 584% target on the chart is an easy one. The 209% is super easy and can be approached by all types of market participants. This is a strong project.
There is really high volume as prices move to "baseline level." This is a support zone that was created after a long consolidation in 2023. Almost 7 months of consolidation. Sideways, and now this same range that worked as resistance is working as support. Support is confirmed because volume is rising, a very strong rise. INJUSDT is about to grow.
The entire Injective bullish wave, with a bottom in 2022 and a peak in 2024 amounted to 4,631% total growth. This is perfect and the market is ready now for a new round of growth.
Feel free to accumulate; buy and hold.
Namaste.

INJ at Key Compression Zone – Breakout Loading?Hello Traders,
CRYPTOCAP:INJ is currently trading between two key zones — a strong upper resistance and a solid lower support.
The price is getting squeezed between a descending resistance line and a rising support trendline, creating a high-confluence area.
So far, bulls are holding the support well. If price breaks above the upper zone, it could trigger a strong move upward.
However, if the support fails, a deeper correction may follow.
🔍 Watch closely — a breakout is brewing, and volatility is on the horizon.
DYOR, NFA

#INJ/USDT#INJ
The price is moving within a descending channel on the 1-hour frame, adhering well to it, and is heading for a strong breakout and retest.
We are seeing a bounce from the lower boundary of the descending channel, which is support at 14.36.
We have a downtrend on the RSI indicator that is about to be broken and retested, supporting the upward trend.
We are looking for stability above the 100 Moving Average.
Entry price: 14.87
First target: 15.12
Second target: 15.57
Third target: 16.07

INJ/USD Bullish Heist: Crack the Vault & Grab the Loot!Ultimate INJ/USD Heist Plan: Snag Profits with the Thief Trading Strategy! 🚀💰
🌍 Greetings, Wealth Raiders! Ciao, Hello, Bonjour, Hola! 🌟
Fellow profit hunters, get ready to crack the INJ/USD "Injective vs U.S Dollar" Forex vault with our slick Thief Trading Strategy! 🤑💸 This plan blends razor-sharp technicals and fundamentals to loot the market. Follow the chart’s long-entry blueprint to strike at high-risk zones like the Yellow Moving Average Zone. It’s a wild ride—overbought conditions, consolidation, and potential trend reversals mean bears are lurking! 🐻 Stay sharp, grab your profits, and treat yourself—you’ve earned it! 🎉💪.
📈 Entry: Storm the Vault!
"The heist is on! Wait for the breakout (14.700) then make your move - Bullish profits await!"
The market’s ripe for a bullish grab! 💥 Place buy limit orders within the most recent 15 or 30-minute swing low/high levels. Set alerts on your chart to stay locked in. 🔔
🛑 Stop Loss: Guard Your Loot!
Set your Thief SL at the nearest swing low or candle wick. on the 8H timeframe for day/swing trades. Adjust based on your risk tolerance, lot size, and number of orders. Safety first! 🔒
🎯 Targets: Claim Your Prize!
🏴☠️ Short-Term Target: 15.700
👀 Scalpers, Listen Up!
Stick to long-side scalps. Got deep pockets? Jump in now! Otherwise, join swing traders for the heist. Use trailing stop-loss to lock in gains and protect your stash. 💰
🐂 Why INJ/USD is Hot!
The "Injective vs U.S Dollar" bullish surge is fueled by key fundamentals. Dive into Macro, COT Reports, On Chain Analysis, Sentiment outlook, Intermarket trends, and future targets via the linkss below for the full scoop. 👉🔗. Stay informed to stay ahead! 📰
⚠️ Trading Alert: News & Position Management
News releases can shake the market like a heist gone wrong! 🗞️ To protect your profits:
🚫 Avoid new trades during news events.
🛡️ Use trailing stops to secure running positions.
💥 Boost the Heist!
Hit the Boost Button to supercharge our Thief Trading Strategy! 💪 Every click strengthens our crew, making it easier to swipe profits daily. Join the squad, trade smart, and let’s make money rain! 🌧️💵

$INJ on WeeklyThe asset bounced within the Demand zone on the Weekly, creating room for a possible rally up to the $20-25 area.
Volatility is still open but with steadily decreasing bearish pressure.
A Daily FVG overlaps with the Weekly FVG so as to create possible room for maneuver.
The widely used RSI has broken the barrier of a bearish trendline that has lasted since December 2023. Whether it maintains the trajectory will only be seen at the close of this week.
Funding rates positive.
Open Interests slightly up.
Detail not to be overlooked in the coming days: the market cap line is rising, but the price is lagging slightly. Positive sign.
Stable volume, with an improvement in the last two days. Very mild data.
With the whole crypto sector seemingly showing signs of life, I am confident of its uptrend.
Remember: until proven otherwise.

$CATUSD Breakout Setup OKX:CATUSD Breakout Setup
CATUSDT is holding above key support and an ascending trendline, showing bullish strength.
If the structure holds, a move toward 0.00025344 is possible, a potential 173% gain.
Key resistances are at 0.00013776 and 0.00018994.
It’s a volatile coin, so manage risk wisely.
DYOR, NFA.

$NEAR 2H Trade Setup.Breakout from descending trendline, bounce from demand zone
. Entry: CMP
. SL: $2.62
. TP: $2.96 / $3.17 / $3.36
Clean breakout. Watching for follow-through.
DYRO, NFA

TradeCityPro | INJUSDT Best Position Among Altcoins! 👋 Welcome to TradeCityPro Channel!
Let’s dive in and analyze one of my favorite coins in the cryptocurrency space, INJ, which is showing strong potential. We’ll check the new entry triggers together.
🌐 Overview Bitcoin
Before starting the analysis, I want to remind you again that we moved the Bitcoin analysis section from the analysis section to a separate analysis at your request, so that we can discuss the status of Bitcoin in more detail every day and analyze its charts and dominances together.
This is the general analysis of Bitcoin dominance, which we promised you in the analysis to analyze separately and analyze it for you in longer time frames.
📊 Weekly Time Frame
On the weekly time frame, I see that the seventh period is stable, INJ, and compared to the majority of altcoins that have their own low price levels, it is in a better space and is engaged in its own supports!
After breaking the primary trend ceiling, namely 9.28, we experienced a sharp upward movement and formed a historical ceiling at $53, and after forming a distribution box and breaking the important floor of 16.20 and pulling back to it, we experienced a continued decline.
Currently, we’ve bounced from the key support at 6.54 and experienced a 90% move, which highlights the importance of this resistance. If we form a higher low above 6.54, the 13.54 trigger will be excellent for a spot buy, and I’ll personally add another buy position at that level.
📉 Daily Time Frame
On the daily time frame, our trend is completely bearish as you can see, and the events are completely accompanied by the formation of a downward bottom and top, but we are likely to suffer for a while.
After getting rejected from 34.16 and forming a box between 20.16 and 25.93 and losing the bottom, it made a move and then while pulling back with low volume and the next conversion to red, it became an inverted Sharpe, we experienced a decline!
After breaking the daily trendline and activating its trigger at 8.54, we saw a move and got stuck at the 10.32 resistance. After forming a higher low, we moved up to 13.76. Currently, the 13.76 trigger, and even better, 16.25, can serve as our futures long and spot long triggers, respectively. We’re still holding the position opened at 10.32.
✍️ Final Thoughts
Stay level headed, trade with precision, and let’s capitalize on the market’s top opportunities!
This is our analysis, not financial advice always do your own research.
What do you think? Share your ideas below and pass this along to friends! ❤️

INJ Primed for Bounce in $10-$11 Demand ZoneI expect the BYBIT:INJUSDT.P price to reach the previous mitigation level, coinciding with the latest demand block, and show a reaction. In other words, a move from the $10-$11 range is critical. If the strength from this level continues, it could push the price up to the $17-$21 range.

Injective Bullish Reversal Signals —Technical Analysis WorksThe reversal signals show up in so many ways. Some can be predicted with the candles, for example, here the bottom session produced a high volume Doji, a clear reversal signal. The action that followed this Doji confirmed this signal.
There was a low first in February, the session ended with high volume and green.
There was a lower low in March (left shoulder), the action ended with relatively high volume and green. The bullish signal comes from the fact that bearish volume is dropping, not present.
The final low came in 7-April (head) and this session also ended green with high volume. The bottom is in.
The action later went on to produce an inverted Head & Shoulder pattern, another reversal signal fully confirmed.
After a small retrace, we will see additional growth.
These candles, these indicators, these signals and patterns help us predict where the market is headed next.
Short-term, as in days or maximum a week or two, anything goes. There can be a small drop or whatever, long-term, it is going up. Based on the signals coming from this chart.
Knowing this, we can buy, we can hold and we can trade.
It is not easy, but everybody can learn this craft if they have what it takes.
Not everybody can be a professional football player, not everybody can do acrobatics on a motorbike, but it can be done by anybody who puts enough time, heart and effort in knowing how to get it done.
The "intelligent investor" is for those that have no time or simply don't want to learn how the market works. It is ok, it is a tool and can be used successfully, but does not mean that timing the market is impossible, it simply means that most people can't or choose not to do so.
Now, tell me again about your random walk.
Namaste.

INJ Update🔥 INJ/USDT Weekly Chart Update
Chart Structure:
INJ is currently bouncing from the lower boundary of a multi-year descending wedge, a historically bullish pattern. The price has respected this structure well, showing multiple rejections at both the support and resistance trendlines.
🔍 Current Price: $12.24
🟢 Potential Upside: 298%
🎯 Target: ~$33.00
🛡️ Key Support: $8.50 zone (wedge support)
⚠️ Key Resistance: $25.00–$33.00 (wedge top)

Injective | INJ & AvalonThe price of Injective 8 dollar today with a 24hour trading volume of 69 million dollar. This represents a 13% price increase in the last 24 hours and a 29% price increase in the past 7 days. With a circulating supply of 80 Million INJ, Injective is valued at a market cap of 640 million dollar.
Injective is a blockchain built for finance. It is an open, interoperable layer1 blockchain powering next gen DeFi applications, including decentralized spot and derivatives exchanges, prediction markets, lending protocols..
Injective is upgrading its Avalon mainnet with overwhelming community support. The upgrade aims to enhance L1 scalability, achieve sub-second block generation time, and implement PoS delegation transformation.the upgrade will optimize transaction processing speed, network efficiency, and security within the Injective ecosystem
Inj price is up 400% since we posted the first analysis on January and it tries to recover as fast as possible. most indicators sending a buy signal and the volume looks strong too

INJUSDT - Monthly chart telling everything!A nice bounce occurred as soon as it touched the legendary support — the primary trendline and the grey zone.
Just look at the price behavior every time it approaches this rectangle.
You'll notice that, based on the Elliott Wave Impulse, Wave 4 has likely completed, and we’re now entering the final impulsive leg — "Wave 5"
$100 is a very modest target in the long term.
Best regards Ceciliones 🎯
