USDINR (U.S.Dollar / Indian Rupee) Currency Analysis 29/03/2021on a bullish impulsive wave we can see there exist a Hidden Bullish Divergence with MACD which is the sign of trend Continuation, followed by a Milled Bullish Divergence
there total of 2 Targets Defined by Fibonacci projection,
79.50 Rs seem to be a good target for the end of 2021
INR
Copper (COPPER/INR) Commodity Analysis 18/07/2021 Technical Analysis:
As you can see, there exist a hidden Bullish Divergence with MACD which is the sign of bullish trend continuation as Copper has started its bullish wave since March 2020. It is moving in an ascending channel. We draw Fibonacci retracement from the low to the top of last impulsive wave which are defined as the Fib levels on chart. The commodity fell to 78% Fibonacci Retracement and it is consolidating and accumulating on Fibonacci Golden Zone currently. we believe this commodity is getting ready to shoot to the higher targets which are defined by Fibonacci Projection tool of the past wave.
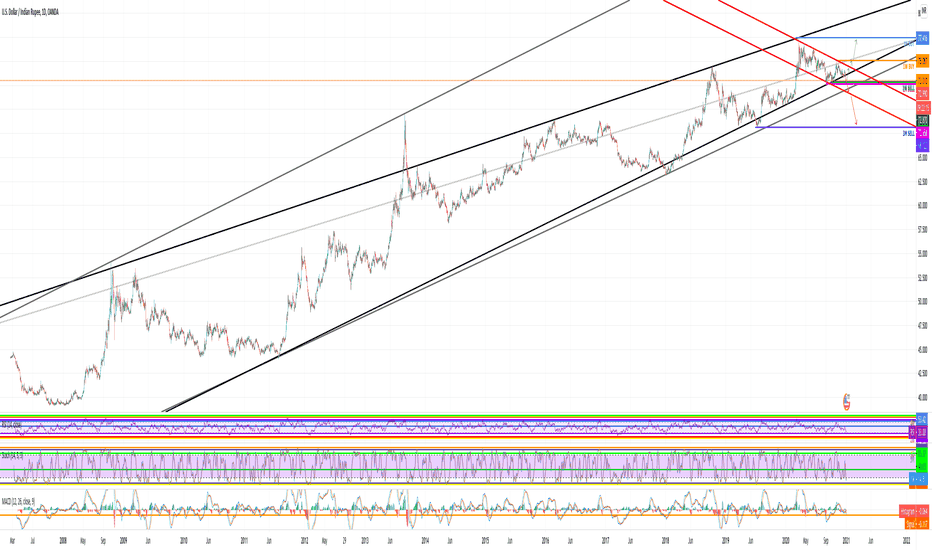
USDINR STRONG IMPORTANT LEVELHello friends,
First, I love India and the Indian people. I made an analysis for the Indian rupee and I think it is on a very important level now. You see the huge rising channel, in which a small falling one is formed. I have indicated the important levels on monthly and weekly charts, which were just hit. We saw a strong rejection from these levels, which means that the price is struggling to fall down further. If the daily candle closes today with a bullish candlestick pattern, I drew the path upside. However, my opinion is that we would only make a price correction in order to break those levels and fall further. Downside levels are really strong and if those are broken we might see a massive crash of the price. I advise you to follow the fundamental analysis of the Indian economy because it is an integral part of this trade. I will also upload pictures under this trade in order to see closer daily candle and fibonacci levels. I will update this trade and follow it closely!
This information is not a recommendation to buy or sell. It is to be used for educational purposes only.
Namaste! I wish you all the best and bags of profits during the new year.
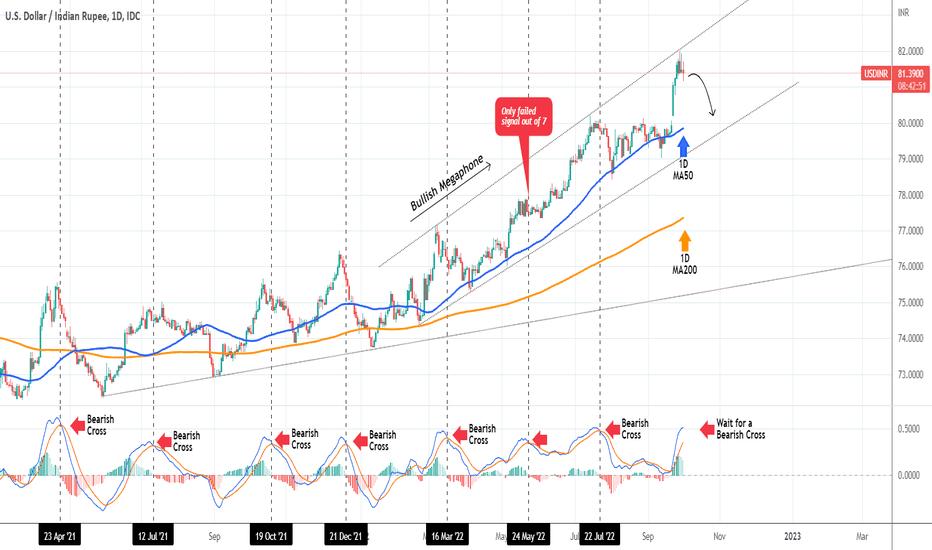
USDINR Sell when the MACD gives a Bearish CrossThe USDINR pair has been trading within a Bullish Megaphone since February 21 2022. Just 2 days ago, the price hit the top (Higher Highs trend-line) of this pattern and got rejected. We may see a pull-back towards the 1D MA50 (blue trend-line) or even the bottom of the Megaphone.
The best confirmation to take that sell trade would be to wait for the 1D MACD to form a Bearish Cross. As you see, since April 23 2021 all seven MACD Bearish Cross occurrences have delivered substantial Lower Lows on the short-term, except for one time (May 24 2022).
-------------------------------------------------------------------------------
** Please LIKE 👍, SUBSCRIBE ✅, SHARE 🙌 and COMMENT ✍ if you enjoy this idea! Also share your ideas and charts in the comments section below! This is best way to keep it relevant, support me, keep the content here free and allow the idea to reach as many people as possible. **
-------------------------------------------------------------------------------
You may also TELL ME 🙋♀️🙋♂️ in the comments section which symbol you want me to analyze next and on which time-frame. The one with the most posts will be published tomorrow! 👏🎁
-------------------------------------------------------------------------------
👇 👇 👇 👇 👇 👇
💸💸💸💸💸💸
👇 👇 👇 👇 👇 👇
USDINR - A Triangle PossibilityUSDINR.
There is a possibility for a triangular formation on this pair based on the idea that all the waves have a 3 wave structure in the form of a-b-c. In such case, the price will be forming another bullish wave following a breakout. The analysis is based on the Elliott Wave Theory.
BTCUSDT 1 Week Chart Demand & Supply Zones#Bitcoin #BTC 1 Week #Chart Demand and Supply Levels.
Bullish Supply Range ( Go Long) - USD 17,698/-
Bearish Supply Range ( Go Short) - USD /- to USD 26,949/-
#bitcoin #btc #cryptocurrency #crypto
Total BTC Longs - 104019.50/-
Total BTC Short1,837.6/-
Current Status - Movement Towards Bull Run.
USDINR : Elliott wave Analysis USDINR is in its 5th wave as per my Elliott wave analysis. Wave#3 was extended, so the wave 1 should be = wave 5, with this assumptions I think the USDINR will go upto 81.80 are before deciding further direction.
USDINR - Approaching resistance zoneAfter showing a sharp fall early last week, USDINR has again started its upward journey. It is slowly approaching a strong resistance zone. This zone lies between 79.69 - 79.82. A breakout of this will clear its path towards 80.00 and then towards the recent all time high of 80.20.
However, a strong rejection of this level might mean a fall back to 79.00 levels.
So, if you are planning a fresh entry, price action in the region of 79.69 - 79.82 is an area to watch for.
Ethereum Intraday BreakdownlETH has broken down and retested in the 15-minute time frame, therefore may undergo a correction in the very short term. Trade is supported by Resistance Nearby.
Risk Reward Ratio - 2:1
SL is placed Above the Resistance zone & the upper trendline. The target is placed near support.
Ethereum Intraday Breakout TradeETH has broken out and retested in the 15-minute time frame, therefore may undergo a reversal rally in the very short term. Trade is supported by Supports Nearby.
Risk Reward Ratio - 2:1
SL is placed below the support zone & the lower trendline. The target is placed near resistance.
USDINR - Short-term trend looks downUSDINR is forming lower-lows and lower-highs. Same is the case with RSI.
I see the upward side strong resistance zone remains between 78.05 - 78.10. Till the time 78.10 is not broken on the upside, I see we may see some bearish to sideways trend in USDINR during next few days.
Bitcoin (BTC/USDT) Price AnalysisBTC has been on a downtrend and the fall was severe in the recent past, As of now the price has recovered a little bit and is above the major support level of 29500$.
As long as the price stays above the same we can expect the fall to stop and recover. But if the price candle closes below this level we can expect more pain in Bitcoin.
Supports below are at 24k and 19k. In case you are looking to invest in crypto, Deploy small amounts/partial amounts of the capital now and in further dips at support levels. For trading i am planning to short below 29500 (Weekly Candle Close).
DYOR Research before trading or investing. Not Responsible for P&L. Only for educational purposes.
Bitcoin / USDT Price AnalysisBTC Has corrected and reached the bottom trendline, Now it looks to take support in the trendline. Both The trendlines marked in the chart act as good supports.
If the trendlines are broken we can expect a downside towards 30000$, If the trendlines act as a good reversal point we can expect a short-term rally towards 44000$.
DYOR before investing not responsible for P&L.
NIFTY50 Price Analysis - Medium to Short TermNifty50 index has been in the price range for nearly 6 months and is under high volatility due to variety of news flows.
As of now Nifty 50 is near major resistance and any significant breakout and close above it will cause a rally while any reversal will cause a correction for the short term.
A decisive Breakout is must for the bulls to continue in dalal street.
Any adverse news will also affect its rally or correction in the medium to short term.
DYOR Own research before Trading/Investing. Not responsible for P&L.
Bitcoin BreakoutBitcoin has broken out from a medium-term consolidation and is now ready to go for a rally in the medium term. It has broken out both Trendline and Price Resistance of 45k.
Traders can enter around 46850 (close of the previous bull candle) or wait for the price to retest and enter around 45500. Stop Loss to be placed below both Trendline and price support of 44k. Maintain Proper Risk Reward Ratio. Bitcoin has to take out Major and Minor Resistances mentioned in the chart to continue the bullish momentum and rally forwards, so it is wise to book profits near resistances when your risk-reward ratio has been achieved.
Trade 1:
Long @ 46850
SL @ -7%
Target @ 10%
Risk Reward Ratio 1:1.5
Trade 2 (Safe Entry):
Long @ 45500
SL @ -6.25%
Target @ 12.5%
Risk Reward Ratio 1:2
Note: Not Responsible For P&L. Only for educational purposes. DYOR Before Trading.
BTC/USDT Major Breakout PossibilityBitcoin is at a vital price point.
44k appears to be a major resistance but there has been a breakout in the hourly time frame. So there would be wild price move either on upside or downside. BTC /USDT has to either breakout of 45k and close to rally further or breakdown and fakeout. Either one has to happen in the near future (In a few hours). So be ready to catch the wild move.
Long on close above 45350
Short on close below 43400
Risk Reward Ratio 1:2 or 1:3
Check out my related trade idea for previous breakout.
DYOR Before Trading/Investing. Not Responsible for P&L.


