NQ Power Range Report with FIB Ext - 7/9/2025 SessionCME_MINI:NQU2025
- PR High: 22923.00
- PR Low: 22900.50
- NZ Spread: 50.5
Key scheduled economic events:
10:30 | Crude Oil Inventories
13:00 | 10-Year Note Auction
14:00 | FOMC Meeting Minutes
Session Open Stats (As of 12:25 AM 7/9)
- Session Open ATR: 303.33
- Volume: 16K
- Open Int: 270K
- Trend Grade: Neutral
- From BA ATH: -0.8% (Rounded)
Key Levels (Rounded - Think of these as ranges)
- Long: 23239
- Mid: 21525
- Short: 20383
Keep in mind this is not speculation or a prediction. Only a report of the Power Range with Fib extensions for target hunting. Do your DD! You determine your risk tolerance. You are fully capable of making your own decisions.
BA: Back Adjusted
BuZ/BeZ: Bull Zone / Bear Zone
NZ: Neutral Zone
Inside Bar

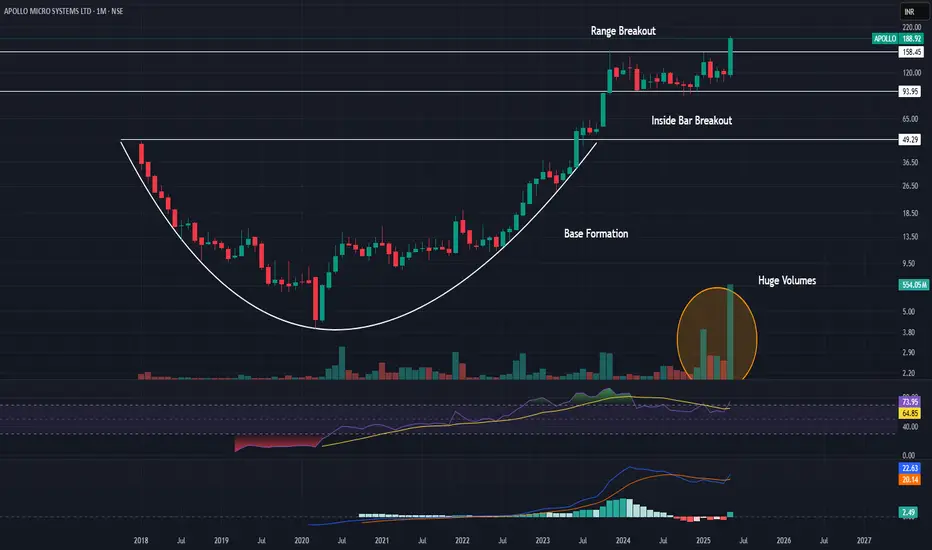
Flag Breakout in Apollo Micro Systems1. Inside Bar Breakout
2. Good Volume
3. Consolidation Breakout
4. RSI above 70
5. MACD signal turning green
FOMO & An Inside Bar Entry Into A Larger Head & Shoulder PatternAn handful of lessons in this video so hang on.
1) We take a look at the dangers that come with entering a trade too early & what you should do if you ever find yourself in that situation.
2) A discussion ion inside bars, what they are, how to trade them and an indicator that will help you spot them.
3) How to use that inside bar as an entry reason into a bigger head and shoulders pattern on the larger timeframe.
Please leave any questions or comments below!
Akil

Failed Wedge, New Setup. Is SUI About to Break Out?In my previous post about BYBIT:SUIUSDT , I mentioned a potential falling wedge pattern. However, the breakout above the 4.0040 resistance turned out to be a false breakout, and the price eventually dropped to the invalidation level at 3.5868. This made the setup invalid.
But despite the failed wedge breakout, BYBIT:SUIUSDT remains in a bullish trend overall. During the current consolidation, the price appears to be forming a new bullish pattern — a Descending Broadening Wedge (DBW).
This pattern typically starts with low volatility and gradually widens. Once price reaches its lower boundary, it often experiences a strong breakout to the upside.
Let’s break down the key price action in this DBW setup:
Price is moving within a Descending Broadening Wedge and is currently near the lower boundary of the pattern.
It’s also sitting around a key support level at 3.4833.
A rejection candle formed right at 3.4833, showing the market’s response to this support area.
A reversal confirmation would come if the price breaks above 3.6102.
A bullish divergence is also visible — price is forming lower lows, while the stochastic indicator is forming higher lows.
Based on these five price action signals, it seems that buyers are still in control, even though short-term volatility has created a series of lower lows.
That’s why I still believe BINANCE:SUIUSDT has more room to go up. What’s your take on this?

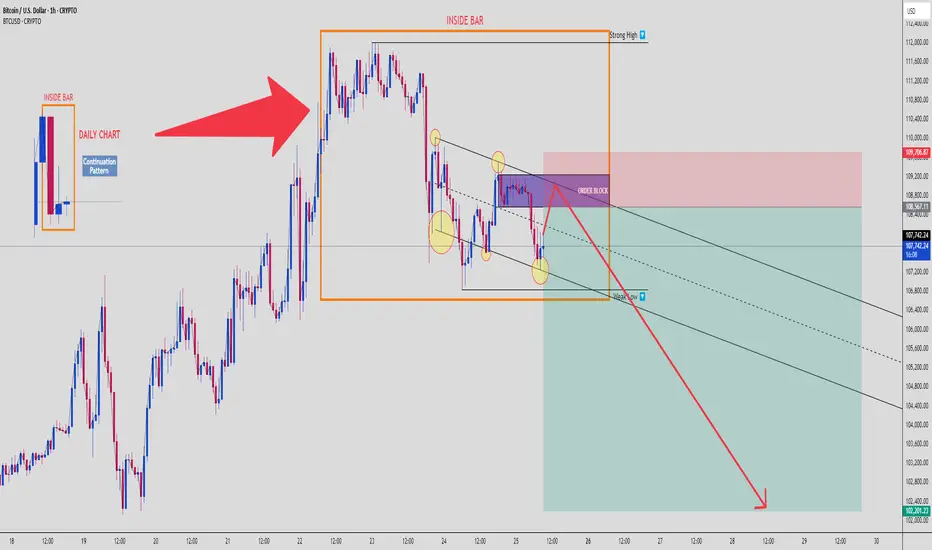
BTCUSD: Inside Bar Trap + Order Block Rejection Targeting $102K📉 Bitcoin | SMC Breakdown | 1H Chart
Welcome to a clean Smart Money setup, where retail gets baited and Smart Money gets paid. Let’s break down what’s happening on BTCUSD, 1H chart, using multi-timeframe confluence and Smart Money Concepts. 👇
🗓️ 1. Daily Chart Confluence
We start with a Daily Inside Bar Pattern – a classic continuation setup, often used by institutions to trap traders before expansion. BTC ranged tightly, then broke to the upside to grab liquidity, not start a rally.
🟥 Daily High = Liquidity Pool
🟧 Inside Bar Range = Manipulation Zone
This is the trap zone.
🧱 2. Order Block Rejection (1H)
Price tapped a clearly defined Bearish Order Block in premium pricing, just above the mid-range of the Inside Bar.
💥 Reaction confirmed:
Rejection candles from OB
Structure respecting downside bias
Fakeout = Fuel for downside expansion
📉 3. Bearish Continuation Structure
Price is moving within a descending channel, respecting internal supply zones. Each lower high is met with supply pressure, and internal lows are swept before moving lower.
You’re looking at a high-probability continuation move toward the weak low marked near $102,200.
🧊 4. Weak Low as Final Target
This level is a classic liquidity magnet – weak lows = retail stop clusters = Smart Money target.
We expect BTC to:
Tap OB
Reject with minor pullback
Break structure
Fill imbalance and target weak low
It’s a beautiful setup if managed correctly.
🧠 5. Psychology & Trap Narrative
Retail is:
Buying the breakout of Inside Bar
Placing stops under weak lows
Ignoring the OB rejection
Smart Money is:
Selling from OB
Riding the imbalance
Grabbing liquidity from below
This is where you flip from reaction-based trading to narrative-based execution.
🧮 6. Trade Setup Summary
📍 Entry Zone: $108,500–$109,700 (OB zone)
🔐 Stop Loss: Above $109,800 (invalidate OB)
🎯 Target:
TP1: $106,500
TP2: $104,000
TP3: $102,200 (Sell-side Liquidity Sweep)
⚖️ RRR: Approx. 1:4 to 1:5 depending on entry
⚠️ Risk Management:
Do not overleverage.
This setup rewards patience and narrative confirmation, not emotional entries. Wait for OB confirmation and rejection.
📈 If this hits, it’s a chart you screenshot and study again and again.
💬 Comment “INSIDE BAR MASTERCLASS” if you’re watching this play out live. Share with your trading circle.
Clear DayTrading strategy video. The "Inside Bar"🔉Sound on!🔉
📣Make sure to watch fullscreen!📣
Thank you as always for watching my videos. I hope that you learned something very educational! Please feel free to like, share, and comment on this post. Remember only risk what you are willing to lose. Trading is very risky but it can change your life!

NQ Power Range Report with FIB Ext - 1/15/2025 SessionCME_MINI:NQH2025
- PR High: 20977.00
- PR Low: 20938.50
- NZ Spread: 86.0
Key scheduled economic events:
08:30 | CPI (Core|YoY|MoM)
10:30 | Crude Oil Inventories
Previous session printed volatile swings raising emotional value of participants
- Holding auction inside 21000 range
- Daily print advertising to indecision narrative
- Another AMP temp margin increase for expected economic news event vol spike
Session Open Stats (As of 12:35 AM 1/15)
- Weekend Gap: N/A
- Gap 10/30/23 +0.47%
- Session Open ATR: 372.13
- Volume: 17K
- Open Int: 252K
- Trend Grade: Bull
- From BA ATH: -6.6% (Rounded)
Key Levels (Rounded - Think of these as ranges)
- Long: 22667
- Mid: 21525
- Short: 19814
Keep in mind this is not speculation or a prediction. Only a report of the Power Range with Fib extensions for target hunting. Do your DD! You determine your risk tolerance. You are fully capable of making your own decisions.
BA: Back Adjusted
BuZ/BeZ: Bull Zone / Bear Zone
NZ: Neutral Zone

TATA POWER swing Reversal from supportforming inside bar at support & even RSI is below 30
swing trade
looks good R:R
entry 385
SL 374
TG1 400
TG 408

ASTRAL swing reversal stock is forming inside bar candle stick pattern at the support & the RSI is below 30
likely good R:R
For a successful entry, we should ideally see a strong 1day candle on our chart—it’s crucial to use that timeframe.
Following the breakout candle of inside bar, the ideal entry point would be after a consecutive candle that breaks above the previous candle
As always, remember to do your own research before making any investment decisions!

Syrma inside bar setup with poteicial breakout trade ideasyrma chart is showing regular inside bar formation, indicating a consolidation phase. the current price is near the upper range, and i believe could spike and break this range.
setup inside bar+ potential breakout

NQ Power Range Report with FIB Ext - 10/18/2024 SessionCME_MINI:NQZ2024
- PR High: 20413.50
- PR Low: 20377.00
- NZ Spread: 81.5
No key scheduled economic events
Quick auction return back to Tuesday lows
Session Open Stats (As of 2:15 AM 10/18)
- Weekend Gap: N/A
- Session Gap 7/24: -0.32% (open > 19946)
- Gap 10/30/23 +0.47% (open < 14272)
- Session Open ATR: 298.31
- Volume: 25K
- Open Int: 248K
- Trend Grade: Bull
- From BA ATH: -3.7% (Rounded)
Key Levels (Rounded - Think of these as ranges)
- Long: 20954
- Mid: 19814
- Short: 17533
Keep in mind this is not speculation or a prediction. Only a report of the Power Range with Fib extensions for target hunting. Do your DD! You determine your risk tolerance. You are fully capable of making your own decisions.
BA: Back Adjusted
BuZ/BeZ: Bull Zone / Bear Zone
NZ: Neutral Zone

Jindal stainless steel-Bullish Swing- Is this reversal signal???
12.08.2024
Buy 694
Target 807
Stop Loss 616
Risk Reward- 1:1.5
1. Inside bar breakout
2. Price rejection from both parallel and horizontal support zone
3. Double bottom formation.
4. RSI from over sold to normal bullish level(40)
5. Good increasing volumes in bullish movement
6. Price rejection from 0.618 Fibonacci level
7. 200 EMA Rejection
NSE:JINDALSTEL

Nestle-Bullish Swing- Will this be bullish swing? NSE:NESTLEIND
21.08.2024
Buy-2551
Target 01-2643, Target 02-2761
Stop Loss-2447
Risk Reward- 1:2
After the good uptrend from March 2023, price is
under consolidation from Beginning of January
2024. Hopefully it us under the formation of
Bullish Flag and trying to provide the big breakout.
1.Breakout- Inside Bar
2.Trend- Uptrend in higher TF & trying to break the downward range in shorter time frame.
3.KeyLevel- second time rejection from resistance converted to support zone.
4.Volume- Average volumes. Need more & above average volumes in next sessions for more rewards
5. EMA- Perfect rejection from 200 EMA. Price is above 21 EMA & 50 EMA
6. Chart Pattern- bullish flag in the border view
7.RSI- Strong bounce from 30 RSI. Still very good potential for more movement.

CentralBank-Swing Bullish- Will this support is strong enough?! NSE:CENTRALBK
19.08.2024
Buy 60
Target 66
Stop Loss 56
Risk Reward- 1:1.5
1. Inside bar breakout
2. 200 EMA perfect rejection
3. Price bounced from strong key level(Resistance turned to support)
4. After good uptrend price under consolidation from last 5 months
5. RSI bounced from over sold zone with double bottom.
6. Good volumes in breakout candle

DLF- Bullish Swing- Very strong this time!! NSE:DLF
16.08.2024
Buy 870
Target 934
StopLoss 826
RiskReward- 1:1.5
1. Inside bar breakout in weekly & daily TF
2. After very good uptrend price is under consolidation from last 4 months.
Today very good breakout found with very good volumes
3. Found decreased volumes in last few sessions
4. Rejection from 200 EMA and price crossed above 21 & 50 EMA
5. RSI indicates bullish view
6. Price rejected from strong key level

Axis Bank-Bullish Swing- Strong Supply zone!!
12.08.2024
Buy 1163
Target 1260
Stop Loss 1115
Risk Reward- 1:2
1. Inside bar breakout after good consolidation
2. Weekly Doji breakout
3. 200 EMA Rejection
4. Price rejected at 0.618 Fibonacci level
5. Gradual decrease in volumes in downtrend.
6. Strength of bear candles reduced.
7. RSI has reached over sold and now recovered to 40
8. Price rejection at resistance turned to support zone
NSE:AXISBANK

KarurVysa Bank-Bullish swing- History needs to repeat!! NSE:KARURVYSYA
21.08.2024
Very good upside bullish movement from last one year.
Currently it is moving in a dedicated ascending channel. Stock has returning to upside without creating HL this time.
Buy- 227
Target- 245
Stop Loss-209
Risk Reward- 1:1
1.Breakout- Inside bar & Doji
2.Trend- Upward range/trend
3.KeyLevel- Just below resistance. Need to break previous resistance for more rewards
4.Volume- Very good above average volumes in
breakout candle. Previous sessions analysis signs of bullish signals
5. EMA- Price above 21 % 51 EMA after rejecting once from 200 EMA
6. Pattern- Ascending channel with creating multiple HH & HL

Indraprastha Gas Ltd-Bullish swing- Will this trend continue?
30.07.2024
Buy 553
Target 589.5
Stop Loss 517
Risk: Reward - 01:01
1. Inside candle breakout in day TF
2. Upward channel and previous resistance breakout
3. Retracement after breakout at good FVG and thus resistance turned to support
4. Oil & Gas sector is in good momentum
5. Good Volume breakout
6. Price rejection from 21 EMA NSE:IGL

Bharath Forge-Swing Trade-Inside Bar- Will trend continues??? NSE:BHARATFORG
09.08.2023
Buy 1647
Target 1803
StopLoss 1494
1. Inside bar breakout
2. Stock was in good uptrend. Now consolidation is happening
3. Double bottom formation & 0.382 Fibonacci level rejection at same zone
4. Price has crossed 21 EMA & above 50 EMA
5. Volumes are good
6. Stock bounced from 35 RSI
7. Auto sector bounced back strongly

NQ Power Range Report with FIB Ext - 9/10/2024 SessionCME_MINI:NQU2024
- PR High: 18741.00
- PR Low: 18696.00
- NZ Spread: 100.5
No key scheduled economic events
Maintaining Friday's range at ~50% retracement
Session Open Stats (As of 12:45 AM 9/10)
- Weekend Gap: N/A
- Session Gap 7/24: -0.32% (open > 19946)
- Gap 10/30/23 +0.47% (open < 14272)
- Session Open ATR: 403.17
- Volume: 28K
- Open Int: 243K
- Trend Grade: Bull
- From BA ATH: -11.2% (Rounded)
Key Levels (Rounded - Think of these as ranges)
- Long: 20954
- Mid: 19814
- Short: 17533
Keep in mind this is not speculation or a prediction. Only a report of the Power Range with Fib extensions for target hunting. Do your DD! You determine your risk tolerance. You are fully capable of making your own decisions.
BA: Back Adjusted
BuZ/BeZ: Bull Zone / Bear Zone
NZ: Neutral Zone

Tata consumer-Bullish Swing- Right time to enter!! NSE:TATACONSUM
22.08.2024
Buy-1202
Target-1246
Stop Loss-1157
Risk Reward- 1:1
1.Breakout- Inside bar breakout
2.Trend-Consolidation after uptrend
3.KeyLevel-Breakout at Resistance turned to support & parallel support also
4.Volume- Good above average volumes
5. EMA- 21 EMA Rejection & above 50 EMA
6. RSI-Bullish indication after consolidation
7. Fibonacci- Very good rejection at 0.382 Level

Dmart- Bullish Swing-Will ascending channel continue its path? NSE:DMART
20.08.2024
Buy- 5090
Target-5275
Stop Loss-4883
Risk Reward-1:1
Price is creating multiple HH & HL after a good breakout in March 2024
Price is again approaching all time high which has previously reached in 2021.
1.Breakout- Inside bar
2.Trend- Upward range
3.KeyLevel- Bounced from Key support level
4.Volume- Good volumes in breakout candle in last few sessions
5. EMA- 21 EMA Rejection & price above 50 EMA
6. RSI- Bullish indication

OAL potential breakout - Strong prior uptrend.
- Resting on 10EMA.
- Volume contraction.
- Inside bar formation.
