BTC Smart money Bullish don’t be fooled !**BITCOIN MICROSTRUCTURE ANALYSIS: Institutional Accumulation Through Order Flow Divergence**
The current BTCUSD market structure presents a compelling case study in institutional accumulation mechanics, utilizing sophisticated order flow analysis to identify smart money positioning ahead of retail market participants.
**Technical Infrastructure Analysis**
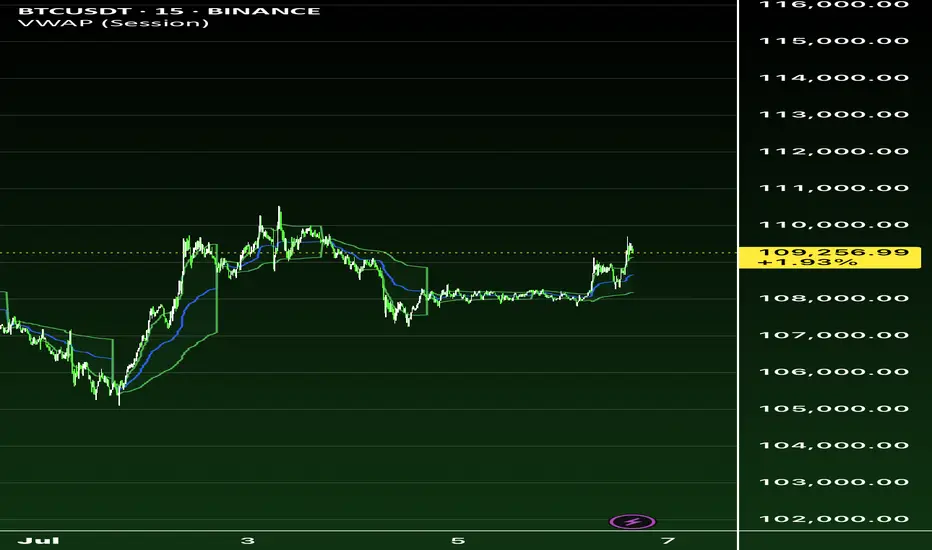
The convergence of multiple analytical frameworks reveals a coordinated accumulation pattern across various timeframes and exchanges. Volume Profile Analysis on the primary chart indicates substantial institutional interest between $108,000-$110,000, with the Point of Control (POC) establishing a robust foundation for directional bias determination.
**Order Flow Microstructure Dynamics**
The Bitfinex footprint data reveals critical microstructural imbalances that traditional technical analysis often overlooks. The current candle displays a **-4.52 delta** with price resilience at $109,480, indicating aggressive institutional absorption of retail selling pressure. This negative delta combined with price strength represents a classic **Wyckoff accumulation signature** - large participants are utilizing iceberg orders and hidden liquidity pools to build positions without triggering algorithmic momentum systems.
**Smart Money Positioning Mechanics**
Three key indicators confirm institutional accumulation:
1. **Cumulative Volume Delta (CVD) Divergence**: Both spot and perpetual markets showing negative CVD (-95.77K spot, -50.05K perp) while price maintains elevation, indicating off-exchange accumulation through dark pools and cross-trading networks.
1. **Open Interest Expansion**: The increase from 77.89K to 78.75K contracts with minimal funding rate pressure suggests fresh institutional capital rather than retail speculation.
1. **Volume Profile Concentration**: The heatmap reveals 105.85M in trading volume concentrated within the $108K-$110K range, representing systematic accumulation rather than random market activity.
**Institutional Arbitrage Mechanics**
The funding rate dynamics (0.001783 with periodic negative spikes to -0.000753) indicate sophisticated carry trade positioning. Institutions are likely utilizing the negative funding periods to establish leveraged long positions while simultaneously hedging through spot accumulation, creating a self-reinforcing feedback loop.
**Market Microstructure Implications**
This accumulation pattern typically precedes **Phase C markup** in Wyckoff methodology, where institutional players transition from absorption to active price discovery. The thin volume profile above $112,000 suggests minimal resistance once the breakout occurs, creating conditions for rapid price expansion toward the $113,600 target.
**Risk-Adjusted Positioning Strategy**
The confluence of volume profile analysis, order flow dynamics, and institutional positioning indicators supports a high-probability long bias with the following parameters:
- **Entry Zone**: $109,000-$109,200 (current accumulation range)
- **Risk Management**: Stop loss at $108,200 (below institutional POC)
- **Target Sequence**: $110,653 → $112,000 → $113,600
- **Confidence Level**: 90% (upgraded from initial 75% based on footprint confirmation)
**Forward-Looking Market Structure**
The sophisticated nature of this accumulation pattern suggests institutional preparation for a significant directional move. The combination of hidden liquidity absorption, funding rate arbitrage, and volume profile concentration creates optimal conditions for sustained upward momentum once the $110,000 psychological resistance is cleared.
This analysis exemplifies how advanced order flow techniques can provide substantial informational advantages over traditional technical analysis, particularly in identifying institutional positioning ahead of retail market recognition.
*Position sizing should remain within 3-5% of total portfolio allocation, with dynamic risk management protocols adjusted based on evolving market microstructure conditions.*
Institutional
eurusd outlook Eurusd overall bullish HTF, however I do identify alignments within wyckoff distribution. Keeping an eye on the 4hr sponsored candle, ltf fvg at 1.62 area for my next possible bullish swing into the weekly high. Until then let's see if the market can support short term bearish reversal into the area of interest.

8 April Nifty50 important level trading zone #Nifty50
99% working trading plan
C1👉Gap up open 22318 above & 15m hold after positive trade target 22510, 22670,
C2👉Gap up open 22318 below 15 m not break upside after nigetive trade target 22142,
C3👉Gap down open 22142 above 15m hold after positive trade target 22318, 22510
C4👉Gap down open 22142 below 15 m not break upside after nigetive trade target 22078
C5💫big gapdown open 22070 above hold 1st positive trade view
C6💫big Gapup opening 22673 below nigetive trade view
📌For education purpose I'm not responsible your trade
More education following me

$NASDAQ:ILMN - analysis of annual cot levelsNASDAQ:ILMN
Please remember that this idea does not constitute investment advice.
After a personal analysis of the institutional value of the COT, buy and sell program levels are outlined. Since the asset is at its minimum, the idea is to wait for the price to head inside the buy program, wait for a swing to form in the direction of the target level (the first sell program) and open the trade at the break of this. The position is medium-term (from 1-2 weeks to 1-2 months); without financial leverage and the maximum profit area is that outlined by the sell program. Personally I do not use stop loss as the trade does not involve the use of financial leverage, however if a level for the stop loss were to be identified, this would be below the buy program.
For any clearly ask me.

$NASDAQ:ACHC - analysis of annual cot levelsNASDAQ:ACHC
Please remember that this idea does not constitute investment advice.
After a personal analysis of the institutional value of the COT, buy and sell program levels are outlined. Since the asset is at its minimum, the idea is to wait for the price to head inside the buy program, wait for a swing to form in the direction of the target level (the first sell program) and open the trade at the break of this. The position is medium-term (from 1-2 weeks to 1-2 months); without financial leverage and the maximum profit area is that outlined by the sell program. Personally I do not use stop loss as the trade does not involve the use of financial leverage, however if a level for the stop loss were to be identified, this would be below the buy program.
For any clearly ask me.

EUR/USD Long Utilizing 4H EB (Equilibrium Block)Since the market opened on Sunday EU has been on an uptrend. It also broke past the previous 2 week's resistance/supply zone and retested it using it as a demand zone on Tuesday morning during the New York AM session. Then proceeds to create a strong bullish candle during the NY PM session that same day. This then starts the process for the equilibrium block. The way I identify EBs is by making sure there is a 3 candle model. The first candle must be a strong bullish or bearish candle while the second candle is the opposite/a retest and then the third candle must be an engulfing candle. So for this example it is a bullish set up so the 3 candle model was bullish bearish then bullish engulfing. If it was a bearish set up it would be bearish bullish then bearish engulfing. I placed my stop loss under the smallest wick on the engulfing candle and gave it room to breath by putting it at an institutional level. It took over a day but this trade ended up hitting all profit targets!
Trade Details:
Entry Point: 1.06257
Stop Loss: 1.05995
Profit Target 1: 1.07282
Profit Target 2: 1.07965
Profit Target 3: 1.08242

EUR/USD Long Utilizing 1H FVGSince Sunday March 2nd 2025 EU has been on an uptrend. A FVG formed on the 1 hour timeframe at 4am eastern time. It was then triggered/retested between the hours of 6 and 7am eastern time. The profit targets were determined by past buy side liquidity that hadn't been touched yet.

DGKC ACCUMULATION BOX TRADE IDEADGKC IS TRADING IN A ACCUMULATION BOX. HALF YR RESULT WILL BE ANNOUNCED TODAY. EXPECTING GOOD RESULTS WHICH WILL BREAK THE ACCUMULATION BOX.
THE REAL REISTANCE IS AT 108.20 WHICH IS THE WEEKLY PREVIOUS HIGHER LOW AFTER WHICH THE STOCK WENT DOWN to all time low.
HOWEVER THERE IS A DEVIATION FROM 109 TO 112.
AT THE BREAKOUT AT 112 WITH LARGE VOLUMES will start the uptrend
A retest might be possible at the top of accumualation box at 112. Watch on 5m and 15m The EMA 21 is currently acting as a support.
the next quick target will be 116 . If the stock gives a strong breakout above 116 then 122 looks like the next target.

Is Liquidity Zones The Hidden Battleground of Smart Money In every market move, liquidity zones are the battlefields between buyers and sellers. Understanding these zones is crucial for spotting reversals and breakouts before they happen.
What Are Liquidity Zones?
High Liquidity Areas, Where large orders are placed, typically around key support/resistance or round numbers.
Low Liquidity Areas. Where price moves quickly due to fewer orders, often creating price imbalances.
Why Liquidity Matters
Smart money (institutions) seeks liquidity to execute large orders without massive slippage. Their footprints appear as wicks, sudden volume spikes, or rapid price reversals.
Spotting Liquidity Traps
False Breakouts, Price pierces a key level, triggers stop losses, and reverses quickly.
Stop Hunts, Sudden price spikes beyond a key level, only to return inside the range.
rading Strategy Example
1. Use volume profile or heat maps to spot high-interest price areas.
2. Wait for Reaction, Enter only after confirmation (e.g., a sharp wick or order flow shift).
3.Risk Management, Place stops beyond liquidity zones to avoid getting trapped.
Master liquidity zones, and you'll start seeing the market through the eyes of institutional players.

Scalper’s Paradise – Insights on Evolving Technical LevelsThis is my first post, and I’ll do my best. However, I might not know how to update the post or even view the comments. So, in advance, I apologize for any issues that may arise. :)
Now, let’s dive in with a snapshot of a 1-minute chart. Here, you can see the developing VPOC line along with the VWAP line. These aren’t just random indicators—they are volume-based indicators, meaning the data comes directly from the exchange system. This makes them highly relevant for traders, as they provide crucial insights into market activity.
But what exactly does this mean?
The developing VPOC line (Volume Point of Control) represents the price level with the highest traded volume of the day. It is often displayed when using a Volume Profile.
On the other hand, the VWAP (Volume Weighted Average Price) is a standalone indicator that calculates the average price based on volume. Essentially, the VWAP line divides the chart into two key areas:
Above VWAP → Favorable for short positions (or considered expensive for long positions).
Below VWAP → Favorable for long positions (or considered expensive for sellers).
These levels help traders gauge price efficiency and market sentiment throughout the day.
Insights from My Time as an Institutional Junior Trader
As a junior trader in the institution, my job was simple: follow orders. This meant I was told what to trade and in which direction—I was responsible for executing the trades at the best possible price.
Now, as an institutional trader, I execute thousands of trades a day, which naturally results in an average price due to the sheer number of trades executed at different price levels.
So, how is my execution evaluated throughout the day? Exactly—against the Volume Profile and VWAP.
For example, if I need to buy a large quantity and my executions are concentrated in the lower area of the VWAP-divided chart, it means I’ve done a good job—I’ve secured a better-than-average price. On the other hand, if my trades are mostly in the upper area, it means I haven't performed well, as I couldn’t even beat the average price.
Let’s put on our thinking cap and bring everything together.
Imagine you need to accumulate a long position, and you’ve been buying thousands of times, resulting in an average price.
Now, let’s assume you are an institutional junior trader, and your boss instructs you to buy. You’ve already accumulated 85% of the position, and your average price is in the lower area of the VWAP-divided chart. Suddenly, the price has risen, and you have the opportunity to buy the remaining 15% at the VWAP.
Would you take the trade? Of course, you would.
Why? Because 15% won’t significantly move your average price, and you’re still buying at a reasonable level.
And that’s exactly how institutional traders operate all the time. They are constantly evaluated against these key indicators (VWAP & Volume Profile)—just like I was.
How You Can Apply This as a Retail Trader
So far, we’ve discussed just a small aspect of trading, but now you understand that levels matter and that institutional traders think differently when it comes to buying.
While retail traders often focus on getting the best price, institutional traders prioritize average price. This fundamental difference leads to completely different trading styles.
Now that you know how institutions operate, you can start watching the key levels provided by indicators like VWAP and Volume Profile. These aren’t just static levels—they are developing levels, meaning you can use them multiple times throughout the day.
Monitor these key levels throughout the session.
Pay close attention to order flow when price approaches these levels.
Identify who is in control—buyers or sellers—so you can take action accordingly.
By combining these insights with the order flow, you can make more informed and precise trading decisions—just like the institutions do. 🚀
Sincerely,
Marco

#SMC Short idea for #BTC Bitcoin is getting close to a crucial liquidity zone where short traders' stop-losses are probably going to be activated. An entry here might draw a lot of stop-loss orders, which is something that Bitcoin frequently looks for. With a risk-reward ratio of 1:4 or higher, this setup presents a compelling chance for a short trade.

This Season is Different....Seriously, no "crypto guru" i've found mentions how BTC.D started high AND DIVED at the start of a btc-then-alt-season run.... NONE... meanwhile this season BTC.D and BTC only keep up with eachother...
What is different about this cycle?
My thoughts: institutions are heavily involved THIS RUN... they bought in during the bear season. They know how to **** most traders out. Thats what we have here...
They are coming for all these previous success story DEGEN's and their money.
Don't be next.
PS: im invested and DONT hope for what I'm seeing... IDK.

Is the move going to continue?The Commitment of Traders (COT) report currently indicates exceptionally light open interest among large speculators, while retail traders are beginning to shift towards selling. I find it particularly insightful to monitor the COT report when there is a notable sentiment shift among retail participants. Looking forward to analyzing Monday's data.

Analisa BtcUSD dengan FollowthetrendChart Analysis:
1. Zero Lag Trend and Multi-Timeframe Trend:
Multi-Timeframe Trend:
Lower timeframes (5 min, 15 min): Bullish
Higher timeframes (240 min): Bearish
Daily timeframe: Bullish
Overall, the price is in a mixed trend, with a potential pullback to a key support zone in lower timeframes.
Zero Lag Trend Indicator:
The red zone on the chart indicates bearish pressure near the resistance at 92,500.
The green zone signals strong support around 91,850-91,900.
2. Fibonacci Levels and Liquidity:
Fibonacci Auto Levels:
The 0.618 retracement aligns near 92,000, a strong potential support level for a pullback.
Liquidity Zones:
A previous high at 92,500-92,600 acts as a liquidity target where price may spike before reversing.
Long wicks show institutional activity and make these areas critical for SL and TP planning.
3. FU Candles and Imbalance:
A bearish FU candle is visible near 92,500, indicating trapped liquidity above this level.
Unfilled imbalance lies around 91,850, making it likely that price will test this area before continuing its trend.
Trade Setup Recommendation:
1. Entry:
Best Entry Zone: 91,850-91,900
This area is a strong support level based on Fibonacci retracement and unfilled imbalance.
2. Stop Loss (SL):
Place SL below 91,600, just under the support zone, to avoid stop-outs due to price manipulation.
3. Take Profit (TP):
TP1: 92,500 (close to immediate resistance and liquidity zone).
TP2: 92,800 (upper liquidity zone, providing a more significant target if the bullish trend holds).
4. Risk-to-Reward Ratio:
Minimum R
ratio: 1:3 or better to balance risk and reward effectively.
Reasoning Behind the Strategy:
Fibonacci Confluence:
The 0.618 retracement at 91,850-91,900 suggests a high-probability pullback zone.
Institutional Liquidity Zones:
Resistance at 92,500 indicates trapped liquidity, making it a prime TP area.
Zero Lag Trend Confirmation:
Higher timeframes support a long-term bullish bias, aligning with retracement and breakout targets.

BTC - Path of least resistance and maximum painI'm not a conspiracy nut but giving room for belief in conspiracy theories, let's say the entire crypto market is a "washing machine" for various fronts. It just doesn't have any practical utility right now, that makes the world a better and safer place. The possibilities are endless but let's just say it hasn't been leveraged for any noble cause, yet. Sakamoto Natoshi would be turning in his grave should he know what his noble invention was being used for, if indeed it was a noble act from the get go.
Bottomline, it has a shade to it's existence, and as such can only be construed to serve malicious intentions of governments, authorities and the rich.
So it is always bound to opt the path of least resistance and maximum pain, as far as common folk are concerned, i.e. acting against them.
Now stepping into reality, considering common folk, retail traders and institutions who are involved in this charade.
Common folk: I meet people constantly who have never heard of bitcoin, also people who learnt about it's existence just now in 2024!
A subset of this common folk with some grasp of how world economics work and an appetite for risk want a piece of the action.
Retail Traders: I'm not sure if the term "retail traders" also encompasses the so called "whales". I'm assuming not. So let's say everyone working with a portfolio value of 1BTC or less. From this category (at least the sensible and well educated) never expected what happened in the first 3 months of 2024.
But now that we are where we are, they also want a piece of the action(including myself), knowing very well they could be too late at the scene.
Institutions: All the hedge funds and their 60+ grandpa managers who do not understand technology are also now a part of this charade, in addition to various tech companies and their CEOs, playing we know it all.
"Apparently" the whole rally is attributed to the ETF inflows from said institutions. And somehow there is this sense of unshakable faith in the air, if these institutions are already invested, BTC is bound for the moon and it can never look back again. There are preposterous articles on how any price below 70k was a buy!
Everything mentioned so far isn't an established fact! Let's now turn to tangible facts we know, our dear charts! Hoping and praying to the good lord, that this data is also not fabricated.
The 12 month candle on the left is as big as it's ever gotten. We still have 7 months left to go until the candle closes. And looking at the volume, we are at 450k on this particular exchange, compared to an average of ~2 million on previous full candle.
Assuming half a million traffic per quarter, this volume does make a lot of sense but what it doesn't correlate to, is the ETF's inflows. If anything, it should be double or triple the average based on all the news about the kind of money that's been inflowing. Very skeptical!
If I were any sensible and should I consider myself in the position of a market maker, I see a lot of paths testing and breaking supports(the beaten path), rather than price discovery(the road not taken). Because,
-who dares to buy any further?!
-retail is already late to the party, don't want that portfolio eroding
-institutions are "supposedly" already invested, who are they going to sell it too? They should be idiots to buy it all over again all the way to 100k, coz if nobody wants to buy now, who's gonna buy at 100k?!
-halving has reduced the supply, there is less supply for the next 3 quarters than the previous 12 month candles and it makes sense to buy/sell lower again than at the 100k or 130k area
On the contrary, looking at the perspective of taking bitcoin away from the common folk's reach, it does make sense to drive the price into the 6 figures. But then again, if you take it away from the common folk's reach, how is the so called "evil system", that's basically designed to prey on simple minds, supposed to work?!
I know, I know, I'm rambling! The point is, I don't see this going to the moon any time soon! And I could be completely wrong about this and may have already fallen for the trap that's set for all of us! Time will only tell.
Heartfelt thanks to anyone who's managed to reached thus far, please leave a like if you did like the read or teach me a swear word in your mother tongue down in the comments, for wasting your time! Peace!

Eurusd Trading setup institutional tacticshello traders this is my 1:20 Risk reward trading setup
discipline: institutional tactics
if you like my free signals hit the like button , follow ,subscribe and show some love ❤️
wish you good luck and good trading

GBPUSD short setuphello traders this my trading setup
Strategy : institutional tactics
If you like my idea please hit the like button, follow and show some love
wish you good luck and good trading

ETHUSDT: A big move in making! Dear Traders,
First small bullish correction and then drop towards $2500 region, which will remain a key area for most of the institutional sellers. We also need to have different bias, where price may not make any corrections and just continue dropping from current area. Good Luck and Trade Safe.

75: BTC Hits Target of $62K, What Can We Expect Next?Bitcoin has once again surged to new heights, hitting the anticipated target of $62,000. As traders, it's crucial to reassess our strategies and expectations in light of this milestone.
Technical Analysis: Following an extended bullish run, it's reasonable to anticipate a slowdown and a potential pullback. Taking profits at this juncture might be a prudent move. Key support levels to monitor are at $46,000 and $30,000, which have historically demonstrated significance in Bitcoin's price action.
Upside Potential: Despite the possibility of a slowdown, the bullish momentum remains palpable. With institutions continuing to pour funds into the market, the upside potential remains considerable. Setting our sights on $95,000 as the next major target seems justified, considering the ongoing institutional interest and broader market sentiment.
Institutional Influence: It's essential to acknowledge the increasing involvement of institutional players in the cryptocurrency space. While their influx of capital has undoubtedly contributed to Bitcoin's meteoric rise, it's worth noting that their positions are continuously growing. This suggests that the current bullish trend may still have room to evolve further.
Price Action Outlook: While a pullback would align with traditional market dynamics, Bitcoin has repeatedly defied expectations with its volatility and resilience. Hence, while a clean pullback is a plausible scenario, there's also the possibility of the upward trajectory persisting.
In summary, while it's prudent to prepare for a potential slowdown and consider taking profits, the overall outlook for Bitcoin remains bullish. With institutional interest showing no signs of abating, the path to $95,000 seems increasingly plausible. However, it's essential to remain vigilant and adaptable in response to evolving market dynamics.

BTC - Institutional Accumulation Zone Signals Trend ReversalThe Bitcoin futures market is showing signs of a potential reversal short-term bearish impulse, with institutional traders accumulating positions in a newly identified accumulation zone. This zone, marked on the chart, represents an area where large buyers have been actively buying BTC futures contracts.
The accumulation zone has been formed after a period of consolidation and sideways trading, following a sharp downtrend. The fact that institutional traders are accumulating in this zone suggests that they believe the downtrend is coming to an end and that a new uptrend is about to begin.
Furthermore, we should observe a key resistance level marked on chart, which can adds further credence to the bullish outlook. This breakout would signal that the sellers have been exhausted and that the buyers are now in control.
If the price action can continue to trade above the resistance level, it will be a strong indication that the downtrend has ended and that a new uptrend is underway. Traders should watch for a retest of the resistance level as a potential buying opportunity.

GBPNZD BULLISH RUN????Creating bullish structure on the daily and 4H, we have buyside liquidity above and a clear high that needs to be taken, using ltf confirmation we could see serious bullish moves to the upside

BTCUSD - INSTITUTIONAL BUYING ZONE1. A breakout is about to happen at the support level.
2. A false breakout is when the institutions enter the market at respective level either support or resistance level.
3. But big institutions resist the breakout by buying huge quantities there forming a false breakout.
4. It was the right time to follow their footsteps.

BCTUSD - INSTITUTIONAL BUYING ZONE1. A breakout is about to happen at the support level.
2. A false breakout is when the institutions enter the market at respective level either support or resistance level.
3. But big institutions resist the breakout by buying huge quantities there forming a false breakout.
4. It was the right time to follow their footsteps.
