Supply in Control |GBPUSD exhibit a sell momentumafter the tap rejection on the supply zone a sell momentum took place which could indicate a possibility of a sell sentiment.
I expect GBPUSD to sell to 1.25968 liquidity .
Institutional

Adoption: Institutions' Positive Sentiment Awaiting BTC ETFsAdoption: Institutions' Positive Sentiment Awaiting BTC ETFs
Dear Esteemed Traders,
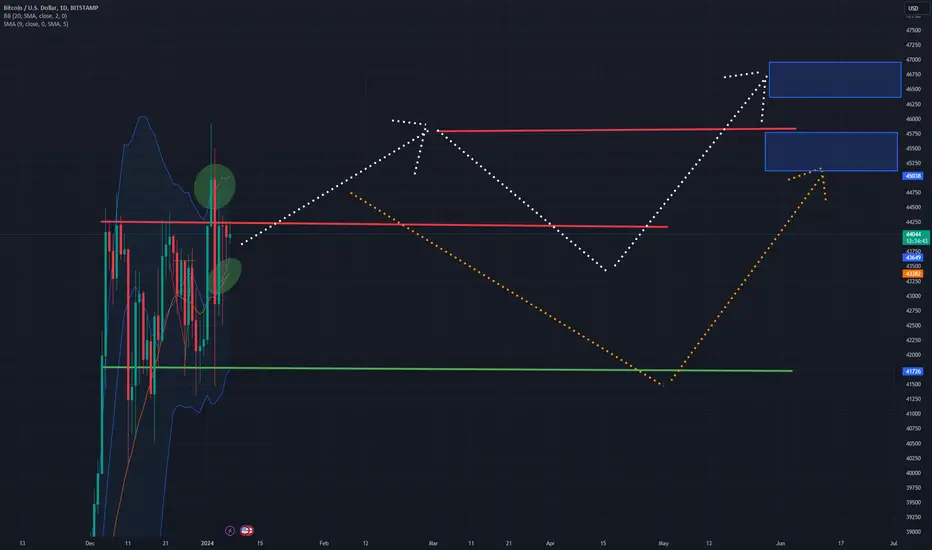
One reason why Bitcoin price could go above $4600 in the next three months is the increasing institutional adoption of the cryptocurrency. According to a survey by Bitwise, almost 90% of financial advisors plan to buy Bitcoin after the approval of spot BTC ETFs. This could create a huge demand for Bitcoin and drive its price higher. Additionally, some institutions such as MicroStrategy, Tesla, and Square have already invested billions of dollars in Bitcoin and are holding it as a reserve asset. This could reduce the supply of Bitcoin and increase its scarcity value.
Another reason why Bitcoin price could go above $4600 in the next three months is the positive technical outlook of the cryptocurrency. Bitcoin is currently trending bullish on the four-hour time frame, with the 50-day and 200-day moving averages sloping up. The RSI is also within the neutral zone, indicating that the price has room to grow without being overbought or oversold. Moreover, Bitcoin has formed an ascending triangle pattern on the weekly chart, which is a bullish continuation pattern that suggests a breakout to the upside. If Bitcoin can break above the resistance line of the triangle, it could reach record highs, according to the measured move technique.
Of course, these are not the only factors that could affect the price of Bitcoin in the next three months. There are also some risks and uncertainties that could cause the price to drop, such as regulatory hurdles, market volatility, cyberattacks, and competition from other cryptocurrencies. Therefore, it is important to do your own research and analysis before making any investment decisions.
Disclaimer: This is not investment advice. The information provided is for general information purposes only. No information, materials, services, or other content provided on this page constitutes a solicitation, recommendation, endorsement, or any financial, investment, or other advice. Seek independent professional consultation in the form of legal, financial, and fiscal advice before making any investment decision.
Kind Regards,
Ely
DAILY ANALYSIS // Jan 5, 2024 [ #EURUSD ]Hey traders! 👋 Today's scoop on EURUSD:
🔍 Swing Check: The recent swing didn't convincingly close high up.
🚀 Looking for Longs: For potential gains, watch out for a higher high inside. It signals a shift in direction, making it a good time to consider going long.
Stay sharp, watch those charts, and happy trading! 🌐💰 #ForexTips #EasyTrading #EURUSDUpdate
D |
4H |
15M |


potential reversal zone D1 or D2|EURUSD at weakly supply zone 1.06500 and 1.05241 liquidity taking creates the weekly supply zone thus expecting a reversal to 1.08307 or 1.07596 - 1.06534 demand zone

Weekend Market Maker Buy Model in ETHPrice's trades a 4h BISI + 4h OB as part of a second accumulation in a possible MMSM in the 1D timeframe. This is important because it frames the context behind the trade idea. I'm ultra-cautious about this because it's the weekend, and price can do whatever.

Market Maker buy model on ETHGood day, today im following this scenario maybe to taking place in ETH this week.
However this is a "set up" only if the prices makes a Market Maker Reversal on the Key level (Breaker Block 4h + C.E NWOG).

$COUR showing Relative Strength Keep an eye on this one as it's showing a lot of Relative Strength and Accumulation.
It recently broke into its stage 2 up trend and it's resisting the general market moves and showing signs of institutional demand.
Given the current market conditions, this may continue to range between 17.5 to 18.5.
We might see a flush of late buyers and might see a dip to the ~16.5/3 area.

GBPUSD potential Sell On Liquidity GrabGBPUSD is on bearish sentiment expecting more sell off after taking liquidity at 1.27147 or 1.27410 in to the supply zone expecting GU to reach a target 1.26243 demand zone

Virgin Galactic (SPCE) - Q2 Interest - Potential Accumulation 📊 Fundamental Analysis:
Virgin Galactic has been gaining attention in the market due to a positive Q2 performance. The company's strong quarterly results have sparked interest among investors, potentially indicating positive growth prospects ahead.
📈 Technical Analysis:
The chart above illustrates a potential Wyckoff accumulation phase for SPCE. The price action appears to be forming a classic Wyckoff pattern, suggesting a potential bullish reversal. We've seen a series of higher lows forming over time, indicating increasing buying interest.
🔄 Anticipating the Spring Phase:
The final confirmation for the Wyckoff accumulation pattern often comes with the "Spring" phase, which involves a liquidity grab at the bottom. In this case, we're watching for a potential dip to the 0.272 Fibonacci level around $2.36. This could act as the liquidity grab, setting the stage for a potential bullish move.
📈 Bullish Confirmation:
To confirm the bullish scenario, we're looking for a higher high (an outbreak) in the price action, potentially around the $8 to $10 range. This breakout would validate the accumulation phase and signal a potential trend reversal.
🔍 Key Levels to Watch:
Support: 0.272 Fibonacci at $2.36
Breakout Confirmation: $8 to $10 range
Let's discuss in the comments below! What are your thoughts on SPCE's potential accumulation phase and breakout scenario? Share your insights!

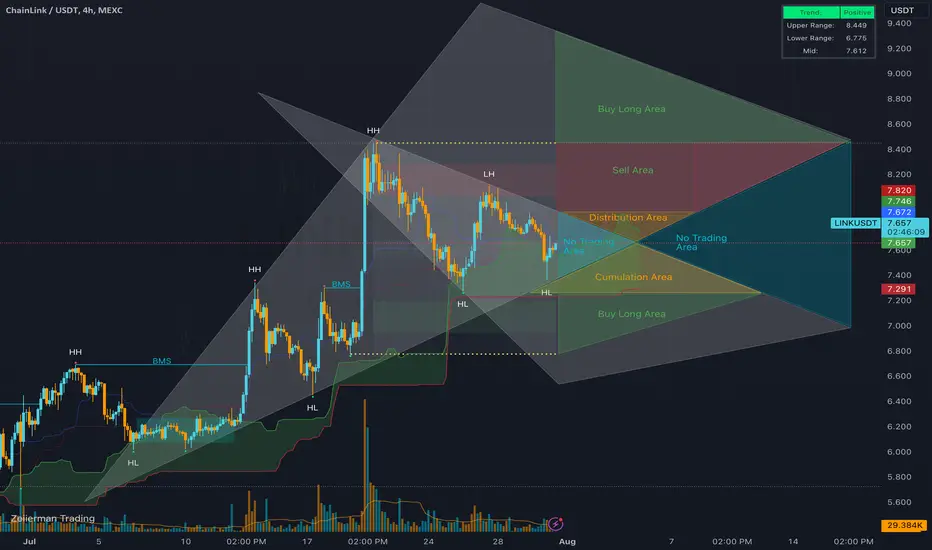
Can Someone Make an Institutional Script?I need someone to make a script that can constantly update its drawings and move these triangle area's around in real time so that i dont have to constantly change the triangles constantly, which requires a lot of time. If somebody could make a pine script that automates these drawings up to 30-100 periods in the futures then that would be a very powerful institutional trading tool!
#gold/USD long setup on 4h chartHello guys I wish you best.
This setup is made by SMC concepts, I hope it helps you.
Quick reminder (there is no 💯 accurate in trading).
Like if you this idea thanks.
Cheers 🥂.

#Bitcoin direction ⬇️⬆️ which one is your guess.? 📉📈Hello guys I wish you the best 💝.
As we all know Bitcoin movement was in a trading range recently.
Therefore good amount of liquidity created on the buy side Wich u can ICT module user's are well knows this.
But don't forget that we have big Fvg till 18000.
So please let me know about your suggestions, feel free to leave comments for me 🙏🙏.
Cheers 🥂

Dollar index most likely to the up side📈📊Hello my friends I wish you the best
Dollar I recently started to go up side 📈 az I expected.
But market's need full to go more.
As always this is just a ideas 💡 and guess what market are related to each other 😜.
I hope that this helps you.
Please feel free to leave comment and like for me.
Cheers 🥂.

Long position 📉📈 high probability tradeHello to all trades.
In this chart we saw a good pressure from the bulls and I think the can have nice rally.
Please feel free to leave comment for me 🙏🙏🙏.
Cheers 🥂.

DXY long position to the up side liquidity Guess what happens to the related charts 💵🤡
Well I wish you all the best

#Euro/usd buy signal entry Hello guys I wish you the best.
Euro chart is now on a important level.
I hope that this will be helpful for you.
Please feel free to leave comment for me.
Ps trading is not 💯 anyone can be wrong.
Cheers 🥂.

BANK NIFTY ANALYSIS - 31/05/2023BUY ABOVE - 44480
SL - 44360
TARGETS - 44560,44670,44750
SELL BELOW - 44360
SL - 44480
TARGETS - 44270,44190,44080
Trade Safe & Happy Trading Guys
This is only for educational purpose so TAKE YOUR OWN RISK REWARD

Sell idea base on euro/usd 4h chartHello guys I wish you the best ❤️.
Here we have starting the down trend therefore market needs a pullback so keep that idea u might surprise 🫢.
Cheers 🥂.

Institutions are dumping NFLX within an apparent diamond patternI spotted this diamond a year ago after the earnings panic.
Since then, I realised that institutions have been dumping Netflix at a prodigious rate.
In fact, NFLX has gone from nearly 100% institutional ownership, down to 74% institutional ownership in around 15 months.
This translates to institutions performing a dump of just over 1.5% of institutional holdings every month on average.
I think this short has a lot of potential if I am correct about the diamond pattern and it's clear that the catalyst is going to be institutional deleveraging.
What I'm looking for to confirm this trade is an ABC move up.
That is to say, the dump back in October Q4 was an A wave down, we are now in a B wave (that subdivides into a smaller ABC move up) and confirmation of this trade will mean that we complete the ABC I have sketched out (zig zag pattern) up to roughly around the 400 range.
An ABC up in this manner means we have a B wave with a C wave decline yet to materialise and it's the C wave we should aim to capture with a short.
I consider this quite a long-term outline and I don't envision this C wave to materialise until next year.
My suspicion, is that NFLX is being harmed by the streaming explosion that has resulted in a massive influx of very aggressive competitors. I think that the password-sharing crackdown will ultimately do more harm than good and do nothing to help their earnings.
So, I'm not saying get in on this now, but the basic premise here is to wait to see if the ABC zig-zag upmove (representing a cyclical B wave) materialises. If it does, I consider NFLX could be an excellent short.

EURUSD Long PositionWe see price bullish on the higher timeframe. Price is now creating swing highs & swing lows. Although, the risk to reward is not my ideal target. It is giving me all the confirmations to take a long position here. Price action has given us the green light to buy now.

Short signal on Es500 4h chartHello guys I wish you the best.
As we know there is nothing 💯 In trading but I think this idea might work.
Please leave comment for me and share with your friend, thanks.
Cheers 🥂.
