EURNZD: Bullish Shift and Institutional Re-Entry from SupportGreetings Traders,
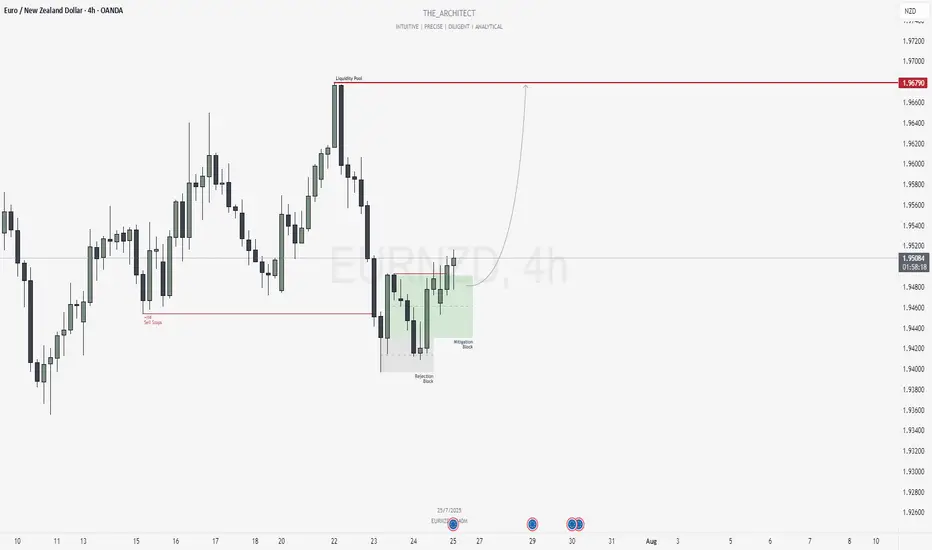
In today’s analysis of EURNZD, we observe that institutional order flow on the H4 timeframe has recently shifted bullish. This alignment now provides us with a clear bias to seek buying opportunities in line with the predominant higher timeframe trend.
Higher Timeframe Context:
The weekly timeframe is currently delivering bullish order flow. With the recent bullish market structure shift (MSS) on the H4, we now have confluence across both timeframes, which strengthens our confidence in seeking long setups on lower timeframes.
Key Observations on H4:
Sell Stop Raid & Structural Rejection: Price action recently swept sell-side liquidity, a typical behavior indicating institutional order pairing. Following this, price attempted to move lower but failed to break the previous low, instead being supported by a Rejection Block. This led to a bullish market structure shift—our key signal of trend continuation.
Mitigation Block Entry Zone: Price has since retraced into a Mitigation Block—an area where previous institutional selling occurred. The purpose of this pullback is to mitigate earlier positions and initiate fresh buying orders. This now becomes our zone of interest for potential confirmation entries towards the upside.
Trading Plan:
Entry Strategy: Look for lower timeframe confirmation entries within the H4 Mitigation Block.
Target: The objective is to target the H4 liquidity pool residing at premium prices, aligning with the discount-to-premium delivery model.
For a detailed market walkthrough and in-depth execution zones, be sure to watch this week’s Forex Market Breakdown:https://www.tradingview.com/chart/EURNZD/BZC9xW1L-July-21-Forex-Outlook-Don-t-Miss-These-High-Reward-Setups/
As always, remain patient and disciplined. Wait for confirmation before executing, and manage your risk accordingly.
Kind Regards,
The Architect 🏛️📈
Institutional_trading
AUDJPY: Bullish Structure Shift Signals Institutional Buy ZoneGreetings Traders,
In today’s analysis of AUDJPY, we observe a recent bullish market structure shift (MSS), signaling potential for continued upward movement. With this in mind, we aim to capitalize on buying opportunities at key institutional points of interest to target higher premium prices.
Higher Timeframe Context:
The weekly timeframe maintains a clear bullish narrative. This long-term bias is now supported by a bullish MSS on the H4 timeframe, offering strong confluence and alignment across both macro and intermediate structures. This increases our confidence in expecting further bullish continuation.
Key Observations on H4:
Weekly Fair Value Gap (FVG) Support: Price recently pulled back into a weekly FVG and has rebalanced that inefficiency. This reaction aligns with the H4 MSS, reinforcing the weekly FVG as a strong institutional support zone.
Reclaimed Bullish Order Block: After the MSS, price retraced into a bullish reclaimed order block—an area where previous institutional positioning occurred. Since price has now reclaimed this level, it becomes a high-probability zone for renewed buying interest in the direction of the dominant trend.
Lower Timeframe Confirmation: This reclaimed order block will serve as our primary zone of interest to seek confirmations on the lower timeframes for precise entries.
Trading Plan:
Entry Strategy: Wait for bullish confirmation within the reclaimed H4 order block zone before entering long positions.
Target: The primary objective is the H4 liquidity pool situated at premium prices, which the market is likely to be drawn toward.
For a detailed market walkthrough and in-depth execution zones, be sure to watch this week’s Forex Market Breakdown:
As always, execute with discipline and align your trade management with your overall plan.
Kind Regards,
The Architect 🏛️📈

EURNZD: Bullish Confluence Aligns for Buy Setups at Key ArraysGreetings Traders,
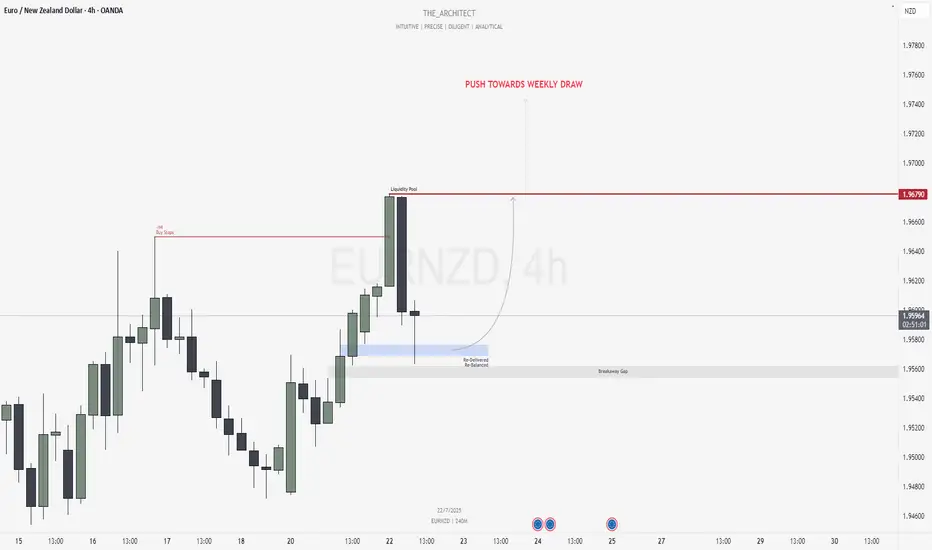
In today’s analysis of EURNZD, we identify that the current institutional order flow is bullish. With this bias in mind, we aim to capitalize on high-probability buying opportunities from key points of interest aligned with institutional behavior.
Higher Timeframe Context:
The weekly timeframe is showing a clear bullish narrative. This bullish order flow is confirmed by the H4 timeframe, which is also delivering higher highs and higher lows—providing confluence between both the macro and intermediate timeframes. This alignment increases our confidence in seeking long setups.
Key Observations on H4:
Buy-Side Liquidity Sweep: Price recently took out H4 buy stops, which triggered a retracement into internal range price action.
Re-Delivered Re-Balanced Zone (RDRB): Price has now pulled back into a re-delivered, re-balanced array—a significant institutional level that typically offers low-risk buy setups. Given the nature of this zone, we do not anticipate a deeper pullback into the fair value gap (FVG), thereby treating it as a potential breakaway gap.
Draw on Liquidity: The next probable target is the external liquidity pool resting in premium prices. The market appears poised to gravitate towards that area.
Trading Plan:
Entry Strategy: Monitor the lower timeframes for bullish confirmations within the RDRB array.
Targets: The primary target is the engineered liquidity pool in premium prices.
For a detailed analysis, please watch this weeks Forex Outlook:https://www.tradingview.com/chart/EURNZD/BZC9xW1L-July-21-Forex-Outlook-Don-t-Miss-These-High-Reward-Setups/
Remain patient, trust the structure, and execute with precision as the bullish narrative unfolds.
Kind Regards,
The Architect 🏛️📈
EURJPY: MSS on H4 Signals Bearish Shift Toward Weekly FVGGreetings Traders,
In today’s analysis of EURJPY, we observe that a Market Structure Shift (MSS) has recently occurred on the H4 timeframe, indicating a potential change in directional bias. This suggests that price may begin to draw toward the Weekly Fair Value Gap (FVG), presenting a favorable opportunity to align with bearish order flow.
Higher Timeframe Context:
The weekly timeframe currently shows an unfilled Fair Value Gap (FVG) to the downside, acting as the primary draw on liquidity. This macro bearish draw adds weight to the idea of shorting the pair from premium levels. On the H4—our intermediate timeframe—we now have structural confirmation via a bearish MSS, aligning the two timeframes toward downside targets.
Key Observations on H4:
Bearish Order Block in Premium: Price has recently retraced into an H4 bearish order block situated within premium pricing. This zone acts as institutional resistance and is currently showing signs of rejection.
Confirmation Zone: This H4 bearish order block is being monitored for M15 confirmation entries, as we look for price to break lower from this key institutional level.
Engineered Support & Resting Liquidity: Just above the weekly FVG lies an engineered support zone—characterized by equal lows—suggesting that liquidity has been pooled there. This area serves as a high-probability draw for institutional price delivery.
Trading Plan:
Entry Strategy: Seek lower timeframe (M15) confirmation around the H4 bearish order block before initiating short positions.
Targets: The first target lies at the H4 internal liquidity pool within discounted pricing. The longer-term objective is the weekly FVG, where liquidity is likely to be delivered next.
For a detailed analysis, please watch this weeks Forex Outlook:https://www.tradingview.com/chart/EURNZD/BZC9xW1L-July-21-Forex-Outlook-Don-t-Miss-These-High-Reward-Setups/
Maintain patience, follow your confirmation rules, and always adhere to sound risk management principles.
Kind Regards,
The_Architect 🏛️📉

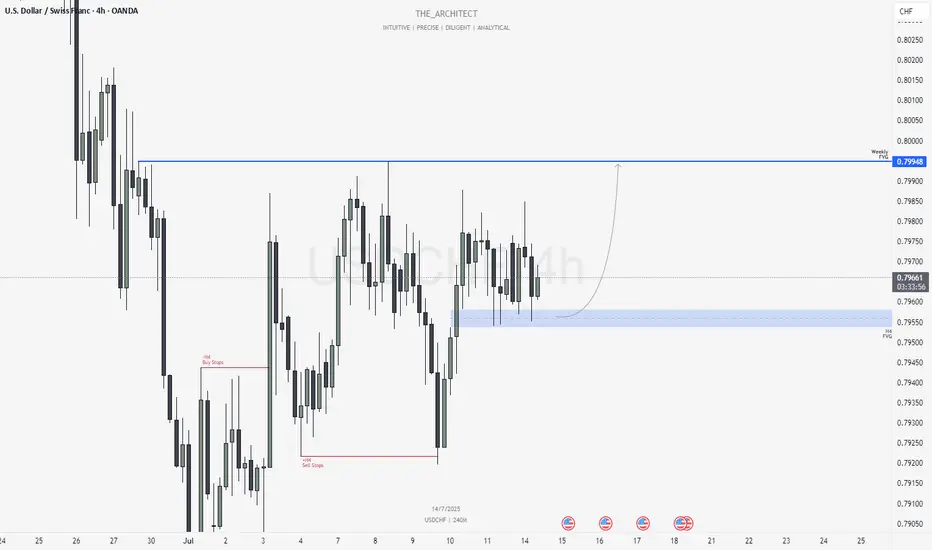
USDCHF: Bearish Shift Offers Premium Selling ZonesGreetings Traders,
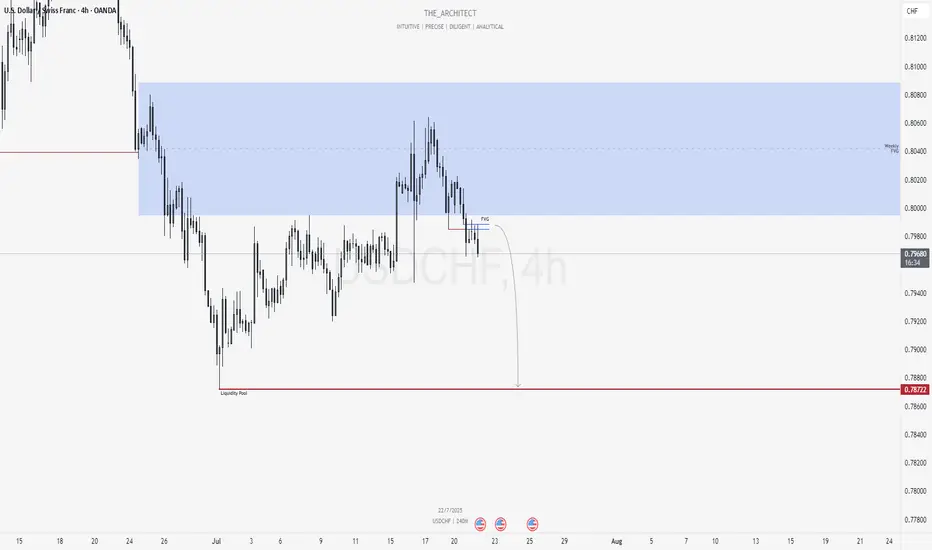
At present, USDCHF is exhibiting a clear shift in institutional order flow toward the bearish side. In response, we aim to align with this directional bias by identifying high-probability selling opportunities within premium price zones.
Higher Timeframe Context:
The weekly timeframe remains bearish, offering a macro-level bias. Price recently pulled back into the weekly Fair Value Gap (FVG), a key internal range area. With this retracement complete, we now expect the market to begin its delivery toward external liquidity pools located in discounted price zones.
Key Observations on H4:
Market Structure Shift (MSS): USDCHF has recently presented a bearish MSS on the H4, confirming a change in the internal structure and further validating the bearish narrative.
H4 Fair Value Gap Rejection: Following the MSS, price retraced into a newly formed H4 FVG. This area now serves as a short-term institutional resistance zone.
Sell Opportunity Zone: This H4 FVG provides a valid zone to seek confirmation-based entries on the lower timeframes (e.g., M15), with the objective of targeting downside liquidity.
Trading Plan:
Entry Strategy: Look for short setups via confirmation on the M15 timeframe within the current H4 FVG zone.
Targets: Focus on internal liquidity pools within discounted price levels, with the broader objective being the external liquidity resting beneath recent swing lows.
For a detailed market walkthrough and in-depth execution zones, be sure to watch this week’s Forex Market Breakdown:
Kind Regards,
The Architect 🏛️📉
July 21, Forex Outlook : Don’t Miss These High-Reward Setups!Welcome back, traders!
In today’s video, we’ll be conducting a Forex Weekly Outlook, analyzing multiple currency pairs from a top-down perspective—starting from the higher timeframes and working our way down to the lower timeframes.
Pairs to focus on this Week:
EURUSD
USDJPY
AUDJPY
CADJPY
EURJPY
GBPCHF
USDCHF
NZDCHF
EURNZD
Our focus will be on identifying high-probability price action scenarios using clear market structure, institutional order flow, and key confirmation levels. This detailed breakdown is designed to give you a strategic edge and help you navigate this week’s trading opportunities with confidence.
📊 What to Expect in This Video:
1. Higher timeframe trend analysis
2. Key zones of interest and potential setups
3. High-precision confirmations on lower timeframes
4. Institutional insight into where price is likely to go next
Stay tuned, take notes, and be sure to like, comment, and subscribe so you don’t miss future trading insights!
Have a great week ahead, God bless you!
The Architect 🏛️📉

July 13, Forex Outlook : This Week’s Blueprint to Profit!Welcome back, traders!
In today’s video, we’ll be conducting a Forex Weekly Outlook, analyzing multiple currency pairs from a top-down perspective—starting from the higher timeframes and working our way down to the lower timeframes.
Currency Pairs:
EURUSD
USDCAD
AUDUSD
EURGBP
EURJPY
GBPCHF
USDCHF
NZDCHF
NZDUSD
EURNZD
Our focus will be on identifying high-probability price action scenarios using clear market structure, institutional order flow, and key confirmation levels. This detailed breakdown is designed to give you a strategic edge and help you navigate this week’s trading opportunities with confidence.
📊 What to Expect in This Video:
1. Higher timeframe trend analysis
2. Key zones of interest and potential setups
3. High-precision confirmations on lower timeframes
4. Institutional insight into where price is likely to go next
Stay tuned, take notes, and be sure to like, comment, and subscribe so you don’t miss future trading insights!
Have a great week ahead, God bless you!
The Architect 🏛️📉

EURNZD: Bullish Setup Targeting Engineered Highs!Greetings Traders,
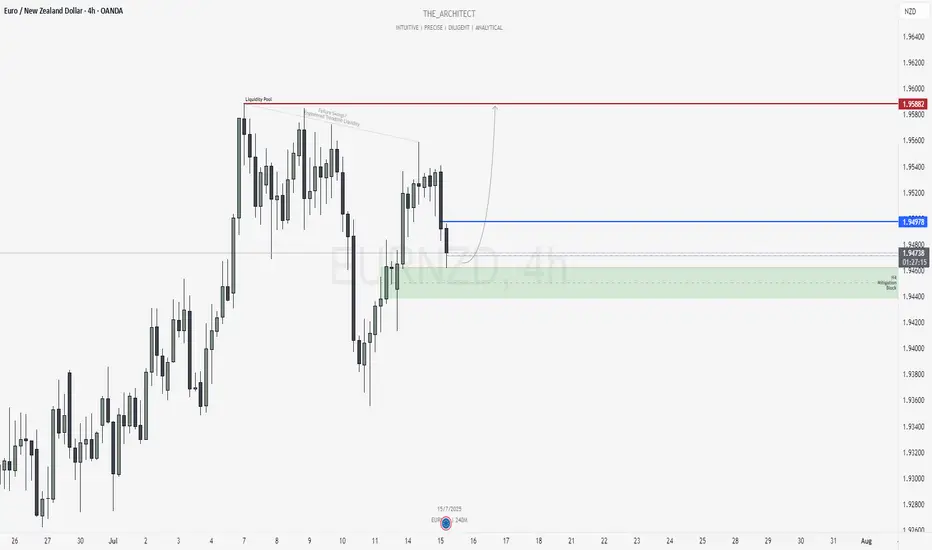
In today’s analysis of EURNZD, we observe that the market is currently operating within bullish institutional order flow. It is therefore essential that we align our bias with this narrative by focusing on buying opportunities.
Market Context:
Higher Timeframe Alignment:
The weekly timeframe is showing a bullish draw on liquidity, and this is confirmed by the H4 (intermediate) timeframe, which is also structurally bullish. This alignment between higher and intermediate timeframes provides strong confluence for long positions.
Mitigation Block Support:
Price has recently retraced into an H4 Mitigation Block—a key institutional support zone. This area represents a region where previous sell-side activity was initiated. Now that price has broken above it, institutions are likely using this retracement to mitigate prior sell positions and establish new buy orders.
Trade Idea:
Entry Strategy:
Look for confirmation on the lower timeframes within the H4 mitigation block to initiate long positions in alignment with institutional order flow.
Target Objective:
The primary target is the relatively equal highs residing in premium pricing. These levels coincide with engineered trendline liquidity and failure swings, making them highly attractive profit-taking zones for institutions—where significant buy-side liquidity is expected to be absorbed.
Stay patient and execute only upon clear confirmation signals.
Kind Regards,
The Architect 🏛️📊
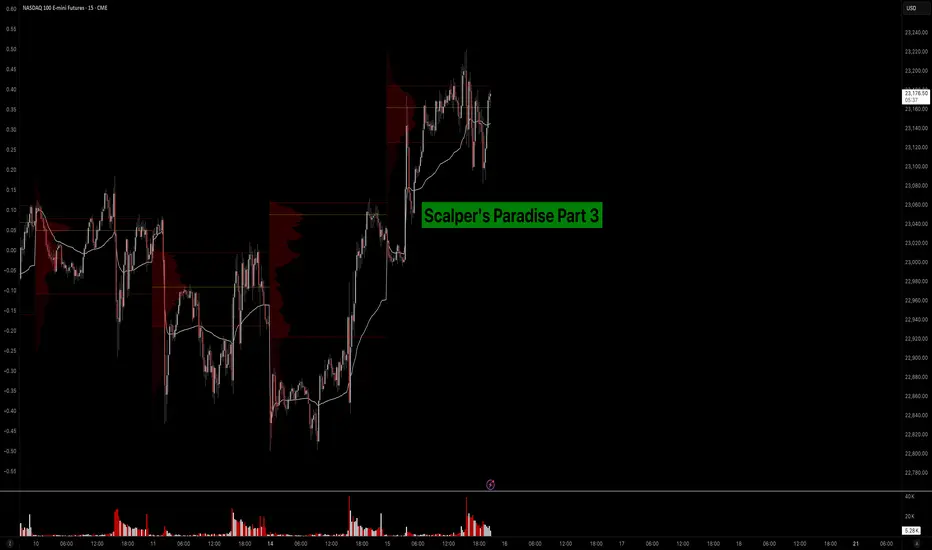
Scalper’s Paradise Part 3 – The Power of Order Flow and DOMWelcome back to Scalper’s Paradise! In this third part of the series, I want to take you into one of the most powerful tools in professional trading: Order Flow and the Depth of Market (DOM).
I chose this topic because during my time as an institutional trader, this was our entire world. We didn’t use indicators. We didn’t guess. We traded exclusively based on what we could see happening live in the DOM and Time & Sales. Every decision was made tick by tick, based on real market activity.
That experience shaped the way I view markets forever—and today, I want to share that perspective with you.
What Is Order Flow, Really?
To me, Order Flow is the most honest information the market can give you. It doesn’t predict, it reveals. It shows who is actually making moves right now. When I was sitting at my institutional desk, I didn’t look at moving averages or oscillators. I looked at who was being aggressive: were market buyers lifting offers, or were sellers smashing the bid?
Watching the tape (Time & Sales) and the footprint chart was like watching a fight unfold in real time. No filters, no guesses. Just raw interaction between buyers and sellers. That’s where real decisions are made.
The DOM: My Daily Reality as a Trader
The DOM (Depth of Market) was the first thing I looked at every morning, and the last thing I closed at night. It shows all visible limit orders resting at each price level. But there’s a catch: not everything you see is real.
In the institution, we were trained to spot real interest versus manipulation. Stacked bids might look strong, but if they disappear the moment price drops tells you that there was never a true intent. Iceberg orders were more interesting, when price gets hit again and again and doesn’t move, that usually meant someone was absorbing quietly.
Reading the DOM is like reading an X-ray of the market’s intentions. And yes, there’s a lot of noise, a lot of deception. But once you learn to read through it, it’s the most powerful tool you’ll ever have.
How We Used Order Flow on the Institutional Side
At the institution, we never chased price. That was rule number one. We let the market come to us (meaning: we used Limit Orders as often as possible) and we used Order Flow to guide every decision.
One of the most important concepts was absorption . If we needed to build a large long position, we didn’t just slam the ask. We would let sellers come in and hit our bids again and again and again. If price didn’t break lower, that told us we were in control.
On the flip side, when we needed to move the market , we switched gears. We used market orders aggressively to push through key levels, forcing reactions, triggering stops, and creating follow-through.
And yes, there were times when we intentionally created traps . We’d push price into obvious zones, make it look like a breakout, then fade it, because we knew how the market reacts afterwards. Order Flow was the only way to read those games in real time.
How You Can Use This as a Retail Trader
I know what you might be thinking: “I’m just a retail trader, how can I possibly use tools like Order Flow or DOM the way institutions do?”
The good news is: you don’t have to compete with institutions, you just need to read their intentions.
Here’s how I would approach it today:
1) Open a footprint chart and look for imbalances, areas where one side is clearly more aggressive. Watch for absorption or sudden volume spikes.
2) Watch the Time & Sales feed. Is there a flurry of trades hitting the ask, but price isn’t moving? That’s someone selling into strength.
3) Use the DOM around key areas like VWAP, previous day high/low, or liquidity clusters. Are orders getting pulled? Is size appearing suddenly? These are all signals.
You don’t need to be early. Let the big player act first, then confirm what you’re seeing across Order Flow and DOM. When everything aligns, that’s your edge.
Bringing It All Together
In Part 1, I shared how we used VWAP and Volume Profile as benchmarks to evaluate execution quality. In Part 2, I showed you how I identify institutional activity using raw volume and 10-second charts. And now, in Part 3, you’ve seen the real-time decision-making tools: Order Flow and DOM.
These aren’t indicators. They’re not theories. They’re the actual battlefield where institutions operate and where I learned to trade.
My goal with this series has always been simple: to give you access to the same mindset I used at the institutional level, but through a lens that makes sense for your reality as a retail trader.
Don’t try to outsmart the market. Observe it. Align with the big players. Let their behavior guide your decisions.
That’s how I learned to trade professionally—and it’s exactly how you can start thinking and acting like a pro, even without the size.
Part 1:
Part 2:
USDCHF: H4 Bullish Order Flow Targeting Weekly FVGGreetings Traders,
In today’s analysis of USDCHF, we observe that the H4 timeframe is currently delivering bullish institutional order flow. As a result, our directional bias is aligned with seeking buying opportunities that reflect this bullish momentum.
Market Context:
Higher Timeframe Objective:
The current draw on liquidity is aimed at a Weekly Fair Value Gap, which now serves as our primary upside target. Since the higher timeframe narrative is bullish, it’s essential that our intermediate timeframe—the H4—confirms this bias, which it does through consistent bullish structure.
Institutional Support Zone (H4):
As price continues to form higher highs and higher lows, it has now retraced into an H4 Fair Value Gap, functioning as an institutional support zone. Notably, this area has been retested multiple times, further reinforcing its strength and significance.
Trading Plan:
Entry Strategy:
Monitor the lower timeframes for confirmation signals within the H4 Fair Value Gap. Look for bullish price action cues before executing buy orders.
Target:
The primary objective remains the Weekly Fair Value Gap, which represents a key area of institutional interest and a likely zone for price to be drawn into.
July 13, Forex Outlook : This Week’s Blueprint to Profit!
Stay patient, follow your confirmations, and align with the flow of smart money.
Kind Regards,
The Architect 🏛️📊
LITECOIN (LTC) - On The Verge Of Exploding - ETF Catalyst?Litecoin: A Decentralized Network with a Differentiated Risk Profile
Litecoin (LTC), launched in 2011 by former Google engineer Charlie Lee, is one of the oldest and most active Layer-1 blockchain networks in the cryptocurrency space. Often referred to as the “digital silver” to Bitcoin’s “digital gold,” Litecoin was designed to offer faster transactions, lower fees, and broader accessibility while maintaining a similar monetary policy and codebase.
This post aims to provide an overview of Litecoin’s technical structure, usage, risk profile, and current developments—without speculative bias—so readers can form their own assessments.
1. Transparent Origins and Founder Dynamics
One key difference between Litecoin and Bitcoin lies in the identity of their respective creators. Bitcoin was developed by Satoshi Nakamoto, a pseudonymous and still-unknown individual or group, who is estimated to hold 750,000 to 1.1 million BTC—a significant portion of the total supply that has never moved. The dormant status of these holdings has occasionally raised concerns about future market impact if they were ever activated.
In contrast, Litecoin was founded by Charlie Lee, a known and public figure who was active in the community before, during, and after the launch. In 2017, Lee announced he had sold or donated nearly all his LTC holdings to avoid any potential conflict of interest. Today, no founder or insider is known to hold a disproportionate share of the Litecoin supply. This level of transparency and decentralization has been interpreted by some as a factor that lowers long-term governance and concentration risk.
2. Structural Simplicity and Leverage Exposure
Another distinction between Litecoin and Bitcoin lies in market structure and exposure to leverage.
Bitcoin is widely used as collateral in crypto lending markets and institutional derivatives, including perpetual futures and structured products. This has introduced significant systemic risk during periods of market stress, as high leverage has historically led to cascading liquidations across centralized and decentralized platforms.
Litecoin, in contrast, has relatively limited exposure to leveraged products and collateralized lending. It is not commonly used as collateral in CeFi or DeFi protocols, and institutional futures markets for LTC are smaller and less active. As a result:
Litecoin is less likely to trigger or be affected by mass liquidations
It has reduced systemic risk due to lower market entanglement
Its price tends to reflect more organic supply/demand dynamics
It is less involved in cross-collateralized or rehypothecated loan systems
This simpler structure may appeal to risk-aware investors looking for cleaner exposure without the reflexivity effects common in heavily leveraged markets.
3. Scarcity and Monetary Policy
Litecoin shares a similar deflationary model with Bitcoin, with a hard cap of 84 million LTC and scheduled halving events every four years. The most recent halving occurred in August 2023, reducing the block reward from 12.5 to 6.25 LTC per block.
With over 75 million LTC already mined, fewer than 9 million remain in future issuance. The protocol’s monetary policy is deterministic and cannot be altered unilaterally, which may appeal to those who prioritize predictable supply and inflation resistance.
While Litecoin’s cap is four times higher than Bitcoin’s, the relative issuance schedule and halving dynamics mirror Bitcoin’s design. Some investors view this as a hedge against fiat currency debasement, although the asset's volatility and adoption context should be taken into account.
4. Network Fundamentals and Real-World Use
Litecoin has maintained near 100% uptime since inception, and its transaction throughput and fee structure are generally favorable compared to many competing networks.
In 2024, Litecoin became the most used crypto for payments via BitPay, surpassing Bitcoin in transaction volume, driven by its fast 2.5-minute block times and low transaction fees. It is supported by major platforms including PayPal, and accepted by thousands of online and retail merchants.
From a security perspective, Litecoin’s hashrate reached all-time highs in 2025, partly due to merge-mining with Dogecoin, which has helped strengthen its proof-of-work infrastructure. Network upgrades like MWEB (MimbleWimble Extension Blocks) have added optional privacy layers to Litecoin’s UTXO model, while Lightning Network integration supports instant payments.
These developments suggest that Litecoin continues to evolve, with emphasis on efficiency, user privacy, and practical usability.
5. Institutional Presence and ETF Outlook
Litecoin has seen modest but growing institutional involvement. Products such as the Grayscale Litecoin Trust (LTCN) have existed for several years, and Coinbase introduced Litecoin futures trading in 2024. Fidelity also offers LTC trading and custody to institutional clients.
More notably, a Spot Litecoin ETF application is currently under review by the U.S. Securities and Exchange Commission (SEC), with analysts from Bloomberg estimating a 95% probability of approval before the end of 2025. If approved, this would make Litecoin one of the first proof-of-work assets outside of Bitcoin to gain direct exposure through a regulated ETF vehicle.
Should that happen, it may increase access, liquidity, and legitimacy among traditional investors. However, as always, regulatory decisions remain uncertain and subject to broader political and market conditions.
6. Technical Structure and Long-Term Price Action
From a macro-technical perspective, Litecoin has historically followed a pattern of higher lows and higher highs across each market cycle. This structure remains intact as of 2025, with a strong support at 81 USD on a 6 months timeframe.
Summary
Litecoin presents a combination of characteristics that differentiate it from other crypto assets, including:
✅ A public, transparent founder and no major insider dominance
✅ Limited exposure to leveraged lending, reducing systemic risk
✅ Deterministic monetary policy with a fixed supply and halving schedule
✅ Real-world usage in payments and retail adoption
✅ Strong network security and development activity
✅ Potential ETF approval that may broaden accessibility
These features do not necessarily imply outperformance, but they form the basis for an asset with a relatively clean structure, historical resilience, and a distinct position in the crypto ecosystem.
🔎 Disclaimer:
The information presented here is for educational and informational purposes only and should not be interpreted as financial advice.
Always conduct your own research, assess your individual risk profile, and make investment decisions based on your own analysis and objectives.

NZDUSD - LongWhen the market opens and the spreads die down. Will definitely be entering this trade to the upside.
We are still in a HTF bullish orderflow.
This is a great buy set up as we are at a very discounted price.
Lets see how It plays out

EURUSD, GBPUSD - Outlook for next weekEURUSD - So we have 2x 4 hour POI's (Points Of Interest). Will be looking at potential reversals at both POI's however, within the first POI we have an area of potential liquidity that could look to be taken before we make out move back to the upside.
Therefor, the second POI could look to be our more solid option for our buying options at some point next week.
GBPUSD - This pair looks to be building its liquidity now for potential trades to the upside as today on the lower TF's it was setting quite a few traps for the potential longs and the traders that would have been shorting the breaks below structure to the left.
If you have any questions for me please do let me know

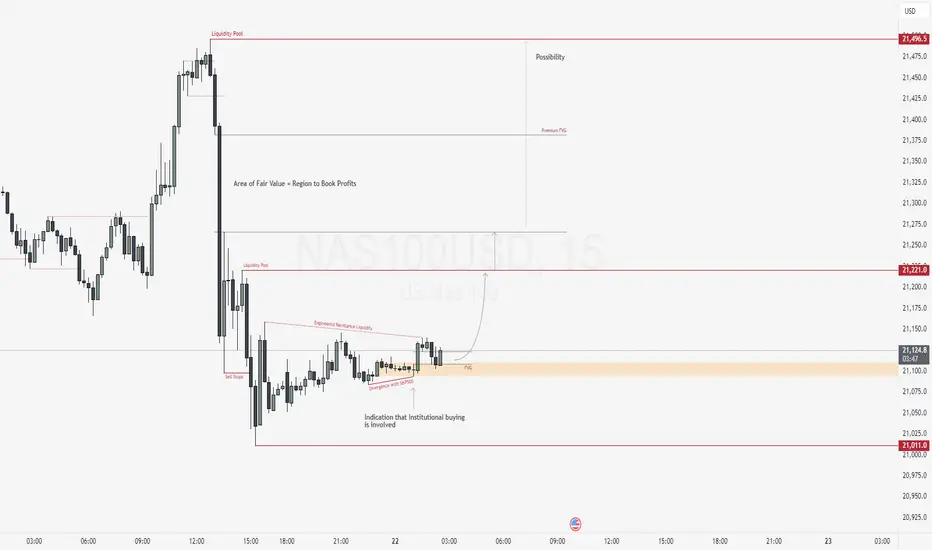
NAS100USD: SMT Divergence Signals Reversal from Discount PricingGreetings Traders,
In today’s analysis, we are closely monitoring NAS100USD for a potential reversal of bearish institutional order flow. While the broader trend has been bearish, current price action presents strong confluence for a bullish shift, suggesting an opportunity to align with a possible upside move.
Market Context:
NAS100USD is currently trading in deep discount territory, which historically presents favorable conditions for institutional accumulation. We’ve observed a liquidity sweep—price took out previous sell stops—suggesting institutions may have order-paired against willing sellers at these discounted levels.
Key Observations:
SMT Divergence with S&P500: While the S&P500 took out its previous low, NAS100USD remained above its corresponding low. This divergence signals underlying strength and institutional buying on NAS100USD, offering a strong indication of a reversal.
Bullish Structure Hints: Minor breaks in market structure to the upside are emerging, further validating the bullish narrative.
Institutional Support Zone: Price is currently trading inside a bullish order block that is also aligned with a Fair Value Gap (FVG)—a strong confluence zone that may act as support for continued upside movement.
Trading Strategy:
Await confirmation of support holding within the order block and FVG zone.
Target 1: Relatively equal highs just above current price action—an engineered liquidity pool where buy stops are likely resting.
Target 2: The premium FVG, a key area of institutional interest where longs accumulated at a discount will be offloaded for profit. The area of fair value is an region where the institutions start to book their profits.
By reading the divergence, price action, and institutional behavior, we can strategically position ourselves to capitalize on a high-probability reversal.
Happy Trading,
The Architect 🏛📊
NAS100USD: Rejection Block & Breaker Converge for Sell SetupMarket Context:
In today’s analysis of NAS100USD, we note that although the market has been trading within bullish institutional order flow, current price action is presenting multiple signs that a bearish reversal may be underway. Institutional behavior appears to have shifted, particularly after liquidity was swept and price began to respect resistance zones.
Key Observations:
Premium Buy Stop Sweep:
Price action swept the swing high rather than breaking it cleanly, indicating a stop raid. This is a common smart money tactic used to engage with buy stop liquidity in premium pricing before reversing.
Rejection Block Formation:
A sharp rejection followed the liquidity sweep, leaving behind a Rejection Block—a powerful institutional resistance zone. This suggests the institutions placed sell orders against willing buyers and are defending this level.
Market Structure Shift:
We observe a break in internal structure to the downside, further confirming that the prior bullish order flow may now be transitioning into a bearish phase.
Breaker Block Retest:
Price has retraced into a Breaker Block, where institutions typically revisit prior zones of buying to mitigate exposure and initiate new sell positions. This zone is reinforced by alignment with the previous buy stop sweep, providing a high-value confluence area for short opportunities.
Trading Plan:
Entry Strategy:
Await confirmation within the breaker on the lower timeframes. Once confirmed, these zones offer a strong institutional case for short positioning.
Targets:
Focus on discount liquidity pools as the primary objective. Selling from premium levels with the intention of targeting undervalued zones mirrors institutional execution models.
Stay aligned with smart money behavior—observe, confirm, and act with precision.
Happy Trading!
The Architect

NAS100USD: Bearish Bias Expected to Hold After RetracementGreetings Traders!
In today’s analysis of NAS100USD, we maintain a bearish outlook despite short-term bullish movements in price action. These bullish signs appear to be corrective and in alignment with institutional objectives to rebalance inefficiencies created during yesterday’s sharp decline.
KEY OBSERVATIONS:
1. Inefficiency Rebalancing Completed:
Price has retraced to fill fair value gaps left behind by recent downside volatility. With those inefficiencies now rebalanced, we anticipate a continuation of the dominant bearish institutional order flow.
2. Buy Stops Taken – Institutional Order Pairing:
The sweep of buy stops confirms liquidity collection for institutional sell-side positioning. This aligns with a classic distribution phase, where institutions utilize buy-side liquidity to enter short positions.
3. Institutional Resistance – Rejection Block:
Price is currently reacting at a key institutional resistance zone, known as the rejection block. This zone, formed prior to the latest downside move, may act as the final area of resistance before renewed bearish continuation.
TRADING PLAN:
Entry Consideration:
Monitor price behavior at the rejection block. Upon confirmation, this area offers a high-probability setup for short entries.
Profit Targets:
Focus on targeting liquidity pools resting at deeper discount levels. These areas represent logical destinations for price based on institutional order flow dynamics.
Remain diligent and patient in your execution. Let the market confirm the direction before committing to a position.
Kind Regards,
The Architect

NAS100USD: Bearish Momentum Likely to Extend in NY SessionGreetings Traders!
At present, NAS100USD continues to reflect clear bearish institutional order flow. This is evidenced by the consistent formation of lower lows and the way bearish arrays—such as fair value gaps and order blocks—continue to hold as effective resistance zones.
Key Observations:
Sustained Bearish Structure:
The market has maintained a downward trajectory, with each rally being absorbed by bearish arrays. This behavior reinforces the dominance of institutional selling pressure.
High Volatility Window – New York Session:
With the New York session now underway, heightened volatility is expected. This presents a favorable environment for bearish continuation trades, particularly if price respects the key supply zones.
Trading Strategy:
Entry Consideration:
I am awaiting a retracement into a key bearish array—either a fair value gap or a bearish order block. Upon confirmation of rejection from these zones, I will seek to enter short positions.
Profit Targets:
The primary objective will be to target liquidity pools residing at lower discount levels. These areas represent external liquidity where institutional participants are likely to complete order execution.
By aligning with the prevailing bearish institutional narrative and waiting for high-probability confirmations within premium zones, we can strategically position ourselves to benefit from further downside momentum during this high-impact session.
Kind Regards,
The Architect

NAS100USD: Bearish Continuation After FVG RebalanceGreetings Traders!
In today’s analysis of NAS100USD, the institutional order flow remains bearish, continuing the momentum established during last week’s trading sessions. In alignment with this directional bias, we are strategically focused on identifying high-probability bearish opportunities.
KEY OBSERVATIONS:
Sustained Bearish Order Flow:
Institutional behavior continues to reflect a bearish narrative, suggesting that smart money remains committed to driving price lower.
Rebalancing a Fair Value Gap (FVG):
Price is currently rebalancing a notable fair value gap—an internal range inefficiency—providing the perfect confluence zone for bearish setups. This rebalancing typically precedes a draw on external liquidity.
Targeting External Range Liquidity:
As the market rebalances internal inefficiencies (FVGs, order blocks), it subsequently seeks external range liquidity such as sell stops, liquidity pools, and engineered lows. This is a fundamental principle of institutional price delivery.
TRADING PLAN:
Entry Consideration:
Monitor price action within the fair value gap for confirmation of bearish intent. This zone serves as an internal liquidity area, optimal for institutional order execution.
Profit Targets:
Focus on external liquidity resting below previous lows—particularly sell stops and liquidity pools. These levels represent the logical draw where institutions aim to finalize order pairing and take profit.
By following the institutional flow, we align ourselves with smart money practices, improving our precision and probability of success. Stay patient and disciplined—confirmation is key!
Its good to be back,
The_Architect

USDJPY Outlook – Bearish Continuation or Bullish Reversal??In this analysis, I'm breaking down the USDJPY structure starting from the 4H to identify the overall market direction (Bearish/Sells), then zooming into the 1H to fine-tune potential trade setups.
On the 4H timeframe, we’re assessing whether the recent bearish momentum is likely to continue or if price action is showing early signs of a bullish reversal. The LOW created at 141.800 level is our first target IF we continue to sell as its creating that LowerLow.
IF price closes bullish above 142.500, I will switch sides and look for potential buys.
On the 1H timeframe, I’m watching for a bullish liquidity sweep below141.888, followed by a clear break of structure to the upside on the 15m or 1H for more confirmation. That would indicate smart money accumulation and a potential shift in market sentiment—giving me confirmation to start looking for long setups.
🚀 Give me a boost and follow for upcoming $niper entries this week! 🦇🔥
CMCMARKETS:USDJPY

Market Recap And Next Weeks Plan📉 Market Recap & Next Week’s Plan
Last week, we saw GBP/USD make a bullish push early in the week, forming a high on Wednesday before reversing and breaking structure on the 4H time frame.
Key levels of 1.29512 and 1.29105 were taken out, signaling a potential shift towards a bearish move.
Next Week’s Expectations
I’m anticipating a retracement before continuation, and I’ll be watching for selling opportunities at key levels.
📍 Potential Sell Zones:
🔹 1.29622 (High-interest POI, higher probability of forming)
🔹 1.29794
🔹 1.29893
📍 Potential Buy Zone (If Market Drops Further):
🔹 1.28848
Overall Bias:
📉 Bearish – I’ll be focused on selling opportunities unless the market structure shifts significantly.
Patience is key. Let’s see how the market develops this week.
💬 What’s your bias for next week? Let me know in the comments. 👇
#ForexTrading #MarketOutlook #GBPUSD #TradingPlan

2025 ICT Mentorship: Premium & Discount Price Delivery Intro2025 ICT Mentorship: Lecture 4_Premium & Discount Price Delivery Intro
Greetings Traders!
In this video, we dive into the fundamental concept of Premium and Discount Price Delivery—a crucial aspect of smart money trading that helps us understand how institutions approach the market with precision and efficiency.
Understanding Currency Pairs
Before we explore premium and discount dynamics, it's essential to grasp the basics of currency pairs. A currency pair, like EUR/USD or GBP/USD, represents the value of one currency against another. For example, EUR/USD shows how many U.S. dollars (the quote currency) are needed to purchase one euro (the base currency). Just like any other tradable asset, currency pairs fluctuate in value due to various economic and market factors.
Trading Is Part of Everyday Life
Believe it or not, everyone in the world is a trader. Whether you're buying groceries at a store or negotiating for goods and services, you're participating in trading activities daily. Some people aim to purchase items at a discount, while others can afford to pay a premium—it’s simply part of life.
However, banks and financial institutions take trading to another level. They don’t just trade haphazardly—they operate with extreme precision, aiming to make high-quality investments by executing trades at premium prices and targeting discount levels. This strategic approach allows them to capitalize on market inefficiencies and ensure profitable outcomes.
Why Premium and Discount Matter?
The concept of premium and discount price delivery is foundational for understanding how the market moves. By recognizing where the market is trading at a premium (overvalued) versus a discount (undervalued), traders can make more informed decisions and align their strategies with institutional order flow.
Stay tuned as we break down how to identify these zones on a chart and how to incorporate them into your trading strategy. Make sure to like, subscribe, and turn on notifications so you never miss an update!
Happy Trading,
The_Architect

USD/CHF Short Setup – Institutional Flow & Liquidity TargetsUSD/CHF is setting up for a bearish move, with confluence from technical structure, order flow, and fundamental events. Here’s a complete breakdown of the setup, execution plan, and institutional positioning.
📊 Trade Execution & Technical Breakdown
🔹 Entry Zone: Price rejected from the 0.8786 - 0.8794 supply zone, aligning with 0.62 - 0.79 Fibonacci retracement levels.
🔹 Confluences:
✅ Bearish trend continuation – Lower highs forming.
✅ Liquidity grab above minor resistance, suggesting smart money distribution.
✅ Break & retest structure confirms potential downside.
🔹 Target Zones:
📉 First target: 0.8767 (previous low & liquidity area).
📉 Final target: 0.8750 (-0.62 Fibonacci extension).
📌 Market Structure:
Higher timeframe bearish bias remains intact.
Supertrend (4H) signals continued downside.
EMA alignment (1D) confirms selling pressure.
🏦 Institutional Positioning & Market Sentiment
📌 Commitment of Traders (COT) Report Insights:
📈 USD: Institutional long positions declining, indicating potential USD weakness.
📉 CHF: Increased net short positioning, suggesting institutional flow favoring CHF strength.
📌 Liquidity & Order Flow Data:
Market depth shows heavy short positioning near resistance.
Volume profile indicates a lack of demand above 0.8780, confirming weak bullish momentum.
⚡ Fundamental Drivers – Key News Events
📊 Macroeconomic Data Impacting USD/CHF:
📌 Employment Trends Index (108.35) – USD strength limited.
📌 T-Bill Auction & Treasury Buyback – Potential liquidity shifts affecting risk sentiment.
📌 Fed’s Beige Book & Policy Outlook – Key for USD direction.
🛑 Impact on Trade:
✔️ USD uncertainty fuels risk-off flows into CHF.
✔️ Short-term retracement provides an ideal short entry before further downside.
📈 Volatility & Liquidity Insights
📌 Prime Market Terminal Data:
ATR shows increased volatility, supporting large price swings.
Institutional short positioning rising, indicating strong bearish control.
DMX data suggests liquidity buildup below 0.8760.
🔥 Conclusion – High-Probability Short Setup
✅ Bearish trend structure aligns with institutional positioning.
✅ Liquidity grab above resistance confirms distribution phase.
✅ Confluence of technicals, fundamentals, and order flow supports downside movement.
📌 Short Bias: Targeting 0.8767 → 0.8750.
📌 Key Invalidations: A break above 0.8800 could shift sentiment.
💬 What’s your take on USD/CHF? Let me know in the comments! 🚀📉

Scalper’s Paradise Part 2 – Insights on TransactionsThis is my second post and the continuation of the Scalper’s Paradise series . In this installment, I’ll dive into transactions—more commonly known as volume . While everyone is aware of it, few truly utilize it effectively. From a retail trader’s perspective, volume is often misunderstood and misused. That’s why today, I’ll break it down and provide exceptional insights, drawing from my institutional experience as a professional trader.
First, let’s clarify what volume really is. Volume is simply the total number of transactions between buyers and sellers. For example, if one buyer wants to purchase a single stock and a seller is willing to sell that stock, the transaction is recorded as one, meaning the volume reflects 1.
Now, if we see that the volume for a given period is 1,000 traded stocks, this means there were 1,000 buyers and 1,000 sellers. It’s crucial to understand that there are always an equal number of buyers and sellers in any transaction.
With this in mind, we can debunk a common misconception: when we see high volume and price movement, it’s incorrect to say there were "a lot of buyers" or "a lot of sellers"—because both sides are always equal. The real reason behind price movements is a different story, and one that I’ll cover in a future post.
Now, let’s take a look at a chart that’s particularly useful for day trading, especially when combined with the volume indicator.
Here, you can see a 10-second chart, which is particularly effective for spotting algorithmic trades used by institutions.
Now, I’ve marked the high-volume areas with a vertical line. Remember, high volume indicates a significant level of market activity.
Now, I’ve marked the candles that had the highest relative trading volumes.
But what can we do with all this information?
Why is high volume so important?
First , high volume disrupts the market. It clearly signals that a major player is in need of liquidity. The reasons behind this can vary, as discussed in Part 1 of this series, but for now, let’s focus on the key takeaway: big players need volume.
When a market participant requires large volume, their activity becomes visible in chunks, revealing parts of their trading strategy. This is exactly why we use 10-second charts—to spot these institutional trades more easily. Once we identify them, we can determine the price levels where they are beginning to accumulate or distribute their positions.
The second reason is more of an institutional strategy rather than something easily executed by retail traders—but I’ll explain it anyway. During my time as an institutional trader, my performance was often evaluated based on how efficiently I could accumulate volume over time. This required finding other large players in the market.
Let’s say I needed to take a long position. To do so, I required sellers on the other side. If I spotted a large player selling, I could use their selling pressure to gradually accumulate my position around their activity. This strategy allowed me to secure better prices over time by executing fewer, larger trades instead of aggressively chasing liquidity.
Ultimately, this is the core objective of an institutional trader—maximizing position size while maintaining optimal pricing.
How Can Retail Traders Use This Information to Improve Their Trading?
1) Identify high-volume areas on a 10-second chart.
2) Mark these levels on your chart.
3) Wait for a breach of these levels and trade in the direction of the breakout.
If there is no breakout, you can align yourself with the large player instead.
For example, if a big player is accumulating buy orders, mark that level and observe whether they continue to hold their position. If they do, you can go long alongside them. However, if other traders (as I did in my institutional trading days) start pushing against that big player, wait for a breach of your marked level and look for short opportunities instead.
Keep in mind that we are talking about day trading and scalping, meaning these are short-term trades. The goal is to capitalize on immediate price movements rather than holding positions for extended periods.
Here, you can see the levels we discussed earlier. Notice how the market clearly reacts to these easily identifiable levels—though trading them successfully is not as simple.
I always use order flow and Level 2 data to confirm my trade ideas.
Wishing you good luck and plenty of valuable insights from my post!
Marco
