EURUSD - IPDA - How To Apply It To Your Day TradingThis ICT concept is one of the many that can be used to take your trading to the next level and create consistent profits for you. I break down the concept and define the terms used with this concept.
Institutionaltrading

USDCHF Trade Idea And BreakdownExpecting a liquidity sweep and order block mitigation then continuation to the downside.

GBPCHF Trade Idea Novenmber 8, 2021The long term trend on this pair is bearish but we're currently seeing reversal signals. Liquidity has been taken below and above the ranging area. But wih the reverals indications, a counter trend trade is possible, yet I'd not set my TP too far up, as price may not return to the order block that caused the previous break of structure as yet.
Remeber there will be news on GBP pairs tomorrow. So be mindful of the news when placing trades.

XAUUSD Trade Idea November 2, 2021Price made a draw on liquidity below the areas highlighted in grey, hence I'm now expecting a return to the institutional candle highlighted in yellow as the large players have to mitigate (close) those sell positions opened in order to continue in their buy positions. My buy limit entry will be set at the 50% mark of that bullish order block as price is expected to rally upwards from that point.

GBPUSD Trade Idea Oct 25, 2021Directional bias is short term bullish. A large institutional candle is seen on the 30 minute time frame which indicates a stop hunt on liquidity resting in that area. Therefore I'm looking for price to return to mititgate that entry position created by the banks and then continue upwards. It is already doing that.

$BTC - Long Between Order Block/Rejection Block (Smart Money)-techniclly if you're following my previous Idea, we're still not out. I'm just making another setup for anyone who didn't catch my earlier I dea, better setup too. Will type more, just want to get the idea out there that this should be going long and check my linked idea for previous info.
I'll complete all of this in 15
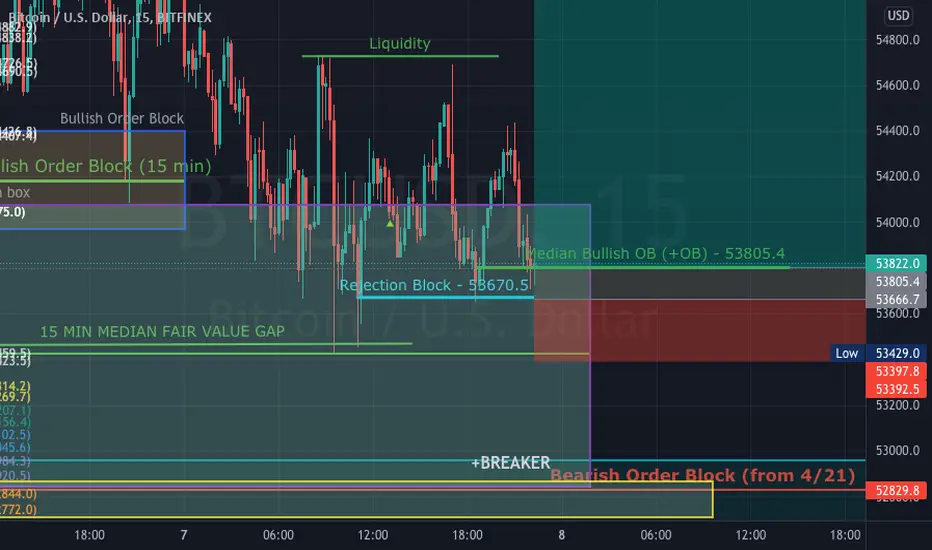
$BTC Hit Bearish Order Block median--- twice. (SMT)***If you don't know Smart Money Technique Vocabulary, this may confuse you as we believe all charts in all markets are controlled by an algorithm, don't believe me? Pay attention to Inner Circle Trader. As his student, I've learned everything I know through him And he's so spot on***
It seems that bitcoin has made. Decent Run and no one can explain it. Well for one, It spent way too much time in the discount portion of the monthly fair value gap. And two it was nearig the end of the month and for the algorithm to work on it to keep going higher we needed to create a bullish order block on the monthly. That didn't happen but the bullish Order Block on the Weekly looks great. Yesterday before the end of the week, the orice dropped to hit the order block which propelled it into today to hit the median of the bearish order block, and that's why it stopped where it stopped (Bearish order block = last up candle before down candle closing below the up candle, measure that (weekly) in half and thats the median Bearish order block, right where BTC stopped)
(Too Much time in the Discount portion of the Monthly FVG Chart)
(Half the Order Block Stopping the momentum - Weekly)
However if we don't get. quick fall like we have been getting when the price hits a bearish order block, but instead it has hit the mediann twice, I believe we're looking at price breaking that median barrier. It will probably zig zag for a minute to confuse people, (people will start chasing a buy, then it may sell off a bit, then they start chasing that) Watch for the lin of the very last bearish order block (4 hour 1 hour 15 min) If it appraches that it will get rejected but it could continue moving up trying to take out the liquidity above tht most recent swing high. That is what I personally believe it is going to do.
4 hour: $51,050
1 hour: $52,515
Above the most recent high lies all the liquidity where evereones buy stops, or sell limits are at, price wnts to get there if it continues to push up. I don't see anything in the form of liquidity on the way down.
Mybe we'll get as high as the last weekly beariish order blocks median which is 59136
\
this is all Smart Money Technique, The best way to describe smart Money technique is to think about how you would normally trade, now think about the guy that has 1000000x more money than you knows you would trade, the chart is going with the guy that has 100000000x more money than you.
Thanks for reading, Hope this made sense COINBASE:BTCUSD

CHFJPY Analysis M15My directional bias is bullish based on the higher time frames: M,W, D TFs. I found a point of interest (POI) as outlined in the label on the chart, then proceeded to refine the point of entry. Point of interest was found based on the break of structure(BOS) and identifying the Order Block (OB) which created that strong impulse to the upside. Another confirmation also was the liquidity created by the sell stops resting below the area of consolidation after the impulse upward. Price is magnetized to these areas of liquidity as well as the OB that created the impulse. The fact that the impulse was strong enough to break structure makes it a strong and valid area of interest.With the strong possibility of price returning to this area of interest, a pending order (Buy Limit) is set with entry at 119.298, SL 119.281, TP 120.220, 55:1 RRR.

NZDCHF DAILY - SELL TO BUYPrices broke out of structure, leaving behind a buy-side liquidity will be met later on. The immediate structure presents a bearish movement and we will be trading this bearish movement down into the demand area before buying back up into the liquidity high.

NZDJPY LONGA snipper entry at 50%. One of the things i struggle with so far is an exit point. Looking to take partials on this

USDCAD LONGBoth limit orders at open and 50% activated. Anticipating a rally upward if the Eof doesnt chang.
Educational purposes only.


EURJPY LONGWe have a reaction on the daily OB which shows us the EOF on higher tf. On the lower tf. i see the bos and i am looking for price to come back to the OB that caused the bos.
Educational use.I am not a financial advisor .

GBPAUD LONGIf we sweep off the Eql to grab liquidity, i will be looking for a short buy opportunity reacting from the OB.
This is not a financial advise. Make your analysis.

Gold to go higher????Gold has been bullish for a while and we anticipate it to keep pushing to the up side.
I've just seen a re-entry setup for a long position. We just recently broke out of a range that we've been in for about a week.
Price is slowly coming down to mitigate an OB (Order Block) in the supply area that has been marked. From there we anticipate price to push to high prices.
This is a high probability setup.
For inquiries please inbox us on Instagram @OfficialZedFX

GBPUSD Supply & Demand Analysis daily/m30On a daily we can see a clear reaction and retest of the demand zone. Now, price can go up and take the liquidity before hitting a bigger supply zone.

EURGBP Supply & Demand H1 AnalysisMaybe too late now, but EG made a great reaction to the orderblock above. It created another orderblock while taking liquidity from early sellers. I will be looking for a retest of the orderblock.

BITCOIN BUY ZONES AKA DEMAND AREASPrices broke out of structure, leaving behind 2 DEMAND areas to get involved.

$BTC - Equal highs = liquidity draw - Very BullishThere'e be a few fair value gap and berish order blocks along the way to knowc the price down a bit. But you have remotely equal highs which meamns there is. tone of liquidity resting aboveand around these areas of "Resistance" They're not resistance, they're just part of the algorithm themselves that were knocked back due to fir vlue gps and being oversolf on liquidity runs. Think outside the box. Think like. banker. Price will get above these equal highs in. matter of time but should've get any lowere that the 100% that I have (closed candle) if it does maybe look to go short, but this is still bullish to the extreme. COINBASE:BTCUSD

DXY bearish = GU + EU + AU BullishGap filled, corrected bearish rally with this bullish push with last FOMC and price mitigated a daily OB. next target should be to correct the imbalanced formed with last FOMC and raid all the liquidity below 89.0, price can potentially break thru 89 and target 79 which would be the next big liquidity pool

EUR/USD Institutional Trading StrategyHello, guys! It's been a while since last I posted here on TradingView. I'm today releasing into the wild my trading strategy, key levels, order arrangement and overall method for trading specifically the EUR/USD, as I've specialised on trading this particular market 24/5 now. This is basically my level fading strategy and method to trade the Euro-Dollar, based off major daily round figures (even numbers), only using limit orders as entries, and stops above or below intermediary daily round figures (odd numbers). This is a time-tested strategy, it takes a great deal of discipline and patience, it carries a substantial amount of drawdown and with impending high-impact economic releases (Fed/ECB interest rate decisions, NFP and so on), which often result in impulsive trending phases, this is deadly and it is not recommended. This works well for swing/position traders just like myself, and for the EUR/USD overall.
Leave your comments on what you guys think about this strategy, its flaws and weaknesses, your experiences with similar range fading strategies, or any other kinds of feedback or questions that you might think of, I'll read every single one of them, that I guarantee.
See you all around and good trading :)

Wyckoff Accumulation + Bullish BatFX:GBPCHF Has for the past couple months been forming a clear Wyckoff accumulation schematic. Its been manipulating the lows and we got the last low which was the spring, or shakeout. There is also a bullish bat which matches perfectly with the institutional candle that formed on the chart which is where your entry would be if you decide to take this long position. Your target would be the previous resistance at the high. Follow for more free trade setups! Good luck traders!
NOT FINANCIAL ADVICE!

$SPX - Going Long after FOMC Speaker - Two Options It depends on where the price is when I wake up tomorrow. If it's not been below 4345.8, that's at target as if you were to put a fib on top of the current breaker, that price point is just below the 63% retracement level (discount) And I would wait for the FOMC speaker to start and if it's still not below this level after opening then this is where I would look for it to bounce and go long
The second option is that if I wake up and price hs made it way lower than that price point, I would expect it to be hovering around/above the breaker point 4331.2. If you place the fib at the bottom where it hits the previous bullish order block on the 1-hour chart
(
I would expect it to dive past the breaker and hit the Bullish order block on the 4 hr chart at 4321.7 before moving bullish again. The patterns repeat in Smart money, it's just where Institutional order flow wants the price to go is the difference.
The around 2:00 p.m. the 10 yr bond auction happens and I would expect the price to start slipping from there so I would aim for any High that I could and take profits before 1:00 p.m., to be honest.
Even if Either scenario isn't perfect, as long as it stays above 4290, it'll still be bullish.
