INTC (INTEL CORP) LONG SET UPintel Corporation is engaged in designing and manufacturing products and technologies, such as the cloud. The Company's segments are Client Computing Group (CCG), Data Center Group (DCG), Internet of Things Group (IOTG), Non-Volatile Memory Solutions Group (NSG), Intel Security Group (ISecG), Programmable Solutions Group (PSG), All Other and New Technology Group (NTG). It delivers computer, networking and communications platforms to a set of customers, including original equipment manufacturers (OEMs), original design manufacturers (ODMs), cloud and communications service providers, as well as industrial, communications and automotive equipment manufacturers. It offers platforms to integrate various components and technologies, including a microprocessor and chipset, a stand-alone System-on-Chip (SoC), or a multichip package. The CCG operating segment includes platforms that integrates in notebook, two in one systems, desktop computers for consumers and businesses, tablets, and phones.
TITLE/(DATE)- BUY INTEL 7/27)
ASSET- INTC
PLATFORM- MT4
ORDER TYPE- BUY
Time Frame- 1D
ENTRY PRICE 1- $49.80 market
ENTRY 2- $44.80 (pending)
STOP LOSS- $39.80 (100 PIPS)
TAKE PROFIT 1- $54.80 (50 PIPS)
TAKE PROFIT 2- $59.80 (100 PIPS)
TAKE PROFIT 3- $64.80 (150 PIPS)
TAKE PROFIT 4- $69.80 (200’PIPS)
STATUS: ACTIVE
LINK TO CHART-
INTC


Long $INTC ($AMD, $NVDA, TSM)see full chart at www.tradingview.com
Intc
Entry $43.75 area
Target $56.75
stoploss $40.75
Why this play?
ER highlight
Intel Q2 Adj. EPS $1.23 Beats $1.10 Estimate, Sales $19.70B Beat $18.55B Estimate
BZ Wire
Intel (NASDAQ:INTC) reported quarterly earnings of $1.23 per share which beat the analyst consensus estimate of $1.10 by 11.82 percent. This is a 16.04 percent increase over earnings of $1.06 per share from the same period last year. The company reported quarterly sales of $19.70 billion which beat the analyst consensus estimate of $18.55 billion by 6.20 percent. This is a 19.36 percent increase over sales of $16.50 billion the same period last year. -Reuters
see link below for more info
newsroom.intel.com
Intel had an amazing ER, They had a record quarter pulling in 19.7 Billion in revenue, If you don't think that's a lot. look at what AMD makes.
They still have a lot of things going on for them but they are having issues with the new processor delay. That's why the stock dropped so significantly.
I personally would start adding position at $47 and double down at $43.75, this is a huge company that pays dividend too so I don't see them going on a death spirial.
I am sure they will recover eventually. Plus they are also looking at TSM to help them manufacture the chips (this is the same process that amd uses. they design and pay tsm to make).
If the deal with TSM goes thru, then both company will pop and go up.
What is Intc?
Intel Corporation provides computing, networking, data storage, and communication solutions worldwide. It operates through Data Center Group, Internet of Things Group, Non-Volatile Memory Solutions Group, Programmable Solutions Group, Client Computing Group, and All Other segments. The company offers platform products, such as CPU and chipset, system-on-chip, and multichip package products for cloud, enterprise, and communication infrastructure markets. It also provides NAND flash memory and DC persistent products for enterprise and cloud-based data centers, and users of business and consumer desktops and laptops; programmable semiconductors, such as field-programmable gate arrays, application-specific integrated circuits, and related products for communications, data center, industrial, and military markets; and various processors for notebooks, mobiles, and desktop PCs. In addition, it offers boards and systems, such as server boards and small form factor systems; and connectivity products for cellular modems, Ethernet controllers, silicon photonics, Wi-Fi, and Bluetooth. Further, the company develops computer vision and machine learning- based sensing, data analysis, localization, mapping, and driving policy technologies for advanced driver assistance systems and autonomous driving. It serves original equipment manufacturers, original design manufacturers, industrial and communication equipment manufacturers, and cloud service providers.

INTC - Intel Corporation - Technical AnalysisDespite the good earning results, Intel seems to have delays on the development of a new generation super faster chip setting back the price level to approx. 50 USD.
Based on technical analysis, the best option is to hold and wait if the 50 USD level will work as support for a new rally, otherwise, if the support level of 50 usd will be broken, there might be an option that prices will keep diving down.
Fundamental Analysis:
The future matters more: Intel (INTC) posted a strong quarter, too. But the chip maker revealed a huge setback in its push toward seven-nanometer-process technology—raising questions about how a company once revered for its manufacturing brilliance is now considering outsourcing more production to more-capable outside fabs like Taiwan Semiconductor Manufacturing (TSM). It’s an embarrassment and a boon for rival Advanced Micro Devices (AMD). The lesson? Investors pay for future performance, not past results.
The Schall Law Firm, a national shareholder rights litigation firm, announces that it is investigating claims on behalf of investors of Intel Corporation ("Intel" or "the Company") (NASDAQ:INTC) for violations of the securities laws."
The investigation focuses on whether the Company issued false and/or misleading statements and/or failed to disclose information pertinent to investors.
Intel (INTC) – Intel reported quarterly earnings of $1.23 per share, 12 cents a share above estimates. The chipmaker’s revenue was above forecasts as well. Intel signaled further delays in a new generation of superfast chips, weighing on its stock and boosting that of rival Advanced Micro Devices (AMD), which already has a “7nm” chip on the market.

Intel Corp (INTC)Dividend adjusted and unadjusted price data.
Unadjusted, INTC Is still below its ATH.
Adjusted, INTC is above its 2000 high.

Possible Head and Shoulders on IntelJust a basic observation on this one: a head and shoulders pattern may be developing here.

My God, They're EverywhereLike Amazon, Zoom and also possibly AMD, Intel also has a stubbornly obvious rising broadening pattern. And worse, this one's last bounce-able trip to the bottom of the formation looks to have been accomplished in March. After this half-trip to the top, the next step is typically to fall out of the bottom.
Perhaps we can use this price action to predict a poor earnings release, as weird as that may sound to many people. It looks baked in.

$INTC in a higher degree correction completing Wave A of B
Disclaimer: I have been trading in the markets for about a year. After several months of charting various instruments, my eyes have gotten trained to recognize different candle formation patterns like Bear & Bull Flags, Head & Shoulders, and others. This was good. But, not enough for me to accurately forecast the next following moves and market structure after these patterns had been completed.
For me my next evolution as a Trader came with a more fine-tuned approach to Market Structure, The Elliott Wave Theory. There are two books that were recommended to me as I started this journey.
1. Elliott Wave Principle: Key to Market Behavior by Robert Prechter and A. J. Frost, www.elliottwave.com
2. Visual Guide to Elliott Wave Trading by Wayne Gorman and Jeffrey Kennedy, www.elliottwave.com
I am still learning. I accept the fact that my analysis may be wrong. But, these are my charts as I continue my journey. I am open to all feedback on my analysis as I continue to improve.

Intel fib transition - buy signalLooks great
transition between Fibonacci levels within the fib circle

can INTC get to $68 in mid-July?the chart shows a possible scenario if INTC can maintain the gains it made this week, getting into a new range - big part of that depends on what happen at the open next Monday - so far we see this move above the $63.5 has some demand & positive sentiment behind it, which sends an optimistic signal that it may hold to that new range.
the problem with INTC is it's too heavy to move and the stock is not seen as "exciting" any more.. but that's not totally bad for value investors who are in for the long game.
the $68 mark represents a 7% to 8% from the lows of this new range - let's keep in mind, the $68 is the pre-COVID range and the prior ATH, which most other tech stocks are already coming back to.


Purchasing INTC calls during June.May's monthly candle closed above April's high.
If price returns to April's high, then I will begin purchasing call options at the 62.00 strike with a July 2 expiration.

INTC part 2INTC looks like a downtrend will start soon then we hope to stay in the channel on the rebound. but with COVID-19 keep those STOP-Losses On

INTCINTC, Price for next month looks like a Bullish overall trend, for now, COVD-19 might Change this I will Keep up to date!

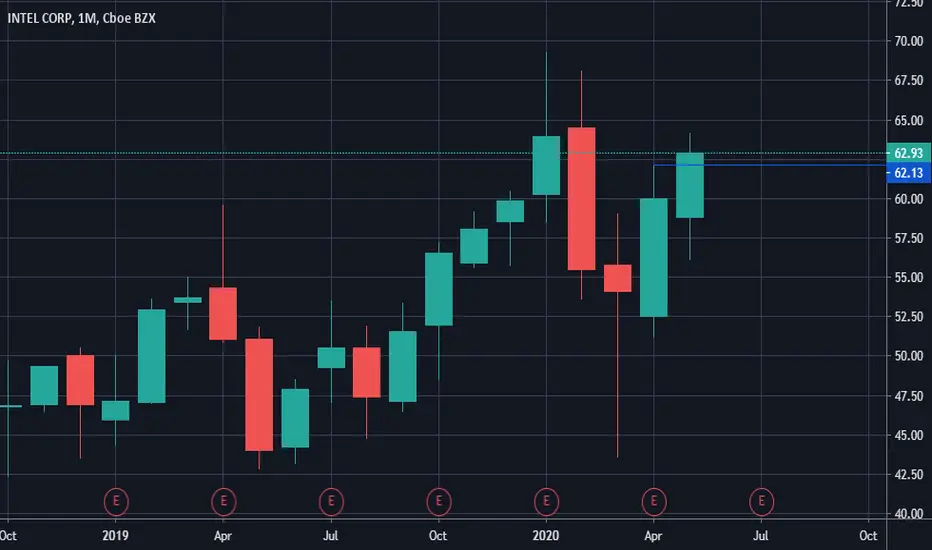
Intel Corp $INTC$INTC is getting ready for a breakout. $62.13 is the critical resistance to get above. Watch RSI break out as well.
if you find my charts useful, please leave me a "like"
thx

INTC: Need to break the $61.5 lineI initiated a long on INTC a week ago, guess i was too impatient with the lack of action recently.
no regrets, as this position is planned to be a buy-and-hold for few months.
i like INTC and believe it's one of those value plays - especially with 5G potential - will accumulate if it goes below $56.
short-term, i still maintain a 10% upside to the target line. however, no specific price projections would be possible until we break the $61.5 line and a better price structure is clear
i claim that the current range is an accumulation rather than distribution given how supply / demand look like and the sentiment (the lower indicators) - and so far support has been holding well - the bulls have been gaining slightly and even shifting the support up slightly.
we'll see.

INTCJust parked right in the middle of a chop zone not knowing if it wants to gap fill or go back down. 59.40 and 58.50 are the prices I’m watching as a break above or below will send this to the respective supply or demand zone. It has been trading sideways for awhile consolidating; whether it rallies or drops will have to wait and see.
This is perfect example of why I wait for a trade set up to come to me as opposed to gambling whether it will go up or down. If I gamble and I’m right, obviously gains are pretty generous but this is not a consistent way to trade and all it takes is one bad trade to blow up everything!
I’ll set alerts for a price break above or below to then go and see what price action is doing. I just saw that there is potentially a dividend this week... perfect example of an event (that I don’t trade) that can accelerate the price to one of the two zones.

"Intel: going towards ATH" by ThinkingAntsOk4H Chart Explanation:
- Price broke the Descending Trendline.
- Price is currently on a Bullish Corrective Structure.
- If it breaks, potential to move up towards the Resistance Zone.
Weekly Vision:
Daily Vision:
Updates coming soon!

INTC, bullish and bearish scenario INTC is currently consolidating and is trading in a range on bigger time frames. We do not have clear direction of the trend, and i would not advise to take a trade until we cross the significant level.
LONG : i would enter long at 62 level with 1/3 of my position, because we have to be prepared of a fake breakout.
( 80% of all breakouts fail, they usually retest and move higher later). I would wait to retest and bounce back. I would than add at 63, 2/3 and wait what will happen at 64, because there could be a resistance. If we successfuly break it i would add 3/3 of my position and ride it to the upside until i see CLEAR reversal.
SHORT : i would short at 56. Volume does not to be big, because on the downside we do not necessarily need it big.
i would enter with 1/3 of my position - same reason : fake breakouts. And i would add at every whole number and look closely what will happen at half dollars ( at half dollars we usually create psychological support and resistance levels too ).
At 54 we could create strong support level. Watch closely for reversals ( candlesticks, volume )
If we cross it i would add to my position and ride it till i see a clear reversal signal.
Stop loss should be always 50 cents if you are risk tolerant, if not you can have a 20 cent stop loss.
INTC has a great fundamentals, wall street rates it as a very good tehnical and fundamental company and has a lot of potential in the future. So it is good for investment too.
I DO NOT recommend taking any of my trades because of the risk. I AM NOT a financial advisor and i AM NOT a institutional trader. This analysis is purely for entertainment only and it represents an idea what could happen with the stocks future.
If you like idea please like and follow.
Any kind of support is appreciated.

