INTCThink for INTC to try and save itself tomorrow it needs to get above 55.75 if it wants a chance at reclaiming 55.93. If the 55.93 zone rejects, I'm leaning towards price testing the new low made and will look at a price target of 54.13 to the downside.
Game Plan: If it can reclaim 55.93 and print above, make higher lows (despite the lower low put in), I would look at a price target of 57.50 to the upside. If it fails to reclaim and tests the new low at 55.26, I think there is a good possibility it fails and we go down and visit 54.13. With 55.26, there is really no support, at all, with it as it is a lower low AND is hanging out in gap zone area from below. If we open tomorrow with bid above 55.93, will look at target upwards to 57.50. If we open tomorrow with a bid below 55.93, will look for it to go test 55.26 with a small risk because either I think it could put up a fighting chance to survive and push back up or, if it breaks, I think we visit 54.13 quickly which is why I am thinking of putting on a small short risk, depending on open, to try and capture a quick move down. If it goes against me, I think it is still a good risk to reward ratio.
INTC

INTC 0.618 pullback long after ER.INTC actually provides very solid numbers last quarter,
while the market still slumped it in after market trading.
I'll be willing to look for some trades to long around 50.00 spot,
which is also near 0.618 spot and the runaway gap.
Not really willing to put the out below 43 to be a 15% risk trade, instead,
I'll choose to wait for intraday reversal sign to be the confirmation entry.
Let's see how it goes yo!

INTCThink we can push from this demand level and try to go and close the gap. Open tomorrow will be a big indicator for me as it looks like we are setting up the 1 - 2 wave movement out. These sell offs can produce good rallies by picking up buyers in good demand. However, this is the second time we have visited this level.
Game Plan: tomorrow open is important. If we bid up at open and make higher low, I will trade based on this count. IF we break by making a lower low, I’ll watch and see if we move down towards 55.93. So, higher low I think we push for gap fill. Below 55.93, I think 53.80 comes quickly!
As a side note, I do have a longer term count potentially down to 45, then eventually 38. So, where we are in this structure is important. If it wants to avoid those levels, some buyers better start stepping up otherwise it can fade.

INTCAgain, having a plan and sticking to it with patience helps with consistency. As I mentioned in previous post, I was staying out until either one of the zones were in play above or below. The below came today and I had mentioned a print below we will go visit $56.
We opened right at the 58.39 “uh oh” line I call it. Watched price action (had two 5 minute candles close below, then went to 15 minute to see candle structure overall). And then the game plan played out and price went straight on down to $56, printing a low of 55.93. This is why I wait for set ups; to put the odds more in your favor.
I’ll have to re-evaluate the chart tonight but in the meantime, as we sold right into a demand zone, I think we could see a potential relief bounce.
If anyone followed along, hope it worked out for you!

INTCIf this wants to go higher I think it needs to clear 60.81 which can be a big hurdle I believe. I think we will get a bounce out of this demand for a potential small day scalp but other than that I’m not making any large moves on this.
Below 58.39 I think we go and revisit the 56 area. Above 60.81 I think it can push to 62. Until then, I’m staying out. I’ll watch if price moves up to the 60.81 supply and if it rejects there, I’ll do a small short with a close stop on it. I think that area is important because if it rejects I see good downside; breaks through and it can push.
NOTE: if just starting to do options, I think stocks like this are great places to start and learn. Staying close to at the money strikes is easier and learning to capture movements are great compared to dealing with the higher end priced stocks like googl, amzn, nflx, etc. that can swing $50 daily. I always will keep trades on with underlying like this. I go for consistency whether that’s moves of $100 or $1; 5% gains (or whatever amount) are the bigger picture for me

INTCPre market consolidation in supply and failing to get above 62.85 = good recipe for rejection. As mentioned in my prior post for this one, suggested this could be a good entry for a short position!
With a rejection at that level, I think INTC just made it harder for itself to invalidate my bear count. Now we saw it rejected supply and faded right down to demand. If it holds here in this demand zone, think it will pop out and push to 61 - 61.65. Those will be big interest levels as if those get rejected, helps support wave count down, suggesting we would be putting in wave “b” up of the larger degree “(a)” wave down.
Alternative is for price to extend the retrace and try to form a micro 5 wave impulse up out of this demand level. But again, I think for that to happen we would see price up to 61 area followed by retrace back to demand (for waves 1-2).
So thinking either b up of “a” down OR will watch for wave 1-2 to form.
*** I did not enter a position today for this one. I was too caught up with some other projections I was watching but now wish I would have focused more here today. If someone did take this set up today, hope it worked well for you!

INTC63.80 is my invalidation... I’m cautious with this one here. Bear argument is that possibly we are forming a running flat correction to complete overall abc retrace. Then again, how many computers have people and companies have to had buy to set up work from home... I know my work had to purchase a lot!
If we break 63.80 I’ll reassess but until then, with it in a big supply zone from before, I’ll watch for some price action and volume size tomorrow. If it rejects here, still think my downside count will be valid and this would be a good short entry. Again, will see what happens because markets change and my view could very well change to upside. Tonight, however, I’m to downside if we reject.

INTCTouched the down trend line right at beginning of day and right at the end of day. Still leaning to downside.
I know others may have different counts but for me, I’m keeping my count unless we get a higher high above 61.49 for a possible invalidation.
Currently still holding onto small short position I entered other day.

INTCClosed within pennies of the 50% retrace today. Tomorrow will be another day to watch closely. If stays under 59.72 I think it can turn and head towards the 54 price range.
Entered a short position right at end of day just as price closed in on the retrace target. Will invalidate my count if 59.72 is broken.

INTCThe 58 level struggle mentioned to watch for today. Will watch closely here to see what happens. I’m leaning to downside with lower lows and lower highs.

INTCEnd of day we came back out of demand but now looking at it differently. Think 58.78 is going to be important next week if my target of 62 is going to happen (62 is aggressive as 61.85 is the 50% retrace from the start of this overall market drop). If rejected at the supply of 58.78, will be watching and thinking this is the start to the corrective phase down.
58.78 would be 50% retrace for “b” within (a) down. But a retrace to 59.42 - 60 would lead me to think this is wave 2 of 5 down for corrective wave (a) which makes more sense as a-b-c corrections tend to go 5-3-5 waves.
Until Monday...

INTC updateWaited patiently for this to fall back into demand. Lot of selling into demand and took a long position. Rode for a nice quick gain out. Still think it can get to 61/62 but will keep watching.

INTCTook an intraday short trade today when INTC entered (and overshot a bit) a first primary supply level I was targeting. Watched price action and was able to get a good fill on some puts for a nice gain today.
From here I think we continue down to demand level for "b" and then reverse upward towards "c." With the craziness of this market, will watch the up move within "c" as there is potential the "c" wave could become an impulse wave. I don't think this will be the case as I still think the market needs to revisit some downside.

INTC : possible retrace before higherI’m counting 5 waves in for “a.” Looking for retrace to demand for “b” before heading up to price target of $62 for “c.” Will watch to scalp a short but primarily looking for a long position on a retrace.

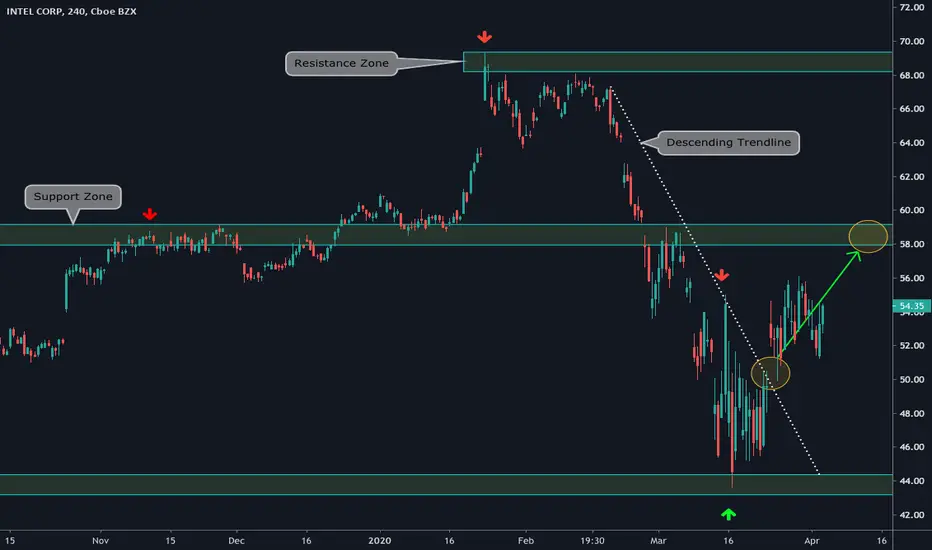
"Intel: going up: by ThinkingAntsOk4H Chart Explanation:
- Price bounced on the Support Zone and broke the Ascending Trendline.
- After that, it is on a Bullish Corrective Structure.
- After the price breaks it, price will up towards the Resistance Zone.
Weekly Vision:
Daily Vision:
Updates coming soon!
INTC : update 1Saw a deep retrace back into Daily Supply. I still think it gets hung up here and we continue to see downward pressure to daily demand around $50.


INTC : overextended wave 5 possibleMajor support has been tested multiple times around $45. Should it fail, with Wave 3 being less than 1.618, wave 5 tends to overextend itself. Targeting a price point of $35 - $33 to look at building a long position to capture a relief bounce for Wave B of the ABC correction (5-3-5) I’m leaning towards.

Intel forms a cup do i hear a handle??Basic analysis of a promising cup and handle formation, firstly I believe tech stocks will hold this market up during this period of uncertainty, and Intel is a great example. With this bullish formation, after a small pullback to form the handle Intel is setup for a nice run. I might go long on this.

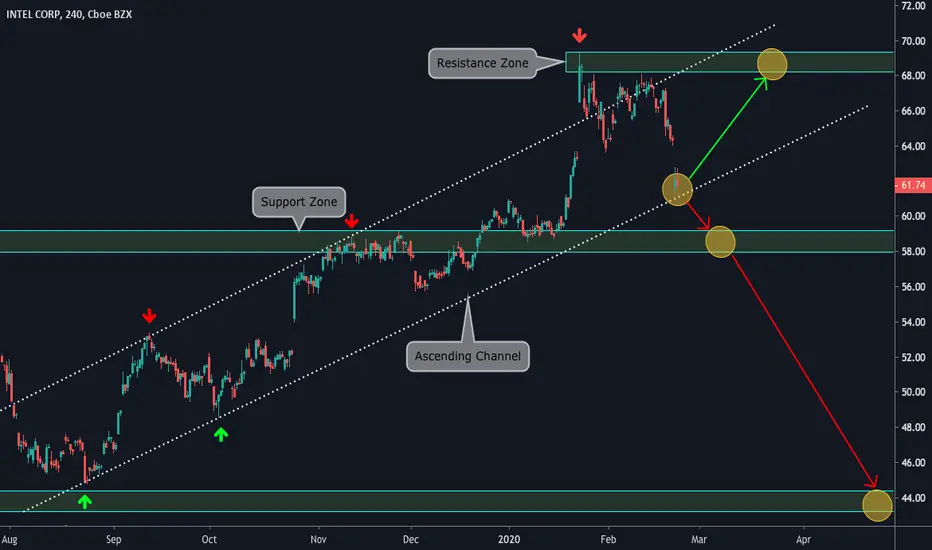
"Intel on a critical level' by ThikingAntsOk4H Chart Explanation:
- Price is on an Ascending Channel.
- It is on the Bottom of the Channel, close to the next Support Zone.
- From here, price may take two ways: 1) start an up move that should take it to the All Time Highs Level; 2) break down the Channel and go towards the Support Zones.
Weekly Vision:
Daily Vision:
Updates coming soon!
Intel pops to median lineAfter a better than expected earnings report, intel has popped into 2 key levels.
Firstly this very long-term pitchfork median line, and secondly this parallel channel on the Daily


Alex Vieira Sees Intel Stock Stupidly Cheap Strong BuyCover and buy! Strong Buy! The Bear Market is Over
