INTC

Intel: Good point to sell with target 33In may opinion the consolidation stage is near to complete. The target of correction can be 33.

Skylake DelaysAnother retest - pullback. I will be watching closely until the end of this week. I am still anticipating a new bear trend.

INTC - Bearish breakdown has started.Friday's price action formed a bearish harami and this morning the price action has momentum forming a potential evening star pattern. Today's price action will need to close below 35 and preferably below 34.95. A close below 7/12/2016 low of 34.48 is our trigger to sell at 34.51 or maybe the last chance to get aboard this pullback to maximize profit.
A sell this morning upon failure of maintaining the open price of 35.18 would be understandable for a aggressive position or for the long position trader looking for a pullback and banking profits.
Enjoy and Good Luck,
PP-Guy

SHORT- Is Skylake coming to market? Demo'd 9/10/2014, late 2015?As my tag PP_Guy states my trading style. I respect and follow price action, pivot points, fib and the square of nine.
The published statistics show a decline of memory products due to demand for some time, demand for these products is weakening. Then we all want to know when this false rally of hope and dreams will correct. I am leaning towards the next corrective phases to be more volatile and price drops even faster due to current market sentiment on high alert.
All input whether bear or bull is accepted as I have been wrong before and will be wrong again, that's trading! I have noted my targets and one can calculate the risk to reward ratios accordingly.


MU: Micron offering a long term long opportunityI like the extended base that formed here, before confirming a weekly uptrend signal, according to 'Time at Mode'.
For those not familiar with the technique, it allows you to read the order flow, track the accumulation and distribution, as well as understand and time the trends present on chart, to get optimal trade entries in any market.
If you combine this powerful methodology, with fundamental analysis, market sentiment tracking, and reaction to news events, you can time entries with great precision.
MU is offering a great weekly long trade here, potential is considerable for this stock, and I'm looking to capture the emerging uptrend I anticipate will take place from here onwards.
Enter longs at market open, if we get a dip towards 10.50 or near that level, add to the position. Risk a drop to $10, for upside well over $14.30.
If interested in my trading signals, or in personal tuition, contact me privately. I'm offering a considerable discount on a packaged course which includes access to my private trading signals list for a year.
Cheers,
Ivan Labrie.


Intel forecastThe long zone starts at the 32.00 level. The potential targets can be the larger offer levels of Institutional Holders. These are the 33.71 and the 34.90 levels.

INTC: Great opportunity for longsIn this post I'd like to share a trade that we have taken with my signals group.
This is a long term trade, aiming to capture a 25 to 42% upside that is pending for INTC in the long run, derived from my technical analysis of the charts, as well as fundamental valuation of the stock.
Trading at a 14 p/e ratio, at 2.75 price to sales ratio, with a 3% yield, and right on a very strong support, while the stock market sentiment reached a bearish extreme, this was a no brainer buy.
Intel has held its own very well in this enviroment, and it's part of our long stocks portfolio among other large cap names.
Feel free to check out Tim West's 'Key Hidden Levels' chatroom, I'm using his earnings support indicator in this chart, a key part of our strategy.
For more details on trading signals and coaching, feel free to contact me.
Cheers,
Ivan Labrie.

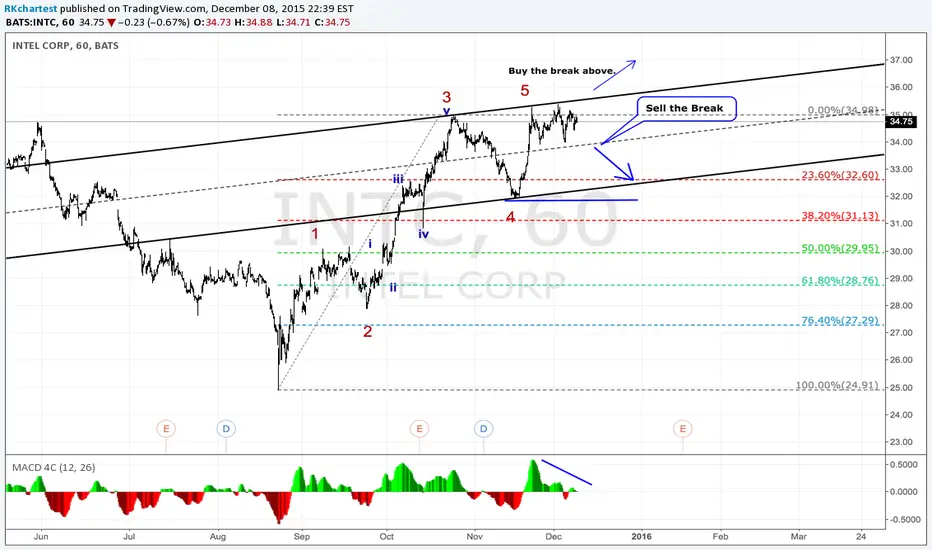
Intel in Flat correction. Intel is in a flat correction. Correction is bound by parallel lines. Break below dotted line will bring short opportunity. Break above top trend line will open a new possible 5 wave count to the upside.
$INTCBest bet for tomorrow!!! Another great long find. Pull back to the upper trend line after break out.
Earnings announcement* for INTC: Oct 13, 2015INTC Earnings Date
Earnings announcement* for INTC: Oct 13, 2015
Intel Corporation is expected* to report earnings on 10/13/2015 after market close. The report will be for the fiscal Quarter ending Sep 2015. According to Zacks Investment Research, based on 19 analysts' forecasts, the consensus EPS forecast for the quarter is $0.59. The reported EPS for the same quarter last year was $0.66.
Highlights from the analysis:
1) INTC's debt-to-equity ratio is very low at 0.23 and is currently below that of the industry average, implying that there has been very successful management of debt levels. Along with the favorable debt-to-equity ratio, the company maintains an adequate quick ratio of 1.31, which illustrates the ability to avoid short-term cash problems.
2) The return on equity has improved slightly when compared to the same quarter one year prior. This can be construed as a modest strength in the organization. Compared to other companies in the Semiconductors & Semiconductor Equipment industry and the overall market on the basis of return on equity, INTEL CORP has underperformed in comparison with the industry average, but has exceeded that of the S&P 500.
3) Regardless of the drop in revenue, the company managed to outperform against the industry average of 11.7%. Since the same quarter one year prior, revenues slightly dropped by 4.6%. Weakness in the company's revenue seems to not be hurting the bottom line, shown by stable earnings per share.
4) The gross profit margin for INTEL CORP is currently very high, coming in at 78.60%. Regardless of INTC's high profit margin, it has managed to decrease from the same period last year. Despite the mixed results of the gross profit margin, the net profit margin of 20.50% trails the industry average.

DOW JONES OVERVIEW: INTEL RESTORES TRENDSIntel is restoring its long term uptrends.
Recently the price broke above 10-year uptrend border, which is marked by the upper 1st standard deviation from 10-year mean.
The breakout is aligned with a break of 1-year downtrend (price broke above the lower 1-st standard deviation from 1-year mean)
If the upwards impulse continues, price will also likely to revert up to the 1-year mean, which is above 5-year uptrend border,marked by the upper 1st standard deviation from 5-year mean.
Which will in turn restore the 2nd long term uptrend (5-year), returning Intel into long term appreciation mode

Everybody's Gone Shortin' - Shortin' U.S.A.In this post I would like to put together some previous stock market calls (still valid), as well as add two more promising shorts. It's been a rough week for US stocks culminating in a clear break of the Head&Shoulders' neckline at 2045. This kind of pattern is usually referred to as "Complex H&S top" , because there are multiple peaks and its "head" is a H&S pattern itself. The traditional target is set in the 1945 area , though we expect a move of greater magnitude. There is a more traditional H&S in LinkedIn. It calls for a sizable move to the downside. Another bearish pattern is a Rising Wedge, or Ending Diagonal, in Bank of America. The first target here is $15 area, which is some 10% from here.
I'm still positioned according to previously published ideas:
Baidu
IBM
Intel
and Procter&Gamble :
All of them are currently profitable.
Best of luck, mates

INTC at critical level on WeeklyHead and shoulders breakdown, riding on 200 ema, and Accumulation/Distribution indicator riding its trendline

INTCPattern valid with the confirmation, short within the structure. The first target seems to be around the trendline. The second target depending on if/when the price reaches first target could be around 22. Second chart will be posted in that scenario. Purely technicall Lets see and Good Luck

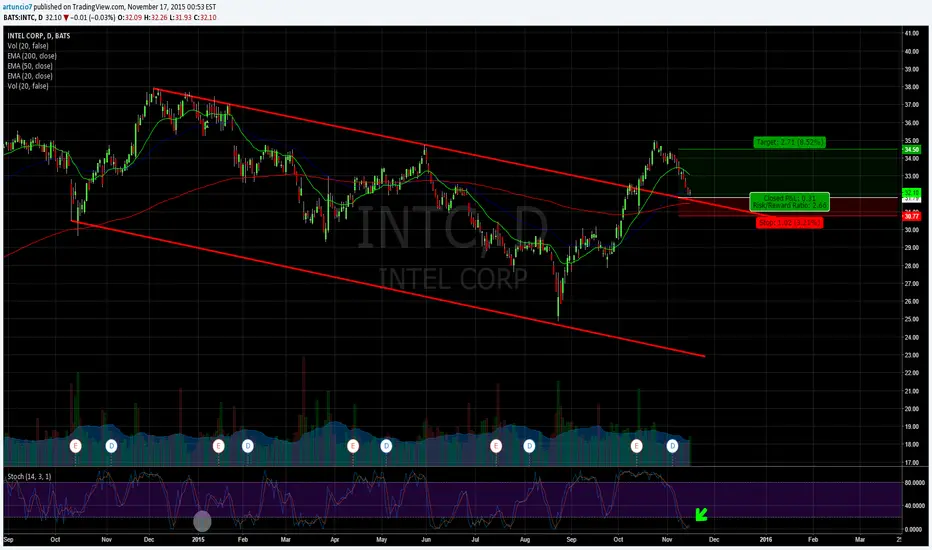
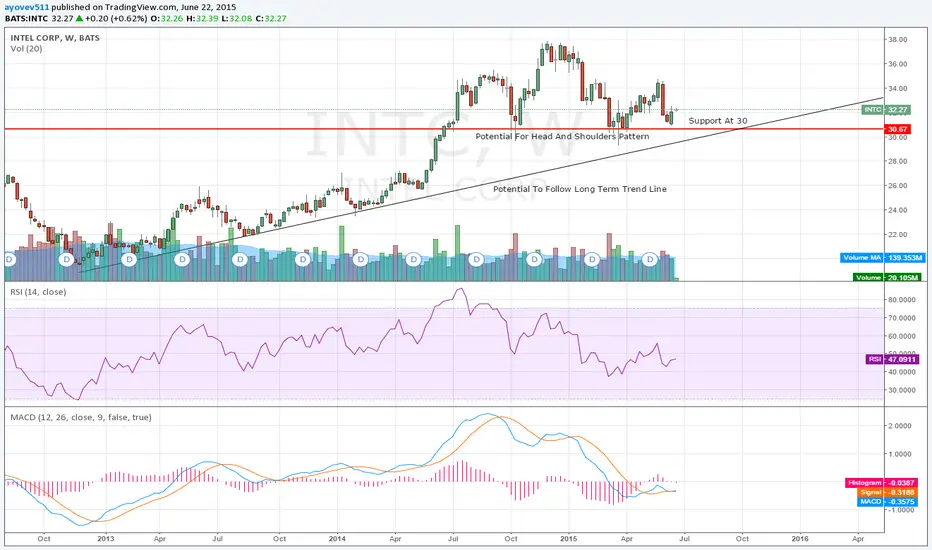
Trends And SupportINTC has two potential options, continue along the long term trend line and break a developing head and shoulders pattern, or continue developing the head and shoulders pattern and break the trend line. Either way, hopefully the support line helps INTC along.
INTC Swing Trade (Brad Reed May29,2015)If INTC rests for a few days before crossing 34.75, then consider an entry above 34.75 If it does not rest, consider an entry at 35.32

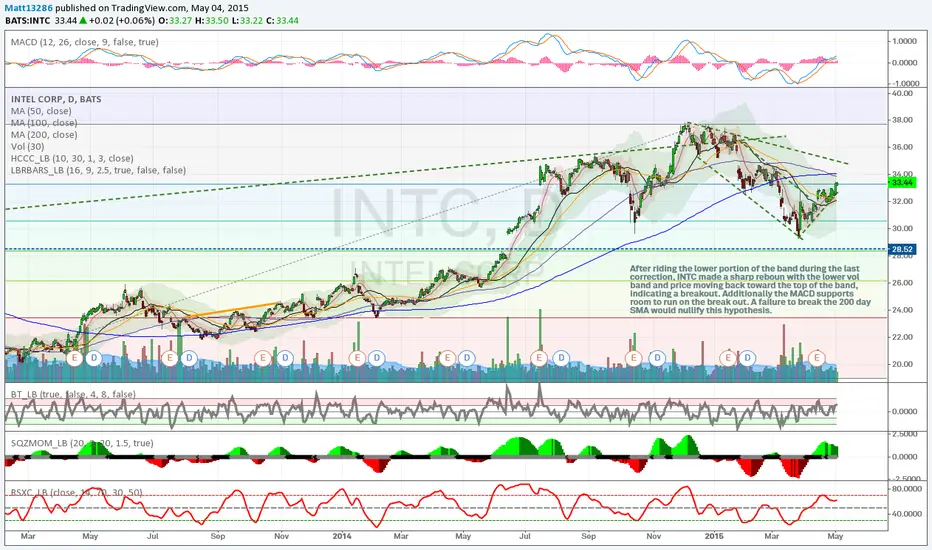
$INTC - Breakout off lower band, MACD Signal, SMA200 as test.After riding the lower portion of the band during the last correction, INTC made a sharp reboun with the lower vol band and price moving back toward the top of the band, indicating a breakout. Additionally the MACD supports room to run on the break out. A failure to break the 200 day SMA would nullify this hypothesis.
Updated Intel - predict $36 to $37 in next 5 sessionsSee chart for IHS / neckline and pitchfork median line.
While elipses on median is for a longer period, the price movement / volume from today implies a rapid move to the midline and $36 to $37 resistance at $33 (the neckline) and then 34.64 ahd 35.33.

INTC Death CrossThe last time INTC's chart performed the death cross it traded from 26.60 to 19.30 in a short period, well it has happened again. Right now we are trading at 30.79 but the pressure is mounting as institutional selling has begun. This to me looks like a great short , at least until earnings in April. INTC's forward looking guidance has the stocks estimate at .42c which is down from last quarters earnings at .74c. With lack of mobile presence and technical chart issues this stock could soon be trading at 26.00.

Intel Breaks Gap Window, Headed To Gap Fill At $31.7Intel Corporation (NASDAQ:INTC) broke gap window today. Gap window is a technical support level (in this case), created by the gap up Intel had following their earnings announcement. Once this level is broken, price generally gravitates to gap fill which is the closing price on the daily chart prior to the earnings report. This will be a big support point for the stock. The Intel Corp gap fill level is $31.75. Please note the chart below.
Gareth Soloway
Chief Market Strategist
www.InTheMoneyStocks.com
