$AMDUSD - Bullish: My target $22 by May 2019Watching for t-k re-cross above bullish 1W ichimoku cloud.
AB=CD harmonic pattern bringing $AMD to $22 by May 2019
Intel


INTEL (INTC) soon will go longINTC has formed a PBT&CA yesterday.
This means that could have found a support level that could be a good entry point.
Stock strenght is above 60.
I'll keep this stock in my watch list and enter when slowstochastic is going above 20 or check on lower timeframes if there is a entry signal.
Disclaimer:
This is just my tought: don't invest based on this idea.

Intel shares Buy IdeaIntel shares Buy Idea @Monthly Demand Zone (36.64 - 33.27)
Buy Limit: 36.64
Stop Loss: 32.71
Take Profit: 44.58

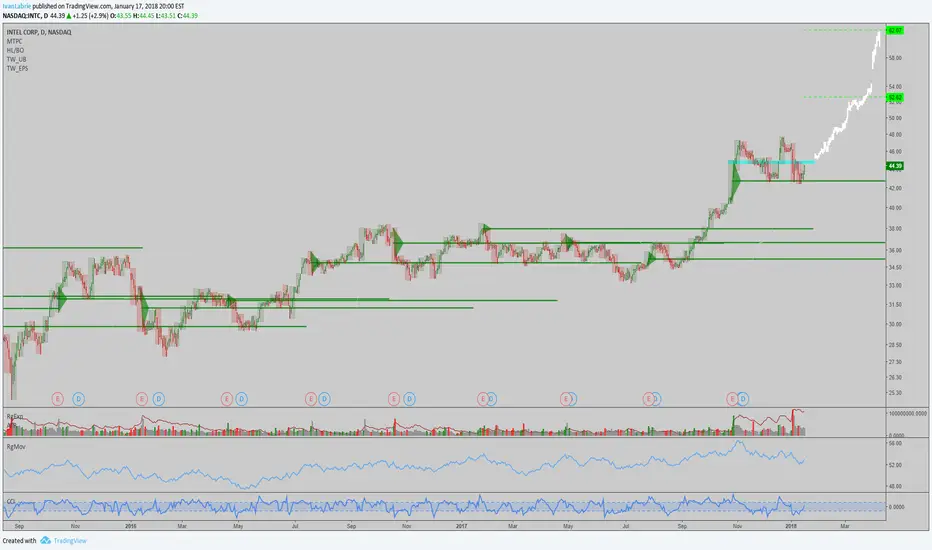
$INTC: Forecast/guessI'm 'hodling' $INTC, my average cost basis is quite good here, so I can afford letthing this winner run. I think we could be in the presence of a huge weekly uptrend but we need to break above the overhead resistance zone before having more confidence in this scenario. For now, I'd reccomend caution and only holding up to 10% of your portfolio in it if invested.
The Spectre and Meltdown security flaws are real and have put a dent in the stock but it's clear long term buyers are still in control, judging by how supply as absorbed lately.
Best of luck,
Ivan Labrie.
Intel shares will rise due to its strong chip sales to companiesWe have immediate resistance at 50.84, passing this level unlocks the upside, and with support of good fundamentals price can reach 60 in the following 2-3 months. Today price up 2% so far.

Watching INTEL, too late to enter the positionIt is just an idea which has some profit, but based on my strategy it is too late to enter the position from risk/reward acceptable ration.

Worth a small bet on Intel in a forming sideways move. I belive it is worth a short bet on Intel corp. It seems like we are in close to top in sideways channel. If you take into account the insecure times, it makes it easier to take a short, despite the enormous bull ride we have experienced in 2017. I belive the market will be different in 2018. It will most likely be a more sideway year.

Intel Stock Intel is forming a broadening trend. If it breaks through the resistance at ~47, it has the potential to reach a target of 52-56. Additionally, the candles remain above the 50 and 200 moving averages. We will see in the next couple weeks!

A+ BEARISH candlestick signalSTOP LOSS : 46.77
TAKE PROFIT : 42.56
Risk-reward : 2.17
Longer term trend: Sideways
Current trend: Bearish
General comments:
Bearish movements seen at the end of Jan-18 with recent low being around $42.5. Price then moved higher till current price whereby it faced strong resistance - a strong daily resistance which coincides with the 50% retracement of the bearish move.
An optimal entry is a few cents lower than the low of the bearish pin bar, which is highly probable to happen.
What I like:
1) Reversal pattern happens in close proximity of strong resistance, meaning stop-loss can be tactically close-by.
2) Grade A+ reversal from a candlestick technical standpoint - excellent 3 bar reversal and pin bar closes very close to the low and below the resistance.
3) Trade is with the current trend.
4) Should the target price be triggered, a head and shoulder pattern will be confirmed. This means another shorting opportunity and to carry our trade even further lower.
Other things to note:
If trade is triggered, it will likely last for a few weeks to about a month.
*A probable head and shoulder chart pattern seems to be in the making. I will be keeping an eye in the foreseeable future.
* Do support by liking and following! All suggestions/feedback welcome!
x,
iskfx


needs a correctionIntel shares rally have to correct its rally to continue upward
i think that it have to test 1st trend line at 43.5's area then 2nd trend line at 40's area before rebound
trade safe and good luck
follow me to know more analysis

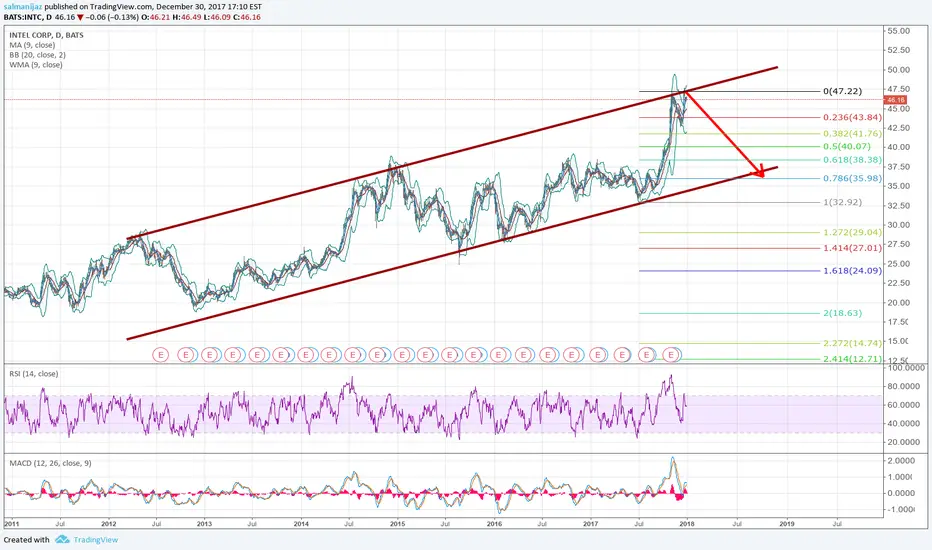
Intel Set To Lead Intermediate Bears DownAlthough, harder to identify at first, Intel Corporation is in the process of Grand Supercycle Wave 3. The stock has most likely met a near-term top or will do so no later than tomorrow, January 23. Our short-term target is 40.50 by the end of February. Our Intermediate target is 30.00 by June of 2019. Once the stock reverses up from this 30 mark, the stock should fly high for a while. Finally, the long-term target is 78.00 well out in to the future (2022-2024). As always, the rest of the stats will be up shortly on our site.

Possible double top on IntelThe double top is not validated yet but its still in formation
Look for confirmation and open this short
INTEL, active closing of positions and decrease to 40.25Active closing of positions and decrease to 40.25 (x-lines level). It should be noted that a short-term correction to 44.68 (x-lines level) is possible.

INTCMy speculation is this is going to b/o toward $50 within the next 30-60 days. Profit taking will come to an end soon.
I am in a long position.
Good luck. Happy trading.

Intel Corp #INTC weekly demand levels created in an uptrendIntel Corp #INTC weekly demand levels created in an uptrend. Longs at new weekly demand zone around 40 with a clear monthly uptrend
Price never pulled back to previous weekly demand zone around 37.25

long IntelAscending triangle monthly, weekly rectangle pattern acting like a launching pattern and now a daily correction which is o good opportunity to find an entry


Intel is breaking outShares of Intel Corp. (INTC) are breaking out of a triple top on the weekly chart going back to the end of 2014. Potential upside targets are around $41.5 in the near-term and $46 in longer-term when using the 127.2% and 161.8% extensions, respectively. Support around $38 needs to hold to confirm the breakout.


Short Put - INTCCash flow play here.
Sold $INTC $34 put for $.56, 1.46 return on capital over the next 25 days. I'll look to rinse and repeat until assigned and then sell calls again.
Breakeven is $34 - .56, or $33.44.

