Intermediate Gain For INTC, Set To Drop FirstOn March 31, 2017 Intel Corporation ( INTC ) crossed above its 100 day moving average (MA), while the 50 day MA crossed below its 150 day MA. This multiple cross event has never occurred before. Historically the stock has crossed above the 100 day MA 241 times. When this happens, the stock does not always continue to gain. It has a median gain of 5.777% and maximum gain of 34.615% over the next 15 trading days. Historically the 50 MA has crossed below the 150 MA 33 times. When this happens, the stock has dropped at least 0.05%. It has a median loss of 4.464% and maximum loss of 23.498% over the next 15 trading days.
When we take a look at other technical indicators, the relative strength index (RSI) is at 57.6486. RSI tends to determine overbought and oversold levels. I personally use anything above 75 as overbought and anything under 25 as oversold. The current reading declares the stock is neutral but heading upward.
The true strength index (TSI) is currently -13.7715. The TSI determines overbought/oversold levels and/or current trend. I solely use this as an indicator of trend as overbought and oversold levels vary. The TSI is double smoothed in its calculation and is a great indicator of upward and downward movement. The current reading declares the stock is trending down, however, the indicator recently hit a low point and has begun to climb.
The positive vortex indicator (VI) is currently 1.1253 and recently crossed above the negative indicator. The VI determines current trend and direction. When the positive level is higher than 1 and higher than the negative indicator, the overall price action is moving upward. When the negative level is higher than 1 and higher than the positive indicator, the overall price action is moving downward. The current reading declares the stock is trending upward.
The stochastic oscillator K value is 84.77 and D value is 72.55. This is a cyclical oscillator that is highly accurate can be used to identify overbought/oversold levels as well as pending reversals. I personally use anything above 80 as overbought and below 20 as oversold. When the K value is higher than the D value, the stock is trending up. When the D value is higher that the K value the stock is trending down. The current reading declares the stock has been trending up but is approaching the overbought level--due to signal a crossover within a week and lead to a decline in the stock.
Considering the moving average crossover, RSI, TSI, VI and stochastic levels, the overall near-term stock direction appears to be trending upward. Based on historical movement compared to current levels and the current position, the stock could gain 4.3% over the next four weeks. I am tracking two scenarios with the latter being most likely. The first one is the stock goes up to my target line without a significant drop. The likely course, the stock could drop by mid-April to the support line of its current trend which would satisfy the stochastic reading. After this drop, the stock would be able to hit my target level of 37.65.
Intel

INTC: Nice correction into supportI liked today's action in $INTC, I'd reccomend reentering longs here, risking a drop to 33.26. Upside is significant, if the monthly/quarterly chart's signals pan out favorably.
Good luck,
Ivan Labrie.

$INTC - Intel Corp - BuyI'm looking at initiating a long on $INTC. Currently oversold and seen rejection from the 200MA which is also a weekly resistance level.
I'll look to buy above last weeks close with stop at $33.
TP at $40.

INTC/AMD and/or INTC/NVDAI think a rotation is in order here. INTC hasn't underperformed this two, and specially AMD like this in a long time. All timeframes look like this might be a bottom in the ratio, so, I'd reccomend swapping your $AMD for $INTC if you have any, and/or take the pair trade. As you know, I'm 10% long $INTC, and also shorting $NVDA, but I have no $AMD position. The $NVDA one will suffice, but I wanted to point this out to investors who might be holding $AMD, sell it while it's hot.
Good luck,
Ivan Labrie.


Intel [1W] Chart 1999 - 2018: Wie weit kann es gehen?NASDAQ:INTC
Check my Blog uforex.de for more informations about full automated Forex Robots / Expert Advisors.

Waiting for ZEN CPU release.Overpriced at the moment however..
No short zone, until Q1 2017 at least.
As usual, buy the rumor and sell the news. Expecting AMD price to start correcting a little the moment ZEN CPUs are out in Q1 2017+, for short term shorting then long term buys.

Intel begins to rise?Signals:
multibottoms
pennant
breakout of inclined resistance
Buy 35.30 (breakout of top pennant's line)
Stop loss 33.85 (-1 tic pennant's low)
Target 40.00 (sizing)
R\R ratio 1:3


Paypal GAP (Visa-Card-Deal)Wegen dem Visa-Card Deal haben wir hier eine übertriebene Reaktion auf den Kurs gesehen, so dass sich ein Gap gebildet hat. Die Wahrscheinlichkeit, dass sich dieses wieder schließen wird, ist ziemlich hoch.

AMD. A big bagrain or a big fraud?Yesterday we´ve probably seen one of the best daily performance from AMD shares in company history. Why is that? Licensing agreement with the chinese. The chinese will be able to develop their own server SoC with a cooperation and based on AMD technologies. Means, they will develop their very own version ot the latest "Opteron" generation and pay to AMD for it.
It is not huge only for AMD, it can be huge for the whole sector. There is someone who´s talking about start licensing the GPU technology as well and, based on ARM Holding experience, that wouldn´t be a bad idea at all.
If happens, this will bring the chip makers to a new stage of competence for market share: the fight for the ending client would lay on the shoulders of license aquirees while a hypotetical AMD, Intel and else may surely leave all or big part of manufactoring operations and concentrate on high value-added R&D. AMD is not the first one to do it and not the biggest, and not the most advanced. But it is the chance for AMD itself to escape from a deadly trap while others haven´t followed the path. Capturing a solid piece of this market will be more than enought for AMD to come back to a solid profitability, recovering strong business model and availability to design a long-term strategy.
Which are the bad points? If AMDs experiment with the chinese show the path is good, Intel is bigger than AMD. AMD arrived first but remember what happened with K8 CPUs when Intel took the Core2Duo family out of the hat. If I were AMD, I´d start securing as much long-term contracts as possible before the others will realise the idea is good. If they secure at least 3-4 more licensing contracts all over the world, it is a strong, solid beginning. Tune your Twitter to news from AMD and Intel, it can be busy.
Second point. Not far away from now, we´ve already seen some ineficcient chinese enterprise to bankrupt. The main question here is: what is THATIC? I recognize, I googled it for 10 minutes and could only find some unconfirmed relationship to China Academy of Sciences (CAS) or Dawning Information Industry. If that´s the case, AMD is in good hands. But for now, the whole licensing agreement looks rather a desperate move. At 2.60 per share you can take a risk. But at 4 per share.... And also that number, 293 million USD in cash. Not trully enough for the whole bunch and complete support on AMD server technologies, right?
Third question, what the US Government will think? There was no reaction for now, probably, because of the second point. But if the deal starts becoming a crude reality and the Gov will find itself in a situation when the rest of manufactorers, specially, Intel, will want to follow the path, AMD may face serious problems which will require quick and severe actions.
Technical analysis confirms: 4-5 figures per share has been a massive frontier and critical level for AMD shares since always. Yesterday, it got rid of weekly 200 MA and WMA (on chart) but stopped at 3.99 and I don´t think that´s coincidence. AMD still has a lot to deliver.
As said before, tune your Twitter to AMD, follow the evolution of the company and check Q2, Q3 and Q4 reports. If the shares start climbing little by little, go over and secure 5 figures per share, and the results are solid, and we get more information about the chinese partner, jump in. If the quote gets stuck somewhere in 3-5 range, this is a patience zone and good option for these who bought at 1.90-2.50 to secure partial profits.

Intel: Good point to sell with target 33In may opinion the consolidation stage is near to complete. The target of correction can be 33.

INTEL POINTS DOWNMany indicators are suggesting the same direction: down. The price is under the cloud and under the rising trendline. Signal line on MACD points down. OBV shows a strong selling pressure. DMI suggests that bears are still controlling the market. Possible targets: the support areas.

MU: Micron offering a long term long opportunityI like the extended base that formed here, before confirming a weekly uptrend signal, according to 'Time at Mode'.
For those not familiar with the technique, it allows you to read the order flow, track the accumulation and distribution, as well as understand and time the trends present on chart, to get optimal trade entries in any market.
If you combine this powerful methodology, with fundamental analysis, market sentiment tracking, and reaction to news events, you can time entries with great precision.
MU is offering a great weekly long trade here, potential is considerable for this stock, and I'm looking to capture the emerging uptrend I anticipate will take place from here onwards.
Enter longs at market open, if we get a dip towards 10.50 or near that level, add to the position. Risk a drop to $10, for upside well over $14.30.
If interested in my trading signals, or in personal tuition, contact me privately. I'm offering a considerable discount on a packaged course which includes access to my private trading signals list for a year.
Cheers,
Ivan Labrie.


Intel forecastThe long zone starts at the 32.00 level. The potential targets can be the larger offer levels of Institutional Holders. These are the 33.71 and the 34.90 levels.

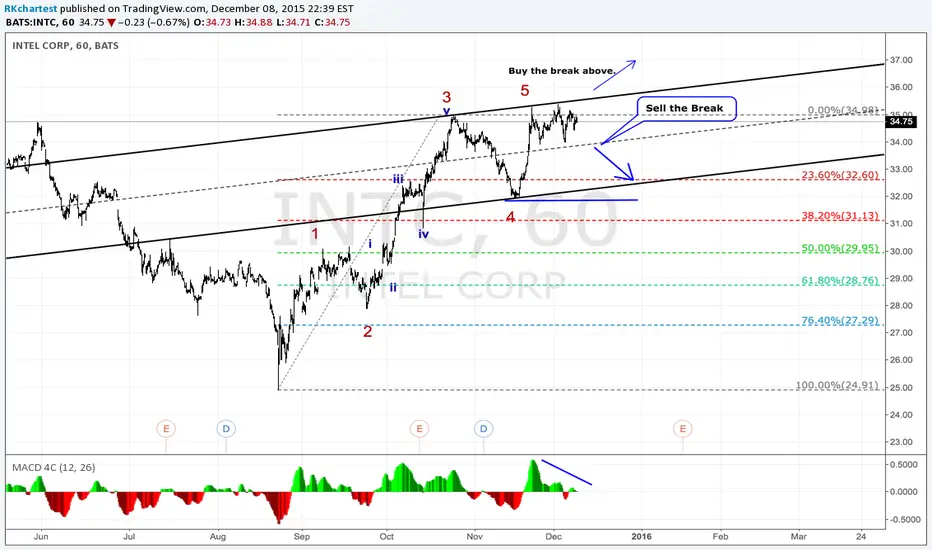
Intel in Flat correction. Intel is in a flat correction. Correction is bound by parallel lines. Break below dotted line will bring short opportunity. Break above top trend line will open a new possible 5 wave count to the upside.
Earnings announcement* for INTC: Oct 13, 2015INTC Earnings Date
Earnings announcement* for INTC: Oct 13, 2015
Intel Corporation is expected* to report earnings on 10/13/2015 after market close. The report will be for the fiscal Quarter ending Sep 2015. According to Zacks Investment Research, based on 19 analysts' forecasts, the consensus EPS forecast for the quarter is $0.59. The reported EPS for the same quarter last year was $0.66.
Highlights from the analysis:
1) INTC's debt-to-equity ratio is very low at 0.23 and is currently below that of the industry average, implying that there has been very successful management of debt levels. Along with the favorable debt-to-equity ratio, the company maintains an adequate quick ratio of 1.31, which illustrates the ability to avoid short-term cash problems.
2) The return on equity has improved slightly when compared to the same quarter one year prior. This can be construed as a modest strength in the organization. Compared to other companies in the Semiconductors & Semiconductor Equipment industry and the overall market on the basis of return on equity, INTEL CORP has underperformed in comparison with the industry average, but has exceeded that of the S&P 500.
3) Regardless of the drop in revenue, the company managed to outperform against the industry average of 11.7%. Since the same quarter one year prior, revenues slightly dropped by 4.6%. Weakness in the company's revenue seems to not be hurting the bottom line, shown by stable earnings per share.
4) The gross profit margin for INTEL CORP is currently very high, coming in at 78.60%. Regardless of INTC's high profit margin, it has managed to decrease from the same period last year. Despite the mixed results of the gross profit margin, the net profit margin of 20.50% trails the industry average.

DOW JONES OVERVIEW: INTEL RESTORES TRENDSIntel is restoring its long term uptrends.
Recently the price broke above 10-year uptrend border, which is marked by the upper 1st standard deviation from 10-year mean.
The breakout is aligned with a break of 1-year downtrend (price broke above the lower 1-st standard deviation from 1-year mean)
If the upwards impulse continues, price will also likely to revert up to the 1-year mean, which is above 5-year uptrend border,marked by the upper 1st standard deviation from 5-year mean.
Which will in turn restore the 2nd long term uptrend (5-year), returning Intel into long term appreciation mode

Everybody's Gone Shortin' - Shortin' U.S.A.In this post I would like to put together some previous stock market calls (still valid), as well as add two more promising shorts. It's been a rough week for US stocks culminating in a clear break of the Head&Shoulders' neckline at 2045. This kind of pattern is usually referred to as "Complex H&S top" , because there are multiple peaks and its "head" is a H&S pattern itself. The traditional target is set in the 1945 area , though we expect a move of greater magnitude. There is a more traditional H&S in LinkedIn. It calls for a sizable move to the downside. Another bearish pattern is a Rising Wedge, or Ending Diagonal, in Bank of America. The first target here is $15 area, which is some 10% from here.
I'm still positioned according to previously published ideas:
Baidu
IBM
Intel
and Procter&Gamble :
All of them are currently profitable.
Best of luck, mates

INTCPattern valid with the confirmation, short within the structure. The first target seems to be around the trendline. The second target depending on if/when the price reaches first target could be around 22. Second chart will be posted in that scenario. Purely technicall Lets see and Good Luck

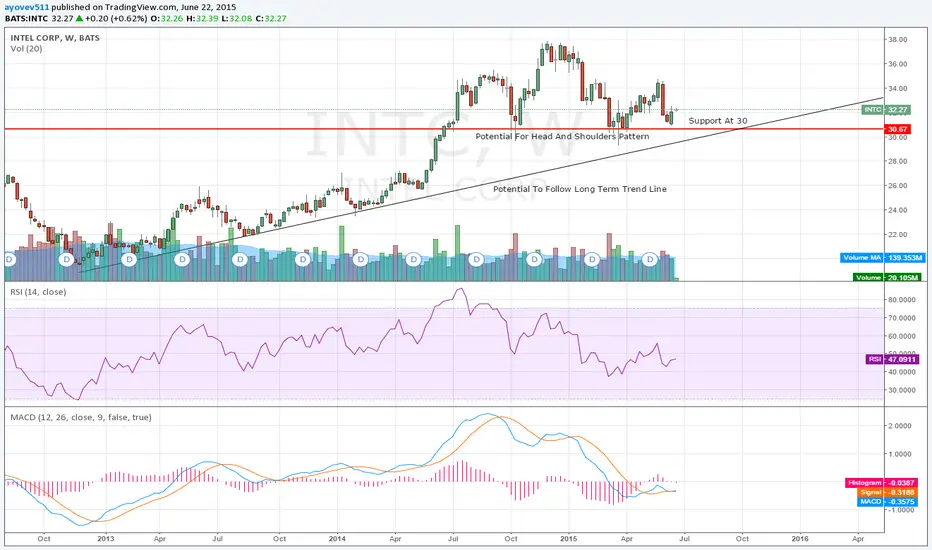
Trends And SupportINTC has two potential options, continue along the long term trend line and break a developing head and shoulders pattern, or continue developing the head and shoulders pattern and break the trend line. Either way, hopefully the support line helps INTC along.
INTC - Is Intel still a human company?If INTC (Intel) wants better intel, they need to buy CRM (Salesforce). Who can call the CEO's, send me a few shares for the idea, and make this deal happen?
Who would you rather build the future, humans or artificial intelligence?
