WSJ Reports Intel Set for $11 Billion Deal With ApolloIntel ( NASDAQ:INTC ) is in advanced talks for a $11 billion deal with Apollo Global Management to build a facility in Ireland. The move comes as Intel ( NASDAQ:INTC ) plans to expand its presence across the United States with a $100-billion spending spree across four states to boost its manufacturing business and catch up with chipmaking rival TSMC. Intel and Apollo are in exclusive talks for the deal, which could be signed in the coming weeks.
Other investment firms including KKR and infrastructure investor Stonepeak were also in the running before Apollo recently pulled ahead. Intel forecasted second-quarter revenue and profit below market estimates last month due to weak demand for its traditional data center and personal computing chips. The company announced plans in 2022 to build chip factories in Ireland and France to benefit from easier European Commission funding rules and subsidies.
Technical Outlook
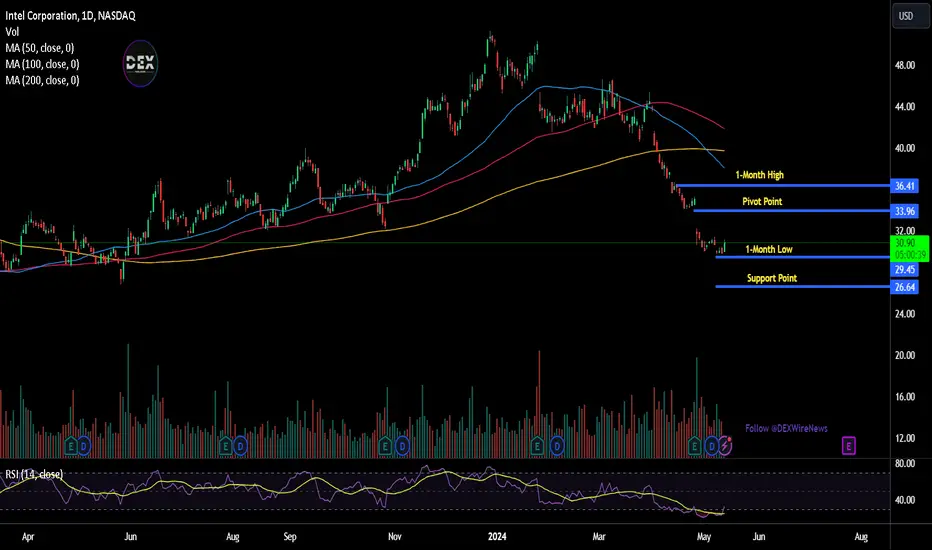
Intel Corp ( NASDAQ:INTC ) stock is up 3.58% trading below the 200, 100, and 50-day Moving Averages (MA) respectively. Despite the recent development, Intel Corp stock ( NASDAQ:INTC ) has a weak Relative Strength Index (RSI) of 32.62, poised for further growth.
Intelcorporation
Intel - What is going on?Hello Traders and Investors, today I will take a look at Intel Corporation.
--------
Explanation of my video analysis:
In April of 2022 we saw a major break towards the downside on Intel stock which was then followed by more bearish continuation of roughly -65%. Then Intel retested a multi year long structure and created a pretty decent bullish reversal and a strong (short covering rally). At the moment Intel just rejected previous structure and is now in a massively bearish market soit is best to just wait for this volatility to calm down.
--------
Keep your long term vision,
Philip (BasicTrading)

Intel stock Dips as US Slaps Restrictions on Chip Sale to ChinaIntel Corp ( NASDAQ:INTC ) has revised its current-quarter revenue guidance after the US Department of Commerce revoked certain licenses for exporting certain items to a Chinese company. The move comes amid U.S. alarm at Huawei's ability to develop advanced chips, as demonstrated in the Mate 60 Pro smartphone released in August, despite sweeping export controls introduced in 2022. The revoked licenses are the latest tit-for-tat between Washington and Beijing over the sale of advanced semiconductors to China by U.S. firms. The Biden Administration has been putting limits on the sale of such chips, citing national security concerns, while last month, China reportedly told its telecom companies to phase out the use of foreign semiconductors.
Intel ( NASDAQ:INTC ) did not disclose who the Chinese company was, but the Financial Times reported that the Biden administration had revoked export licenses that allowed both the U.S. firm and domestic rival Qualcomm (QCOM) to supply chips to Chinese telecom-equipment maker Huawei. The move affects the supply of chips for Huawei’s laptop computers and mobile phones. The move comes amid U.S. alarm at Huawei’s ability to develop advanced chips, as shown in the Mate 60 Pro smartphone released in August, despite sweeping export controls introduced in 2022.
The revoked licenses are the latest tit-for-tat between Washington and Beijing over the sale of advanced semiconductors to China by U.S. firms. The Biden Administration has been putting limits on the sale of such chips, citing national security concerns, while last month, China reportedly told its telecom companies to phase out the use of foreign semiconductors. Intel shares were down 2.9% at $29.80 on Wednesday afternoon after the company said it expects revenue for the second quarter to remain in the range of $12.5 billion to $13.5 billion, but below the midpoint. Intel ( NASDAQ:INTC ) shares have lost nearly 38% so far this year.

Intel Plummets 13% in Almost Four Years After Tepid ForecastIntel Corp., ( NASDAQ:INTC ) the biggest maker of personal computer processors, Plummeted by over 13% the most in almost four years on Friday Market trading after giving a weak forecast for the current period, indicating that it’s still struggling to return to the top tier of the chip industry.
The Sales in the second quarter will be about $13 billion, the company said in a statement Thursday. That is an average analyst estimate of $13.6 billion.
Chief Executive Officer Pat Gelsinger signals a push to regenerate Intel ( NASDAQ:INTC ) back to its feets. Once the world’s dominant chipmaker, the company is lagging behind rivals such as Nvidia Corp. and Taiwan Semiconductor Manufacturing Co. in revenue and technological know-how.
Business has been slower than for Intel Corp ( NASDAQ:INTC ) Chief Financial Officer Dave Zinsner said he expected an improvement later this year. Intel ( NASDAQ:INTC ) also wasn’t able to meet all the demand for processors used in new AI-enabled PCs because its packaging facilities weren’t able to produce enough components.
Intel ( NASDAQ:INTC ) shares fell as much as 13% in New York to $30.64, the biggest intraday decline since July 2020. The stock had already declined 30% this year through the close on Thursday, making it the second-worst performer on the Philadelphia Stock Exchange Semiconductor Index.
In the First quarter, the California-based company had a profit of 18 cents a share, excluding certain items, and revenue of $12.7 billion. Analysts had estimated a profit of 13 cents a share and sales of $12.7 billion.
The chipmaker is reporting earnings for the first time under a new business structure that shows the financial performance of its manufacturing operations. Gelsinger has said the approach is a necessary step to make operations more efficient and competitive. Intel ( NASDAQ:INTC ) also has been building up a foundry business, which manufactures components for outside companies on a contract basis.
This month, the company gave investors the first look at the financial state of its factory network. Spending on new plants has caused losses to widen, and Intel ( NASDAQ:INTC ) doesn’t expect the business to reach a break-even point for several years.
Intel Foundry, the new division responsible for manufacturing, had sales of $18.9 billion in 2023, down from $27.5 billion the previous year. The unit had revenue of $4.4 billion in the first quarter of 2024.
The foundry business had an operating loss of about $2.5 billion in the first quarter, wider than the losses posted in the preceding quarter and the one a year earlier.
The company’s PC-related chip sales were $7.5 billion, compared with an average estimate of $7.4 billion. Its data center and AI division had revenue of $3 billion, in line with Wall Street projections. Networking chips provided nearly $1.4 billion of sales, beating an average estimate of $1.3 billion.
Gross margin — or the percentage of sales remaining after deducting the cost of production — was 45.1% in the quarter. That closely watched measure, which reflects the efficiency of Intel’s manufacturing operations, will be 43.5% in the current period. Historically Intel has posted margins of more than 60%.
Intel ( NASDAQ:INTC ) remains optimistic about the second half of the year because it’s rolling out a new version of the Gaudi chip — its answer to the red-hot AI accelerators sold by Nvidia. That product line will bring in about $500 million in sales this year, once the latest version goes on sale, Intel projected.
Zinsner said "Intel Corp ( NASDAQ:INTC ) is also making progress at reining in costs and expects the manufacturing business to break even in the “next couple of years,”.
Gelsinger said the company has signed up another customer for a production technology called 18A, which Intel ( NASDAQ:INTC ) will introduce in 2025. That brings the total to six. The customer, which Intel didn’t identify, is in the aerospace-defense industry and wants production located in the US, Gelsinger said.
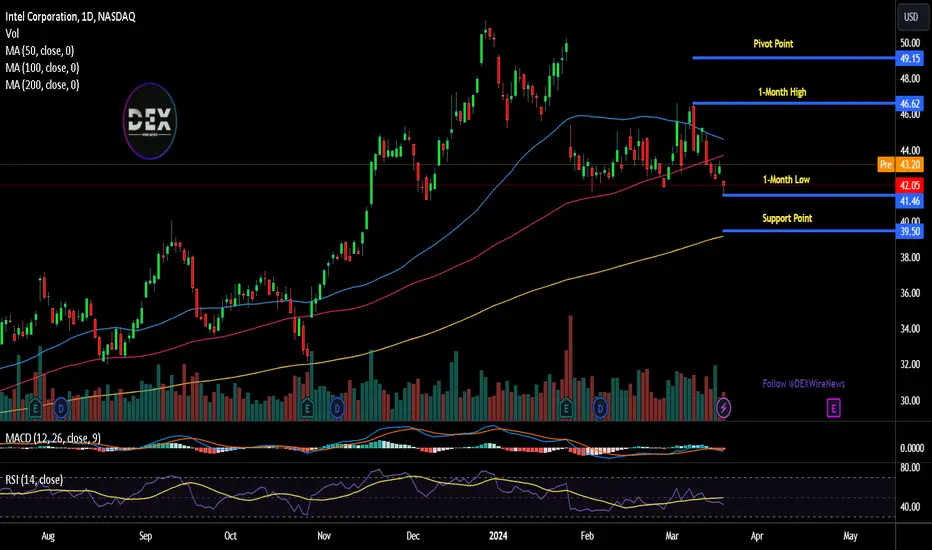
Technical Outlook
Intel Corp ( NASDAQ:INTC ) stock was down by 11% on Friday market trading below the 200-day Moving Average (MA) with a weak Relative Strength Index (RSI) of 23 indicating an oversold condition for the ticker.

Intel's Gaudi 3 AI Chip Unveiled: A Race Against NvidiaIntel ( NASDAQ:INTC ) has raised the stakes in the competitive arena of artificial intelligence (AI) chips by unveiling its latest innovation, the Gaudi 3. As chipmakers intensify their efforts to produce semiconductors capable of training and deploying complex AI models, Intel's Gaudi 3 emerges as a formidable contender, poised to challenge Nvidia's dominance in the AI chip market. With promises of superior performance and energy efficiency, Intel aims to carve out a significant share in this rapidly evolving landscape, signaling a new chapter in the battle for AI supremacy.
Gaudi 3: A Leap Forward in AI Chip Technology:
Intel's Gaudi 3 chip represents a significant advancement in AI chip technology, boasting impressive power efficiency and enhanced performance capabilities. With claims of being over twice as power-efficient and one-and-a-half times faster than Nvidia's H100 GPU, the Gaudi 3 sets a new benchmark for AI processing efficiency. Designed to cater to a range of AI applications, from deployment training, the Gaudi 3 showcases Intel's commitment to innovation and technological excellence.
Rivalry with Nvidia:
The unveiling of the Gaudi 3 signals Intel's intent to challenge Nvidia's dominant position in the AI chip market. With Nvidia currently holding an estimated 80% market share, Intel's entry poses a significant threat to Nvidia's supremacy. Intel's competitive pricing strategy, coupled with its distinctive features such as the integrated network on chip, positions the Gaudi 3 as a compelling alternative to Nvidia's offerings.
Expanding Market Opportunities:
As the demand for AI chips continues to surge, fueled by the growth of cloud computing and AI-driven applications, Intel sees significant expansion opportunities. In particular, the data center AI market is expected to witness robust growth as cloud providers and businesses invest in AI infrastructure. With the Gaudi 3 poised to address the evolving needs of AI builders and developers, Intel aims to capitalize on these market trends and capture a larger share of the AI chip market.
Collaborative Ecosystem and Open Software Approach:
In its pursuit of market leadership, Intel is adopting a collaborative approach, partnering with industry giants such as Google, Qualcomm, and Arm to develop open software solutions for AI. By fostering an open ecosystem and providing software flexibility, Intel aims to empower customers with the freedom to choose their preferred chip providers, challenging Nvidia's proprietary software suite.
Conclusion:
Intel's unveiling of the Gaudi 3 AI chip marks a significant milestone in the company's quest to challenge Nvidia's dominance in the AI chip market. With promises of superior performance, energy efficiency, and competitive pricing, the Gaudi 3 emerges as a potent contender in the race for AI supremacy. As Intel continues to innovate and expand its presence in the AI ecosystem, the competition between chipmakers intensifies, promising exciting developments and advancements in the field of artificial intelligence.
Note: Intel's Gaudi 3 chip is expected to be available to customers in the third quarter, heralding a new era of AI processing capabilities.

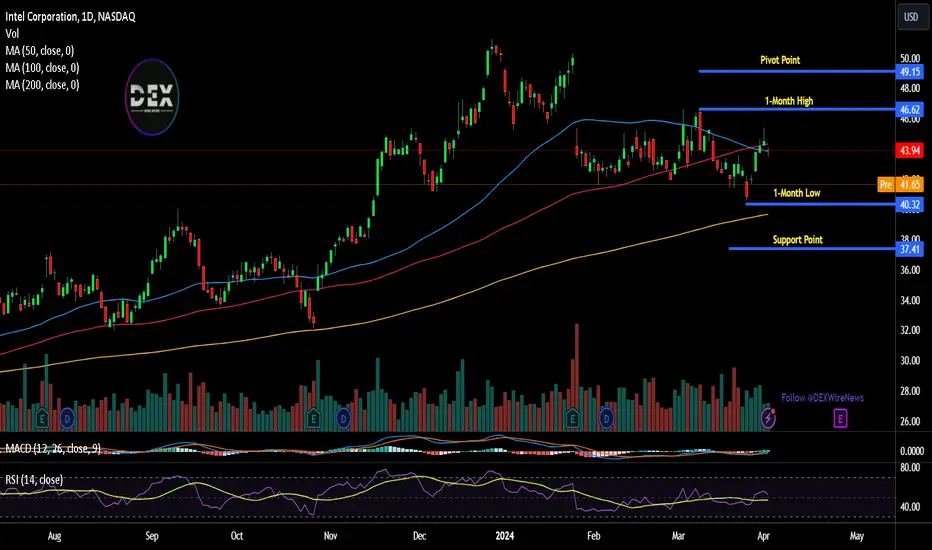
INTC potential buy setupReasons for bullish bias:
- Price bounced from strong weekly support
- Price respected channel support
- Weekly and daily bullish candle closing
Entry Level (CMP): 43.28
Stop Loss Level: 39.56
Take Profit Level 1: 47
Take Profit Level 2: 50.72
Take Profit Level 3: Open

Intel's Foundry Stumbles: Can the Chip Giant Catch UpIn the high-stakes world of semiconductor manufacturing, Intel ( NASDAQ:INTC ) finds itself in a race against time to reclaim its dominance. However, recent revelations about the company's foundry business underscore the uphill battle it faces in catching up with its arch-rival, Taiwan Semiconductor Manufacturing Co. (TSMC).
The latest blow came with Intel's admission of ballooning losses at its contract chip-making business, sending its shares tumbling by 5% before the bell on Wednesday. The numbers paint a grim picture: operating losses of $7 billion in 2023, a significant increase from $5.2 billion the previous year. This signals a widening chasm between Intel and TSMC, casting doubt on Intel's ability to bridge the profitability gap anytime soon.
Analysts, such as Stacy Rasgon from Bernstein, have expressed skepticism, suggesting that Intel could be facing several years of substantial headwinds. Despite Intel's aggressive capital investments – totaling $43.4 billion in "construction in progress" as of December 2023 – and plans to spend $100 billion on plants across the United States, doubts linger over whether these efforts will yield the desired results.
CEO Pat Gelsinger's reassurances about the foundry business's future profitability haven't assuaged concerns. Gelsinger predicts that operating losses will peak in 2024 before breaking even by around 2027, but with TSMC boasting a 53% gross margin compared to Intel's projected 40% by 2030, the gap remains substantial.
The contrast between the two giants becomes starker when examining revenue figures. TSMC's revenue in the final quarter of 2023 stood at a staggering $19.52 billion, dwarfing Intel's foundry unit's sales of $18.9 billion for the entire year. This vast difference underscores the magnitude of the challenge facing Intel.
One of the key factors behind Intel's struggles has been its past missteps. Gelsinger admits that decisions such as forgoing the use of extreme ultraviolet (EUV) machines from ASML have hindered the company's progress. Intel's belated switch to EUV tools reflects a recognition of the need to embrace cutting-edge technology to remain competitive.
As Intel grapples with these challenges, questions arise about its ability to execute its ambitious plans and regain its position as a dominant force in chip manufacturing. The company's fortunes are intertwined with the success of its foundry business, and failure to close the gap with TSMC could have far-reaching consequences.
In the fiercely competitive semiconductor landscape, where innovation and efficiency reign supreme, Intel finds itself at a critical juncture. The road ahead is fraught with challenges, but whether Intel can rise to the occasion and reclaim its former glory remains to be seen. As the industry watches with bated breath, the battle for semiconductor supremacy continues unabated.
Intel Corporation UpWe hit support.
We had 2 good days up strong buying from support.
Great opportunity for a 1/1 trade.

Intel ($INTC) Gets $20 Billion in US GrantsIn a landmark move aimed at revitalizing the domestic semiconductor sector, the Biden administration has announced a staggering $20 billion investment package for Intel Corporation ( NASDAQ:INTC ). The funds, comprising $8.5 billion in grants and up to $11 billion in loans, represent the largest award under a program designed to bolster the American chip industry.
The substantial investment is set to fuel Intel's ambitious expansion plans, with the company pledging more than $100 billion in US investments. This includes initiatives to ramp up production of cutting-edge semiconductors at sprawling facilities in Arizona and Ohio, as well as supporting research and development endeavors and advanced packaging projects at smaller sites in Oregon and New Mexico.
President Joe Biden himself is slated to visit an Intel campus in Phoenix to announce the preliminary agreement, highlighting the significance of the deal. Intel's selection as the recipient of the first Chips Act funding deal for advanced chipmaking facilities underscores the company's pivotal role in the administration's efforts to reinvigorate the nation's chip manufacturing capabilities.
The announcement has already triggered a positive market response, with Intel shares surging by 3.5% in premarket trading. The news comes at a crucial juncture for Intel, which has been engaged in an ambitious turnaround bid under CEO Pat Gelsinger's leadership.
Gelsinger's strategic vision includes not only expanding Intel's foundry business but also reclaiming the company's technological prowess, which had lagged behind Asian competitors in recent years. Securing high-profile partnerships, such as with Microsoft Corp., further solidifies Intel's position as a key player in the global semiconductor landscape.
The significance of the government's investment in Intel extends beyond mere financial support. It represents a concerted effort to reverse decades of offshoring semiconductor production and to bolster America's competitiveness in an increasingly vital industry.
While the funding is a significant step forward, Gelsinger acknowledges that more may be needed to fully address the challenges facing the US chip industry. He suggests that additional initiatives, akin to a hypothetical "Chips II," may be necessary to sustainably restore America's chip manufacturing capabilities.
The agreement between Intel and the government underscores a shared commitment to revitalizing the semiconductor sector, with the potential to create tens of thousands of jobs across multiple states. Beyond commercial production, Intel is also set to receive funding for the manufacturing of military and intelligence chips, further highlighting the strategic importance of the initiative.
As Intel embarks on this transformative journey, eyes are on the company to deliver on its promises and drive innovation in the semiconductor space. With the backing of substantial government support, Intel is poised to play a pivotal role in reshaping the future of American chip manufacturing and securing its position as a global leader in the industry.
Intel - Potential Trading SetupHello Traders, welcome to today's analysis of Intel.
--------
Explanation of my video analysis:
In 2017 we had a major triangle breakout on Intel which was followed by a +70% rally. Then in 2022 Intel broke major support towards the downside and reversed perfectly at a major previous structure. Since Intel is now back to a bullish market, I am just waiting for a retest of the level mentioned in the analysis and then I will be looking for long continuation setups.
--------
I will only take a trade if all the rules of my strategy are satisfied.
Let me know in the comment section below if you have any questions.
Keep your long term vision.

Intel Faces Headwinds Amidst Soft Q1 Outlook
Intel Corporation ( NASDAQ:INTC ) , a stalwart in the semiconductor industry, is currently weathering a storm as its shares plunged over 11% in pre-market trading following a sobering first-quarter outlook. Despite delivering better-than-expected fourth-quarter results, the chipmaker's CEO, Pat Gelsinger, anticipates a challenging start to 2024, attributing the softened outlook to weaknesses in subsidiaries and the programmable chip unit. We delve into the key factors driving Intel's recent struggles and explore the implications for investors.
The Q1 Outlook:
Intel's 9 NASDAQ:INTC ) projection for the first quarter paints a challenging picture, with adjusted earnings expected to be 13 cents per share and revenues ranging between $12.2 billion and $13.2 billion. This forecast falls short of Wall Street's expectations, prompting concerns among investors. Gelsinger reassured analysts that the core businesses of PCs and servers remain healthy, citing no areas for market share loss and highlighting the strength of the company's products.
Challenges in Subsidiaries and Programmable Chip Unit:
A notable contributor to Intel's tempered outlook is the weakness in several subsidiaries and the programmable chip unit. Gelsinger acknowledged these challenges but emphasized the overall health of the core business. The company's CEO remains optimistic about overcoming these hurdles, with AI chip orders worth $2 billion and a projection for improved sales later in the year.
Gaming and Commercial Sectors as Bright Spots:
Despite the overarching concerns, Intel's ( NASDAQ:INTC ) fourth-quarter results showcased a 33% increase in sales from its Client Computing division, driven by robust performance in the gaming and commercial sectors. Gelsinger sees these areas as pockets of strength within the PC chip market, expecting a broader normalization throughout 2024 after a two-year slump.
Technical Analysis and Head and Shoulders Pattern:
Intel's ( NASDAQ:INTC ) stock, after breaking out from a nine-month ascending channel in mid-December, faces challenges in gaining further upside momentum. Investors are closely watching the stock's relationship with its 50-day moving average, as a close below this indicator would confirm a head and shoulders topping pattern. Such a confirmation could open the door for a decline towards the lower trendline of the channel. On the flip side, a successful hold of the indicator might empower bulls to make another attempt at a move higher.
Conclusion:
Intel's ( NASDAQ:INTC ) current predicament underscores the complex dynamics at play in the semiconductor industry. While the company faces short-term headwinds, CEO Pat Gelsinger's optimism about the core businesses and future prospects, including AI chip orders and expected sales improvement, adds a layer of resilience to the narrative. Investors will keenly monitor how Intel ( NASDAQ:INTC ) navigates these challenges and whether the technical patterns manifest as predicted, making the coming months a critical period for the semiconductor giant.

Intel - Clear StructureHello Traders, welcome to today's analysis of Intel.
--------
Explanation of my video analysis:
In 2022 Intel broke a massive previous support level at the $45 area towards the downside. This break was followed by a drop of roughly -50%. With a perfect retest of a very long term structure level, this recent pump on Intel was quite anticipated. If Intel pulls back to the previous support level mentioned in the analysis, I am looking for potential long setups.
--------
I will only take a trade if all the rules of my strategy are satisfied.
Let me know in the comment section below if you have any questions.
Keep your long term vision.

Intel - The Anticipated RallyHello Traders, welcome to today's analysis of Intel.
I will only take a trade if all the rules of my strategy are satisfied.
Let me know in the comment section below if you have any questions.
Keep your long term vision.

Intel's Unveiling of New AI Products Lead's to Price SurgeShares of Intel (NASDAQ: NASDAQ:INTC ) were climbing through out yesterday, seemingly in response to its "AI Everywhere" event. The chipmaker also seems to have gotten a modest boost from the Federal Reserve's decision to keep interest rates steady yesterday and its dovish forecast for next year.
Intel unveils new AI products
The company launched three new chips at the AI Everywhere event today. The first was the Intel Core Ultra mobile processor family, which Intel says offers its most power-efficient PC processors and will accelerate the development of the artificial intelligence (AI)-powered PC.
It also announced the fifth-generation Intel Xeon processor, built with AI acceleration, and CEO Pat Gelsinger showcased the Intel Gaudi 3 AI accelerator for the first time, which will be available next year.
Intel is also partnering with more than 100 software vendors to bring new AI applications to the PC market.
What's next for Intel?
Based on the stock's gains today, the market seems to approve of the presentation. Intel should be able to fill a need in the market here as there is a clear shortage of AI chips and processors -- companies like OpenAI and Oracle have complained that they simply don't have the capacity to keep up with demand.
Also, NASDAQ:INTC is trading above all of its Moving Averages indicating a Continual Bullish Trend.

WOW OH WOW. Minus $1 to target please!!INTC is failed the most recent high, it broke its uptrend and sold off right below the point of control (yellow line). I would expect a sell-off to continue to the .382 (white line which is also the next area with the most amount of volume traded.
Calculate Your Risk/Reward so you don't lose more than 1% of your account per trade.
Every day the charts provide new information. You have to adjust or get REKT.
Love it or hate it, hit that thumbs up and share your thoughts below!
This is not financial advice. This is for educational purposes only.
INTEL 10-month Channel Up targeting $40 and $43 in extension.Intel Corporation (INTC) has been trading within a Channel Up throughout the whole year and as you can see on the chart, the pressure points are best displayed with the use of the Fibonacci Channel levels. Last Thursday's bottom on the Higher Lows trend-line couldn't have come at a stronger demand level, as it hit (and immediately rebounded on) the 1D MA200 (orange trend-line).
The price even broke and closed above the 1D MA50 (blue trend-line) yesterday and more importantly completed the first 1D MACD Bullish Cross below 0.0 since August 30. It is a similar rebound sequence where again the price was just above the 1D MA50 and eventually completed a +25.24% rise, marginally above the 1.382 Fibonacci horizontal extension. Every time the 1D MACD formed a Bullish Cross below 0.0 within this Channel Up, we had the same bullish confirmation signal and the stock rose by +25.24%, +38.83%, +36.47% on those occasions, always hitting at least the 1.382 horizontal Fib level.
As a result, we expect the stock to complete the 'minimum' +25.20% fractal rise, thus we target $40.00 on the short-term and on the long-term, extend to at least $43.00, which is the 1.382 Fibonacci extension and would make an optimal technical Higher High on the 2023 Channel Up.
-------------------------------------------------------------------------------
** Please LIKE 👍, FOLLOW ✅, SHARE 🙌 and COMMENT ✍ if you enjoy this idea! Also share your ideas and charts in the comments section below! This is best way to keep it relevant, support us, keep the content here free and allow the idea to reach as many people as possible. **
-------------------------------------------------------------------------------
💸💸💸💸💸💸
👇 👇 👇 👇 👇 👇

Intel's Is Gaining MomentumPrice Movement
INTC is trading near the top of its 52-week range and above its 200-day simple moving average.
Investors are applying buying pressure to INTC shares today.
Intel (INTC) reported third quarter results that surpassed expectations on both revenue and earnings. The company also issued better-than-expected fourth quarter guidance. Intel CEO Pat Gelsinger acknowledges there were some headwinds Intel was facing when he took the job, and his goal was to "rebuild this iconic company." With the latest results, he says "people can see the momentum is building" at Intel thanks to cost-saving initiatives, product execution, and its internal foundry model.
Intel plans to launch new products including the Core Ultra processor, which Gelsinger nicknamed the "AI PC". Gelsinger says the AI PC aims to keep users from having to go to the cloud to utilize AI, instead, the features and data are readily available on the device itself to improve productivity. Gelsinger says these products will help Intel capitalize on the "surge in AI interest we're seeing across the board."
With new products slated to launch over the next two years in its data center unit, Intel CEO Pat Gelsinger believes the chipmaker can regain lost market share and boost competitiveness, stating 2024 is when Intel will "start gaining back share" thanks to its upcoming product releases.

Intel (INTC) -> Don't Forget This StockMy name is Philip, I am a German swing-trader with 4+ years of trading experience and I only trade stocks , crypto , options and indices 🖥️
I only focus on the higher timeframes because this allows me to massively capitalize on the major market swings and cycles without getting caught up in the short term noise.
This is how you build real long term wealth!
In today's anaylsis I want to take a look at the bigger picture on Intel.
Looking back at January of 2023 - after a massive dump during 2022 - Intel stock perfectly retested and started to reject a major monthly structure level at the $27 level.
With the next clear resistance level being at $46 I am now expecting more upside on Intel stock before we could then see a short term rejection away from the $46 resistance area.
- - - - - - - - - - - - - - - - - - - -
I know that this is a quite simple trading approach but over the past 4 years I've realized that simplicity and consistency are much more important than any trading strategy.
Keep the long term vision🫡

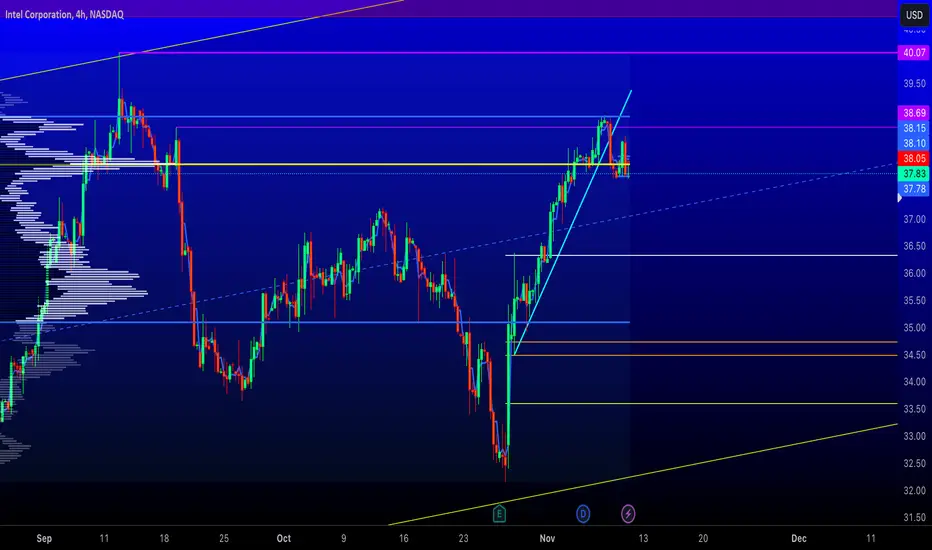
INTEL CORPORATION still bullish market for expect
Hi viwers, INTC in last periods bullish trend we are can see, here now zone breaked, showed strong volumen, for next peridos still bullish trend here expecting to see.
TP1: 41.41
TP2: 44.40

INTEL time to start booming
Hi viewers, INTC here strong bullish porgress technically watched in next periods to expect
TP1:31
TP2:33
TP3:35

Intel: Go for it! 💪 Since the low of wave x in orange, Intel has already shown strong upwards movement and should soon conquer the resistance at $37.11, heading for the compound consisting of the turquoise zone between $41.59 and $43.13 and the orange zone between $42.32 and $43.63. There, the share should complete wave 4 in turquoise and return below $37.11 afterward. However, there is a 34% chance that Intel could shift southwards earlier already and drop below the support at $26.86, triggering further descent below $24.55. In that case, we would consider wave alt.4 to be finished by now.

Sell signal in Intel
Intel seem to be around the end of this upswing cycle. It may start coming down in a day or two.

IntelI think that this share is currently in a 5-wave downward trend, which is completing its 2nd wave at this moment.
This stock has completed a 5-wave in the monthly time frame, and as a result, the current 5-wave can be wave A.
The best point for taking the position of shorts has been determined. I hope it will be fruitful for you.
Be successful and profitable
