TLT BreakThe iShares 20+ Year Treasury Bond ETF (TLT) tracks an index composed of U.S. Treasury bonds with maturities greater than twenty years. The price of TLT goes down as interest on 20+ year U.S. treasuries goes up. High inflation is driving interest rates ever higher . If inflation does not slow soon, a decades-long trend could end, as this chart is warning.
The monthly exponential moving average (EMA) ribbons have experienced their worse violation in the fund's 20 year history. Typically the monthly EMA ribbons act as very strong long term support. The lower 55 month EMA band can act as a low risk to reward long entry. The price at which the monthly candle closes is determinative.
Fortunately, there is roughly an 80% chance that the 20-year bull trend in the price of TLT will hold in March 2022. (This probability comes from the standard deviation from the monthly mean). So for now, at least, the trend is likely to continue. However, the chart suggests that the decades-long trend is dangerously close to breaking.
Interest

10-year at the top of long term channelWill the 10 year finally break out of this long term down channel? The Fed and entire investment world says yes it will and soon. But the chart says it may have a little trouble exceeding this level in the near term.

Bear structure still in play #Bitcoin #FOMCAggressive rate projection for 2023 by the #FED was the main highlight from the meeting
in an effort to curb #inflation expectations
2.5% is the target of it expectations for 2023
(which is unsustainable due to the high levels of debt in the system)

BTC Update W1 ChartBitcoin has been showing big volatility last two month becuase of FED interest speculation and Russia vs Ukraine crisis. But weekly chart still bullish and indicates BTC can have a big rally in next 12-16 weeks. RSI showing bullish divergence, MACD showing low sell pressure like June 20221 and stock RSI indicate market can give bounce with short term noise.
First resistance on W1 chart is $45k then $53k while support is at $36k and $29k.
Try to understand chart and trade between the lines.
Major events: Russia/Ukraine and FED interest speculation.
Trade safely :)

Federal Fund Rates Slim MarginsSimple late night doodles with some input of previous crashes from: fred.stlouisfed.org/series/FEDFUNDS and some simple trend following to suggest the increasing fragility of the effect that marginally increased rates may have on the economy.
FRED:FEDFUNDS

MSFT Put And Call Options Investors in Microsoft Corporation (Symbol: MSFT) saw new options begin trading this week, for the October 21st expiration. One of the key data points that goes into the price an option buyer is willing to pay, is the time value, so with 245 days until expiration the newly trading contracts represent a possible opportunity for sellers of puts or calls to achieve a higher premium than would be available for the contracts with a closer expiration. At Stock Options Channel, our YieldBoost formula has looked up and down the MSFT options chain for the new October 21st contracts and identified one put and one call contract of particular interest.
The put contract at the $280.00 strike price has a current bid of $22.40. If an investor was to sell-to-open that put contract, they are committing to purchase the stock at $280.00, but will also collect the premium, putting the cost basis of the shares at $257.60 (before broker commissions). To an investor already interested in purchasing shares of MSFT, that could represent an attractive alternative to paying $289.44/share today.

Real Estate Is Rolling OverToday we are taking a look at the Case Shiller Home Index on a year-over-year chart as well as a price chart and using basic, long-term technicals to identify issues and opportunities. I believe we are heading into a recession over the next few years but we will have to see what crazy government program is created to fight that recession that maybe boosts housing back up. Don't forget in 2009 they were printing a ton of money and it didn't save the housing market. I believe home prices on a national level will fall between 25-30% by July 2025 and July 2026. This will depend on if we get UBI, a war, or major hikes in interest rates to fight inflation. Although, I don't believe the FED can hike rates too high because we can't afford the interest on the debt then due to the short-term rollovers.
Overall, I am bullish on cash flow real estate in growing areas with growing incomes that have freedom in mind. These areas are experiencing growth at a high rate but some of them are getting overheated. On a national level, I expect this all to play out over 3.5-5 years.
Make sure you comment below. Argue your points with others, like, follow, and watch an ad if one pops up to support free information. It only costs you a few seconds.

Inflation, bond yields, the dollar and the Fed! Macro series pt1Part 1 Hello everyone! It's been a few weeks since my last update on the markets, and this one is going to be a very special one. Will go through many different aspects of most major markets, by using both technical and fundamental analysis. It will be an in-depth analysis with lots of charts of several instruments, that have the potential to give us a clear picture of where we are and what is going right now in the global landscape. Because there are so many things I'd like to mention, I've broken the analysis down in different parts, all of which you will be able to find on the links down below.
The first and most important pieces of the puzzle are the US Dollar and interest rates, as together they are one of the largest components in essentially every market as they partially determine the liquidity and demand, by ‘setting a price for money’. In 2020 many forecasters predicted that the value of the dollar would collapse and said it was dead as it had lost 10-15% of its value relative to other fiat currencies. Yet they were very wrong in 2021 as the dollar bottomed and started rising along with interest rates, despite inflation skyrocketing in the latter part of the year. At the same time many claimed that the bond market would collapse, yet even though long term US bond yields had been rising from Aug 2020 up until Mar 2021, just to barely get to pre-pandemic levels where bond yields were already really low. Then went sideways until the end of 2021, where they started rising again. During that time short term US bond yields were close to 0 and only started rising at the end of Sep 2021 as inflation started climbing fast and the market started anticipating the Fed raising rates. Therefore, as those yields were rising due to inflation going up, so did the USD which might seem counterintuitive. Why would it go up if it’s losing purchasing power?
Well fiat currencies are trading against other fiat currencies and the world is heavily interconnected, so it’s a relative game and inflation wasn’t just US phenomenon. However most importantly it was clear that inflation didn’t come due to the Fed doing QE or lowering rates, but due to several other factors. To name a few 1. Government spending, 2. Credit creation during Covid, 3. Deferred loan/rent payments, 4. Wealth effect due to stocks/housing going up, 5. Supply chain issues, 6. Supply shortages due to labor shortages or businesses closing, 7. Pend up demand, 8. Higher demand for goods than services, as well as demand of new types of goods, and finally and most importantly 9. Issues in the energy sector and particularly due to the fact that many oil and natural gas wells got shut and weren’t reopened. Now you might be thinking ‘wait a second, where does QE fit into all of this?’. Unlike what most people believe about QE or low interest rates, the Fed doesn’t print money. It simply creates reserves which the banks can’t use to buy anything and low interest rates are a sign that the economy is in trouble as banks aren’t willing to lend to anyone other than big institutions. QE isn’t inflationary as it is just an asset swap and the Fed doesn’t determine anything aside from short-term rates. So, what does the Fed actually do? Essentially, they are trying to push banks to lend, yet banks refuse to do so, and in turn the Fed tries to manage expectations. It all boils down to the Fed making people believe they know what they are doing and that they are a powerful institution that can either create or fight inflation. Therefore, in the list of factors there is another one (no. 10) which is that the Fed convinced everyone that they flooded the world with cash and that affected the spending/investing habits of the people that believed them. Yet there was a market that hasn’t really believed them, and that is the bond market.
The bond market keeps indicating that we are stuck in a low growth environment where inflation isn’t a long-term issue, just a short term one. It is also telling us that there is too much debt and too many problems, many of which policy makers haven’t been able to solve. Not only that, but many of the policies have been making things worse and worse, and that in 2022 it looks like inflation is probably going to slow down. Hence if markets and the data are telling us inflation isn’t going to be a major issue in 2022 and the sources of inflation are elsewhere, why will the Fed raise rates? Can it raise rates? By how much? What impact will that have on the economy?
For the first question there are some pretty clear explanations. One of them is that Fed wants to raise rates is so that people keep believing in that they can control inflation and that they aren’t just there to pump the stock market. Many believe in the Fed put, which is the belief that the Fed doesn’t want to do anything to upset the markets and that if things go bad the Fed will support the stock market because it can. However, another one is that there are also many people who are upset about inflation and want someone to do something. These people demand the Fed to act, as the Fed itself claims to have the tools to fight inflation and that it created the inflation in the first place. Hence at the moment the Fed is stuck between a rock and a hard place, as markets are at ATHs, housing at ATHs, the economy is slowing down and overall is in a pretty bad place, while for most people the costs of living are up by 10-20% compared to 2 years ago. By the Fed’s own mandates and admissions, inflation above 2% is high (CPI was at 7% YoY) and their reasoning for QE + low rates has been their goal of full employment… and as we’ve reached a point where unemployment is very low and there are even labor shortages as many people haven’t gotten back to the labor force since the pandemic begun. This in turn puts pressure on wages and inflation, hence the Fed has to act based on its own ‘goals’. Yet if they act, and especially if they act quickly, the markets could crash and this could have even more implications on the economy. It is pretty clear that they have to walk a fine line, except it’s also pretty much impossible for their actions not to affect the markets which are overleveraged and are showing signs of weakness. On the one hand they need the markets to come down a bit, in order to slow down the wealth effect which affects inflation, as well as prevent excess speculation from going even further… and on the other hand they must not overdo it because the whole system could grind to a halt.
Keeping all of the above in mind, it seems pretty hard for the Fed to significantly raise rates. Yesterday when Powell started answering questions, he was pretty hawkish because people aren’t taking the Fed seriously, but there is a long way between them talking about being serious and them actually doing it. Doing both QT and raising rates more than 3 times this year, something that the market seems to be expecting at the moment seems a bit farfetched. Like Alex Gurevich said on his recent appearance on ‘The Market Huddle’ podcast (and I am paraphrasing a bit), the most likely scenario for the Fed is to raise rates once. In his view they could do one and not hike again for a decade. Maybe they get two or more, but 1 is more likely than 2, and 2 are more likely than 3… and so on. He also mentioned that he thinks we in the late stages of this cycle, and I happen to agree with both views. My reasoning is that the inflationary factors mentioned earlier seem to be weakening substantially and slowly giving their place to the disinflationary/deflationary factors like supply chains issues being slowly resolved, less government spending, debt accumulated during the pandemic having to be repaid and so on. Inflation in 2021 was really high, though towards the end of the year several data points started showing that it was slowing down and in 2022 we could have 2-3% inflation or even outright deflation. To sum it all up, the Fed will start raising rates too late, as real rates have already started coming up and could go up even higher inflation starts going lower. The impact this could have on an overleveraged market is substantial, something that could force the Fed to stop raising rates and even stop its talks about reducing its balance sheet… or maybe even force them to go back into cutting rates and doing QE.
Up to this point we’ve only talked about rates, but haven’t mentioned anything about the USD and how it could affect entire financial system. This is another very important factor that the Fed needs to be aware off, even if they haven’t been explicit about it recently. The USD is the global reserve currency and most of the world’s debt is denominated in USD, which means that when it goes up relative to other currencies, then debt repayments become harder especially for those who don’t earn USD. At the same time when US interest rates go up AND the USD goes up relative to other currencies, that creates immense pressure on the financial system. That’s because people/institutions have to pay more interest on their loans, while the currency they are earning and need to convert into dollars to repay their debt, is worth less and less. These two factors create some serious deflationary pressures as someone might be forced to cut their spending or even outright sell assets in order to keep up with his obligations. Of course, in a situation where the entire globe is doing well and rates go up because the economies are booming, debt is low, and it just happens that the USD is going up as it happens that the US is doing better than other countries, then the dollar going up isn’t really an issue and neither are rates. However, the dollar going up, especially along with interest rates really is an issue when the world is drowning in debt, economies aren’t doing well, markets are overleveraged and optimized to work well in a low-rate environment. Another thing to keep in mind is that the dollar going up might create a vicious loop by accelerating the sell-off in traditional markets as more and more people sell in order to meet their obligations, or take a risk off stance or to take advantage of higher interest rates or to take advantage of its rise relative to other currencies. At the end of the day the US isn’t an economy that functions in isolation and it isn’t the only one that uses or CREATES dollars. That’s something crucial that many people forget, as even if the US economy is doing great and higher rates might be appropriate for the US, the actions by the Fed could create issues in other parts of the world, which in turn could damage the US economy.

Get into hard assets nowI wish the US FED didn't cut off information before 2000.
This OMINOUS chart is saying that even with 22% interest rates that STARTED at 5% from 1967-1981 peak, all it did was slow down asset purchases and price increases for 20 years, shown in red.
The consumer price impact of the recent spike in government spending hasn't even started, and interest rates are at basically nothing. Anything below 5% will have zero actual impact to curb inflation. This is the last chance to get into commodities.

$DXY needs to hodl the line 👁🗨*This is not financial advice, so trade at your own risks*
*My team digs deep and finds stocks that are expected to perform well based off multiple confluences*
*Experienced traders understand the uphill battle in timing the market, so instead my team focuses mainly on risk management*
FOMC meeting next week, February 16, 2022. Here are our expectations for $DXY.
!! This chart analysis is for reference purposes only !!
If you want to see more, please like and follow us @SimplyShowMeTheMoney

DXY finally show weakness, a Temporary Down trend!After several days that DXY have been surging to pass the middle of the uptrend parallel channel, today it show a little bit weakness.
weakness or strength of fiat (specially DXY) is playing a significant role for risky market. however since FOMC plan to increase the interest rate and bond yield profit, DXY start to surge and
influenced stock market and other integrated markets such as Crypto.
based on Price action if today's candle close on 96.7 , it would be good sign for risky markets, although FOMC might take actions by increasing interest rate, shrinking balance sheet in order to control the demand cycle.
I'm still believing that markets need time to adopt with these new situations .
5 times of increasing interest rate and tension between Russia and Ukraine are prefigured by markets but the Q1 and Q2 of 2022 wouldn't be good for stock markets and Crypto.

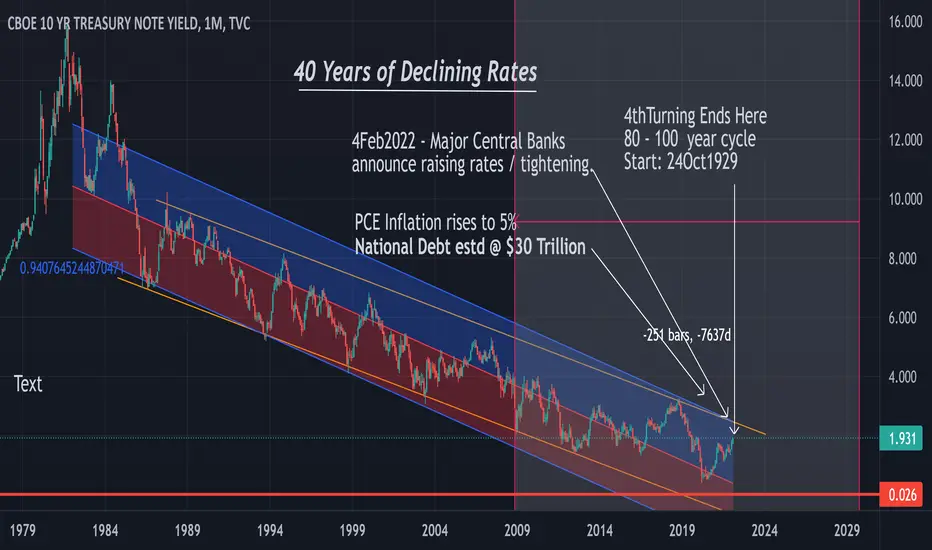
THE 40 YEAR BEAR MARKET IN 10 YEAR TREASURY NOTE INTEREST RATEThe attached chart shows 40 years of declining 10 year rates. As we all know, that rate is the basis for mortgage rates and just about everything else. During that half cycle the housing market boomed, the stock market boomed and generally speaking, corporations and individuals prospered.
But that trend has ended.
Thursday I would have said that rates would either remain low for an indefinite period while inflation soared or rates would be raised to quell inflation. But Friday Central Banks around the world announced tightening.
The party is over!
It is time to batten down the hatches, lock in long term profits on stocks, rentals and any other investments that correlate inversely with interest rates.
Obviously the major players saw this coming and started bailing at the first of2022.
Now us little fish must do what we can to avoid losing the wealth we have.
As an aside, it was announced last year that Bill Gates was diversifying into farm land. Obviously that anticipates food shortages and inflation.............
I will post more on this once the picture becomes clearer.
midnitepoet
Mortgage Rates Back In An Uptrend Trend On 30 Year-Fixed Historically in America the interest rate for a 30 year fixed has been in a multi-decade down trend. As of January 2021 the rate for a 30 year fixed dropped to a historical low of around 2.65% and has since reversed in trend. This year we can potentially see rates continue to rise up to 3.75% as we're in secondary uptrend on the line chart. Currently we're at around 3.45% up 30% from 2.65% we seen last year.

Bolster your MATIC coin count EVERY Monday!Yes, this article is about where to store the coin that powers the best platform for smart contracts and Dapps in Ethereum layer 2 solution format, Polygon (MATIC)! But for the uninitiated to unbanking yourself, here is a quick rundown on the Celsius application, which you should be storing your tokens/coins on. Celsius Network is reliable, easy-to-use, growing in popularity and regulated and licensed by the SEC and the U.S. Treasury. I know, surprising huh!? It is now in its 4th year. They do not spend time or money on big-money ads. They would rather pay us in interest every Monday! Word of mouth has been their main source of advertising... like I am doing now. They now have over 1 million members including me and my friends (fellow retired Air Force member) and family (my grown daughter). And so far, I see no safer way to earn 10.51% APY on your Polygon (MATIC). If you live outside the U.S., you could even boost your earnings to over 14% by opting to receive your interest in CEL tokens. But we live in Texas, so my daughter "settles" for a safe 10.51% in polygon that will soon double and triple in value. The interest is more MATIC coins! A win-win. They do have 41 tokens and coins they support including stablecoins (which pay 8.8% or more if you opt to be rewarded in CEL). I personally earn 13.99% on my SNX tokens on Celsius. It pays to check it out...and if you open an account, use my daughter's referral code: 1691390756 or mine: 189218504d
Move at least $400 worth of crypto to Celsius.Network and after 30 days, we will both be rewarded $50 worth of BTC! This beats the hell out of any brick & mortar bank!

SNX: Another week, another upgrade!Synthetix Network and Kwenta are still blasting away at upgrades, or as they call them, "SIP's" which is an acronym for Synthetix Improvement Proposal. They also give weird "star" names to their SIP releases (in order of visual magnitude) which is all good, I suppose. What matters is they are in storm mode when it comes to improving and implementing. I love it. Where this may cause some occasional turmoil in usage and possibly hinder immediate price action, I see it as further reason to hold for the long term as I continue to grow my SNX coin/token count weekly at 13.99% APY by simply holding SNX in a Celsius Network account (If you decide to join me in earning high interest there, you can earn $50 in BTC by using my referral code 189218504d). Of course, we will reap the rewards in price action eventually, but on our own timeline. I am conservatively predicting a 300 percent gain over the next 6 to 9 months. And my 13.99% yield will compound in a doubling fashion every 5 years even without any price action increases. Yes, I did the math! Patience pays well!
Anyway, later today the Avior (the "star" name for SIP-182) release will implement a new upgrade on L2 only. During this release there will be no downtime on L1, but up to 3 hours of downtime L2. Here's what’s included in this release:
SIP-182- Wrappr factory: This SIP creates a new WrapperFactory contract that can deploy new Wrapper contracts to support any ERC20 token. The new Wrapper contract behaves like its predecessor (the ETH Wrappr from SIP-112) and will initially include a WETH wrapper, though more Wrapprs will likely be added in the future.
In layman's term, creating "wrapprs" has to do with creating synths or derivatives...potentially on anything tradable in the entire world, like Cryptos, FOREX, Stocks, Commodities, etc. Well, you get the idea; everything. This is the strength and foundational idea of the Synthetix Network (and Kwenta). If you want more info on what I am doing to generate that 13.99% in additional SNX tokens, feel free to ask in a comment.

USDTRY Crab Formation: Decision Maker's fault. After the Central Bank of Turkey reduced the policy rate from 18 percent to 16 percent, #USDTRY are reaching D leg of crab formation. Politicians are not still showing any support to TL. Therefore 2nd target level 11,25 is not far away.

Analysis of BTCUSD levels of interest; suggested price Vmax zoneBulls will need to see this volume bar at continue to increase in magnitude. Failure to further develop the volume at the current spot price likely suggests pullback potential; pullback potential is limited, perhaps, to the next lowest volume profile peak circa ~56,965 USD. Notice, the 54,391.69 to 49,244.89 has notably low development on the volume profile; this low magnitude suggests that in the event of a pullback, price action will move with high velocity through this area. Peak velocity of price movement is expected to hit a Vmax at 52,630.94. However, this is better considered a price level of high importance, as it could easily also become a new support level, where buyers seek to buy BTC at a "discount," or, in stark contrast, breakdown into this level could potentially lead to a drawdown/correction - only time can tell. No recommendations. Not trade advice.

EURNZD: As rates increase, the currency growsNew Zealand national bank increased rates from 0.25 to 0.50 points. It doesn't take a genius to imagine how that impacts the price of the EURNZD pair. With higher interest rates, it is more beneficial for the banks to hold NZD. Plus this pair was in a downtrend before that.
The most recent lows are broken ( dashed green ). A somewhat recent low meets a 2019 swing low of around 1.63 - this could be a temporary stop for the price ( green, transparent green ).
A descending channel could be drawn here stretching from this June 2021 till Now. If I project its biggest breakout under the channel's angle, I will get the same support around 1.63
If the market believes that European Central Bank may increase the rates as well, the price should make another short-term bottom there. If it does, one of the broken supports will be tested, perhaps it will even reach the middle of the channel.
Is it likely though? Indebted Italy and Greece would be in trouble if the rates on their debts increased further.
I don't know about future fundamentals, but I think some long entries will be found in the area - especially on lower timeframes and I plan to join!

COMP/USDTCOMPOUND trend in falling wedge where make a bottom at 279$ and then test it three times ..so my conclusion is "that is a solid bottom :)" then broke falling wedge pattern make support on golden pocket 315$ ..now need to flip resistance to support at 338$. where make a potencial W pattern/bullish ..potencial long price is on the chart..cheers

Stocks To Watch This WeekThe Market's longer term uptrend still intact. Interest rates are driving the market.. These names have shown good relative strength and accumulation volume and most are in the growth sector. This may give good risk/reward entries on some of the best names. Some of these charts still need to confirm their price action. This video is my watchlist. Most of these names are at or near all time highs or multi year highs. There are 21 total stocks on this list Many of these have IPO'd in the last few years and still have a growth story ahead of them. Know your time frame and risk tolerance. Know your earnings dates! I go through these quickly so grab a pencil and paper and jot down the names that look interesting to you and then make the trade your own. Good Luck!

This has been so good to meHi everyone This my own idea and not any advice this has been so good to me and wanted to share for anyone else that might see what I do

GBPUSD - basic Interest Rates StudyThis is a simple study of how interest rates influence the market.
I included 10 last values in my indicator. The base currency (GBP) is black. The second currency (USD) is red.
Between June and December, FED (USD) increased the interest rates 3 times by 0.250
BoE (GBP) also increased the interest rates by the same number but only once.
Obviously, this was a catalyst for a major bearish move. Not only that the rates difference had already been bearish at a time. The gap between the rates further increased! But look at the moment when BoE increased their rates. Even if insignificant for the long-term, it started a good counter-trend rally in the short-term.
In 2019, FED decreased the rate a few times, hence the difference changed a little in favor of GBP. At look how long the pair grew. It even smashed the previous highs until it resumed its downward trend based on the rate difference.
March 2020 was full of interest rate changes across all currencies. When BoE dropped the rate a little (in relative terms), FED decreased the dollar's interest rate rather drastically leading to a more than a year and a half long rally. Although it is losing its steam, it might yet continue for a while.
I created two indicators that can be used to study these relations and create a long-term vision once the rates change again (might take a moment to update). You can find them both in the public library :)

VZ $65 PT printing ascending channel Verizon is well-positioned for the increasing consumer demand for better networks and services as the company continues implementing its 5G technology, which could be a catalyst putting the company back on the growth path.5G subscriptions are expected to reach 3 billion subscriptions worldwide by 2025. Moreover, the fifth-generation connectivity is expected to drive the market growth of Artificial Intelligence and the Internet of Things (IoT). Internet connectivity is expected to show a fast speed with very low latency.A recent study expects explosive growth in 5G wireless subscriptions in the U.S. over the coming years. The study reads The number of US 5G mobile service subscriptions will increase 161.4% to 41.3 million in 2021, with growth expected to continue at tremendous rates for several years. Great time to get in technically as the VZ is in a clear ascending triangle within a larger ascending channel which has been in play for over a year. Given we are at the lower range of this channel I believe its a great time to pick up some VZ which has proven to be a safe stock that does well in times of uncertainty relative to the market as a whole, and can help bring your portfolio's beta or volatility down.
