DXY Outlook FOMC Prep 14th JuneWill the Federal Reserve finally decide to pause on further rate hikes, keeping interest rates at 5.25%, or will the Feds hike rates one final time to take rates to 5.50%?
There has been much speculation about the likely outcome of the US FOMC regarding its interest rate decision.
Especially with the most recent CPI data being released at 4.0% (Expected 4.1% Previous 4.9%) a significant slowdown in inflation growth is being witnessed and it is likely to play towards encouraging the Feds to pause on further hikes.
Although the June unemployment rate rose slightly to 3.7%, the NFP was still significantly stronger than expected at 339k.
There are several technical analysis factors applying the downward pressures on the DXY, in particular, the downward trendline, 50MA and the 103.40 resistance level.
If the Feds does pause on rates, I'd be looking for the DXY to trade down to the support area of 102.80 and 103, which coincides with the 50% Fibonacci retracement level.
Interestrates

EURUSD before FEDCPI data came out yesterday and EURUSD hit the 1.0800 resistance and is holding at those levels for now.
Today we await the most important news.
At 20:00 Bulgarian time, the FED will announce the decision on interest rates, and 30 minutes later the press conference will begin.
Regardless of the decision, we will see large fluctuations and it is advisable to reduce the risk beforehand.
The objective remains confirmation of the upward movement here, with possible stops in both directions.

Ultimate Catalyst : Interest Rates NewsWe saw our increase on Eurusd Halted after the Fed raised rates 3 weeks ago. Now we gain more information on the reasons for their decision. The market has had time to digest the rates and resulted in a substantial decrease for the month of May. We must now observe how the market reacts to their reasons for an increase in rates and the cost of money. Will the dollar continue it's momentum and we see a Eurusd decrease, or will Eurusd pivot bullish in the short term as it digests the Fed's reasoning's.
Bear Targets for the rest of May and the month of June are
- 1.06654 Weekly Zone
- 1.05426 Weekly Zone
Bull targets for the rest of May are
- a return to Daily level 1.08725
Bull targets for the month of June are
- a return to 1.1024 weekly level
- a push to 1.14655 Weekly level

The Quiet before the Storm 🪁 : Eurusd With the close of the Daily candle in the next 1.5 Hours, Longs would prefer a candle closure above 1.0782. This would confirm another Higher High in market structure. In an uptrend price creates Higher Highs and Higher Lows. If this occurs then we can anticipate a bottom wick ( Higher Low) and then a consequential new bullish candle push to the upside back towards 1.0813 daily resistance zone. At this current time price is Bullish on the weekly timeframe and has broken the previously week's candles high. The Daily timeframe will print the second bullish candle of the week which was expected in my previous analysis. FOMC tomorrow will cause quite the stir. FOMC could cause Eurusd to easily dip back to retest 1.0746 Daily support level before continuing it's ascent or going into a volatile range. Price has reached my bullish target for the week which was 1.0813 ( a 65 pip increase ). CPI data has resulted in Higher High on the 1Hr timeframe. Price ended up pulling back and correcting the increase made during London session. We currently sit above our Daily S/R level 1.0782, late NY session Tuesday.
New Bullish target for this week with fomc : 1.087 Daily resistance zone
The way CPI data distributed at 1.0813 makes me think. We reached my weekly target 1.0813 before schedule. We had an initial increase in price and I'm sure some players bought the high and are now holding drawdown as we move into FOMC tomorrow. If I was a buyer I would consider getting out for B.E. because the Daily candle is closing in 1.5 hours with a significant top wick. Larger than the body of the bullish candle at least.
New Bearish target for this week with fomc : 1.06915

Is the Worst OVER? This is the differential of 10yr vs 1yr US bond which represents long term against short term yield on sovereign debt, and those you don't know, short term bonds are used by central banks to control interest rates(amazing uh? the FED does not actually print money) therefore they do use bonds as a tool to control interest rates which then controls the S&D of capital.
As you can see, we are back at a differential which is extremely low, back to energy crisis levels. However, we seem to be already at very low levels, does that mean THE WORST HAS COME? What is going to happen to the stock market?
A very quick and personal thought to sum everything up as I do not consider myself an expert macroeconomist: the market is efficient, meaning that the current price on every single security is traded at all the current public information that is available and if something keeps going up, it means that expectation are in favor of it moving higher.
Hope that explains what I wanted to say,
Feel free to ask question, be safe!

US 10Y yield chart - key levels to watch ahead of dataWe have a big week of data
US inflation figures are released tomorrow and are likely to show a continued disinflationary trend, with the headline rate falling to 4.1%. This will help the Fed remain on pause for the Wednesday rate decision.
The major level to watch to our mind is the tentative downtrend drawn from the October 2022 high. This comes in at 3.88. The market has been sidelined for months but is building a potential bullish consolidation pattern and that idea will be reinforced should a close above the 3.88 downtrend be seen.

US30(Dow Jones) / D1 - Wait for a Correction!Dow Jones is near the famous top (34k). If it can not break the top it will fall and break the trend line in the first step.
Then probably a pullback to the broken trendline , then fall to 31k.
So if you are not in any position just be hold till its time.

An important week for EURUSDThe most important news coming up this week.
CPI data is due tomorrow.
We will se FED Interest rate decision on Wednesday.
On Thursday ECB is expected to rise interest rates again.
A proper money management and waiting for the right moment are extremely important when it comes to busy news week.
We’re currently looking at the options to reverse the H1 trend.

XAUUSD - KOG REPORT!KOG Report:
In last week’s KOG Report, we said we would be expecting to adapt our plan over the week as we were expecting the range and choppy price action to continue. We suggested sticking with the same plan and levels from the week prior which worked very well to give us the trades within the range. The short-term swing we were expecting for the move to the downside came in the later part of the week after we managed to take the long trade back up into range high giving us a short opportunity we wanted. So, we wanted to short down, then long up before shorting down, instead, we got the long up, short down and long up. A decent week on the markets again but a very frustrating range to have to deal with.
So, what can we expect in the week ahead?
For this week we can expect some more choppy and whipsawing price action during the first half due to FOMC being on Wednesday. We’re expecting them to want to clear the voids and grab liquidity from the highs and the lows, so for that reason we’re going to start by suggesting we continue to scalp the range for the first initial sessions while we assess the price action. We’re then going to be looking for the two key levels to hold price, either from above to go short, or, from below to go long.
Key levels are the order region 50-55 with the break below taking us into 30-35 previous order region which are levels we would expect to see a reaction in price. Resistance levels now stand at 80-85 key level and above the institutional level 90-95 which price needs to remain below for this to continue with another decline.
So, in summary, we have a potential range now forming between 40-45 support and the resistance levels of 80-85 with extension into 90-95 for the spike. Scalps in-between with KOG’s bias of the day and the levels with the view to take the longer position from the levels illustrated on the chart.
Its going to be another difficult and frustrating week to navigate so please exercise patience in your trading, wait for the price to come to your levels, don’t force the trades just to be in the market. Always remember, cash is also a position in the market. We’re going to take it easy until FOMC, smaller lots and smaller captures before we hunt for the trade of the week.
Please do support us by hitting the like button, leaving a comment, and giving us a follow. We’ve been doing this for a long time now providing traders with in-depth free analysis on Gold, so your likes and comments are very much appreciated.
As always, trade safe.
KOG

EURUSD Technical Analysis: Preparing for CPI and FOMC Impact.Hello Traders, In tomorrow's trading session, our focus will be on the EURUSD pair as we seek a selling opportunity around the 1.08 zone. Previously, EURUSD was experiencing an uptrend and successfully broke out of it. However, it is currently undergoing a correction phase and approaching the retrace area at the 1.08 resistance zone. It is important to also keep an eye on the CPI data scheduled for release next week, specifically on Tuesday. This data will serve as confirmation for the trade. If the CPI comes in above expectations, it suggests that the Federal Reserve still needs to work on increasing interest rates in their upcoming monetary policy by Wednesday, which could trigger further strength in the US dollar. On the other hand, if the CPI numbers are within expectations, this may lead to USD weakness as Federal Reserve Chair Powell may lean towards postponing a rate hike. Let's monitor the situation closely and trade wisely.
Trade safe, Joe.

Further Upside for the AUDUSDThe RBA surprised markets by hiking rates 25bps, taking interest rates in Australia to 4.1%.
This decision saw the AUDUSD rise steadily from the 0.66 price level up toward the 0.67 resistance level.
As the price maintains above the bullish ichimoku cloud and the 200MA signals further upside potential, look for the AUDUSD to break above the 0.67 resistance level to trade up toward the next resistance and round number level of 0.68.
This move higher would need to be supported by further weakness in the DXY (checkout DXY analysis in the link)

DXY Outlook (7th June 2023)The DXY had seen significant volatility, reversing strongly from the 104.70 price level, down to 103.40 (which coincides with the 38.2% Fibonacci retracement level). This is due to the recent speculation over further interest rate hikes to come from the Federal Reserve.
As the likelihood of further interest rate hikes eases, this is likely to bring about some lower volatility, but possible downside on the DXY.
Currently trading below the 104 level and with the 200 MA and the recent swing point of 104.36 providing near term resistance, the DXY is more likely to trade lower from this level.
If the price breaks below 103.85, the DXY is likely to trade down to 103.40, with the next key support level at the 50% Fibonacci retracement level, between the 102.80 and 103 price area.

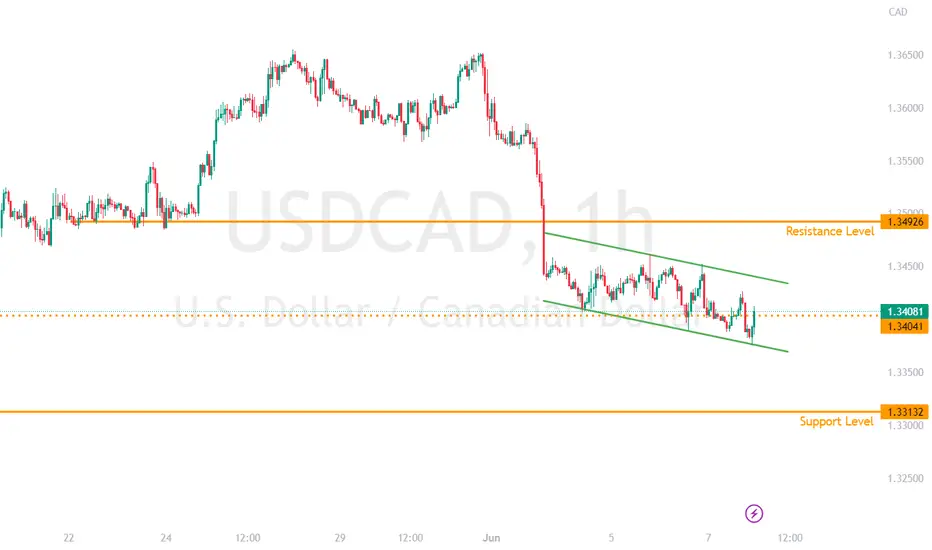
Bank of Canada Interest Rate DecisionThe USDCAD traded lower, since the start of June, reversing from the 1.3650 price level, now hovering along the 1.34 price level.
Over the last couple of days, the USDCAD had been in a narrow downward range.
The Bank of Canada (BoC) is due to announce its interest rate decision. With the current rates at 4.50%, there has been speculation that a surprise rate hike could be decided (similar to what happened with the RBA and the AUDUSD).
However, I think that the data might not support such a surprise, with the BoC likely to maintain its current interest rate level.
This is likely to cause the USDCAD to trade higher, from this current area of 1.34 toward the immediate resistance level of 1.35.
AUDUSD Weekly Forecast CashRate | 4th June 2023Fundamental Backdrop
RBA Gov Lowe mentioned "Very Much in Data-Dependent Mode on Interest Rates", "Monetary Policy in Restrictive Territory"
This means that the RBA is closely monitoring economic data and could potentially continue increasing interest rates
CPI y/y also increased from 6.3% to 6.8%, this shows inflation is still on a strong rise which can lead to an increase in interest rates.
Cash Rate on Tuesday expected to maintain at 3.85%
Technical Confluences
Near-term resistance level at 0.66196
Next resistance at 0.67860
Near-term support level at 0.65220
Idea
If the RBA chooses to maintain its cash rate at 3.85% on Tuesday, we could see the AUD drop towards the near-term support at 0.65220.
However, if the unexpected occurs and the RBA chooses to increase its interest rates, we could see the price rise above the near-term resistance level at 0.66196, before heading towards the next resistance at 0.67860.
NOT FINANCIAL ADVICE DISCLAIMER
The trading related ideas posted by OlympusLabs are for educational and informational purposes only and should not be considered as financial advice. Trading in financial markets involves a high degree of risk, and individuals should carefully consider their investment objectives, financial situation, and risk tolerance before making any trading decisions based on our ideas.
We are not a licensed financial advisor or professional, and the information we are providing is based on our personal experience and research. We make no guarantees or promises regarding the accuracy, completeness, or reliability of the information provided, and users should do their own research and analysis before making any trades.
Users should be aware that trading involves significant risk, and there is no guarantee of profit. Any trading strategy may result in losses, and individuals should be prepared to accept those risks.
OlympusLabs and its affiliates are not responsible for any losses or damages that may result from the use of our trading related ideas or the information provided on our platform. Users should seek the advice of a licensed financial advisor or professional if they have any doubts or concerns about their investment strategies.

Positive NFP Data for the USDNFP May 2023 - 339,000 jobs have been created.
While this sounds like a good thing, it’s also a bad thing. The entire point of the Federal Reserve hiking interest rates was to ‘slow down inflation’ by making people lose their jobs, in turn leaving them with less disposable income to flood back into the economy.
What this NFP data shows is that the current interest rate hikes aren’t working, so this will now be another excuse for the Federal Reserve (really the US government) to be more aggressive with rate hikes, which will end up destroying the economy. This’ll create higher unemployment rates, higher mortgage rates (people default & lose their homes) & higher poverty. This’ll have a knock on effect on the global economy such as the U.K.
World Economic Forum - “You Will Own Nothing & Be Happy”

Weak Euro - War between central banks!FOREXCOM:EURUSD is under sell pressure. Germany is officially in recession. Inflation numbers came short in both Spain and Germany. These are signs for interest rates in eurozone is slowing down the economy and at some point ECB needs to stop increasing interest rates, which would make euro weaker. In contrast to this, job openings and GDP numbers came positive for the US economy. This is increasing the hand of FED for further rate hikes. All these fundamentals are pushing FOREXCOM:EURUSD lower.
TA shows that the price is following the down channel. The channel support and pivotal point supports (both monthly and quarterly) are around 1.05-1.053 zone. We will watch if that area holds or not for a long opportunity.
Disclaimer – WhaleGambit. Please be reminded – you alone are responsible for your trading – both gains and losses. There is a very high degree of risk involved in trading. The technical analysis , like all indicators, strategies, columns, articles and other features accessible on/though this site is for informational purposes only and should not be construed as investment advice by you. Your use of the technical analysis , as would also your use of all mentioned indicators, strategies, columns, articles and all other features, is entirely at your own risk and it is your sole responsibility to evaluate the accuracy, completeness and usefulness (including suitability) of the information. You should assess the risk of any trade with your financial adviser and make your own independent decision(s) regarding any tradable products which may be the subject matter of the technical analysis or any of the said indicators, strategies, columns, articles and all other features.

AUDUSD SELL | CPI, RBA Gov Lowe speaks | 31st May 2023Fundamental Backdrop
RBA Gov Lowe spoke today
He mentioned "Very Much in Data-Dependent Mode on Interest Rates", "
"Monetary Policy in Restrictive Territory"
This means that the RBA is closely monitoring economic data and could potentially continue increasing interest rates
CPI y/y also increased from 6.3% to 6.8%, this shows inflation is still on a strong rise which can lead to the increase in interest rates.
Technical Confluences
Near-term resistance level at 0.65100
Near-term support level at 0.64150
Idea
Today's speech by RBA Gov Lowe indicates towards raising more interest rates in the future.
Based on previous data whenever the RBA raises interest rates, the AUD rises a few days before it drops.
We could see the AUD head towards the next support level at 0.64150 if interest rates are raised on 6th June.
NOT FINANCIAL ADVICE DISCLAIMER
The trading related ideas posted by OlympusLabs are for educational and informational purposes only and should not be considered as financial advice. Trading in financial markets involves a high degree of risk, and individuals should carefully consider their investment objectives, financial situation, and risk tolerance before making any trading decisions based on our ideas.
We are not a licensed financial advisor or professional, and the information we are providing is based on our personal experience and research. We make no guarantees or promises regarding the accuracy, completeness, or reliability of the information provided, and users should do their own research and analysis before making any trades.
Users should be aware that trading involves significant risk, and there is no guarantee of profit. Any trading strategy may result in losses, and individuals should be prepared to accept those risks.
OlympusLabs and its affiliates are not responsible for any losses or damages that may result from the use of our trading related ideas or the information provided on our platform. Users should seek the advice of a licensed financial advisor or professional if they have any doubts or concerns about their investment strategies.

The Overnight Reverse Repo Facility Looks to be Breaking DownMoney that is being parked at the Feds Reverse Repo Facility due to attractively high interest rates the fed has set for money parked at the facility has been on a steady decline since late 2022 and we have now confirmed a lower high and are looking to break down below a Bearish Dragon trend line that could be the initial trigger that gets it started to going down all the way to an 88.6% retrace or lower even. One can only speculate that the money exiting this facility will lead to more trading of short term debt on the open market, which could eventually lead to yields coming down overall and for all of this excess liquidity to chase Equities instead as the value of the US Dollar declines due to the shock of all this newly added supply of liquid cash to the open market thereby causing a loosening of market conditions.

Does "News" Impact Price Behavior? 🐒We can Observe that After the 1st Quarter of the Year, January-March the price of Eurusd has increased. Now As we near the middle of the second quarter, I can't help but visualize a Breakout.
Price is currently sitting at 1.102. So far price has respected the Weekly Level at 1.106. The High for the first quarter was 1.103. We have now spent quite a bit of time at these extreme prices. I can often observe price using News//Data Releases on Lower time frames as a boost. A Boost of momentum in the preceding direction.
I can observe 3 Potential News//Data Releases causing and becoming a Catalyst to leave a Large Trading Range.
1. NFP
2. CPI
3. FOMC Interest Rates.
Will FOMC provide the Volume?
Do we have enough Liquidity?
Or may price dip from here back to our 1.086 Weekly S/R Zone before increasing any further?
My Bias is Bullish moving into FOMC. Safe Trading Everyone.
Not Financial Advice. Educational Purposes Only.

How New Zealand's central bank have given up the fight... It's the 24th May 2023, 3pm local time. The Reserve Bank of New Zealand (RBNZ) have just increased the official interest rate by 0.25% to 5.50%, as expected. What happened next was not expected... The RBNZ announced that they currently have no intention of raising rates further and that the next rate change could possibly be a cut!
What does this mean for New Zealand and the NZD?
Central banks across the globe have been increasing rates over the last 12 months to tackle high inflation. In some countries, like the US, inflation has been coming down and is currently edging toward a 2% norm. For other countries, inflation has been much more stubborn. New Zealand is one of these countries with "sticky" inflation, which is currently sitting just below 7% and hasn't really budged over the last year.
The RBNZ's main weapon to fight inflation is to raise interest rates. Until now, the markets have expected the RBNZ, along with other central banks, to keep raising rates in order to bring inflation down. New Zealand's central bank has announced they are no longer going to do this. So, what does this mean?
Well, it means that high inflation could be a new norm for New Zealanders. The central bank is giving up the fight. High inflation has won. Inflation is here to stay!
This is obviously not good news for the NZD, hence today's strong NZD sell off.
High inflation combined with no more rate hikes, and poor PMI figures, may result in the NZD to continue to weaken longer-time.
Could the NZD continue to sell off?
The outlook doesn't look great for New Zealand, but this is not Brexit or a financial crisis. There are economic figures indicating good economic health for New Zealand, such as strong - relative to other global economies - GDP growth and low unemployment.
The announcement of no more rate hikes could be a bearish driving force for the NZD, though.
What does this mean for the rest of the world?
The Australian Dollar (AUD) is strongly correlated to the NZD, meaning we could see the AUD fall also, which has already started. It wouldn't be a great shock, to see the Reserve Bank of Australia take a similar stance to their neighbours, which could see the AUD fall further.
What could really shift the markets is if the RBNZ have set the tone for the rest of the Western world. Now that the RBNZ have given up, could other central banks do the same? This may result in downside moves for the Euro, British Pound, Rand, and other global currencies.
How to trade the RBNZ's decision...
The US continues to lead the way for the Western world with regarding to bringing inflation to a 2% norm. Canada is following a similar trend. Singapore is not too far off. Economies such as the Euro Area, the UK, Scandinavia, and South Africa continue to face an issue of stubbornly high inflation. These countries could take a similar approach to the RBNZ but it's way too early to tell. At the moment, rate hikes continue to be on the table for the foreseeable future.
For me, the inflation trades seem obvious, buy the US Dollar and sell the NZD and AUD. If other central banks follow suit to the RBNZ decision, then selling the currencies related to those central banks is an obvious trade, especially the EUR, GBP, ZAR and SEK.

10Y Yield Heading to 5.0% & 6.5%?Check out the AI patterns and my trend lines and see what you think... we've definitely broken the long-term down trend which everyone said would collapse.. pretty much everything, lol.

💵THE WORLD IN DEBT💵
☑️The fact that the whole world is in massive Debt that can not be repaid is a buzzphrase that was around for like 20 years already.
20 years passed and nothing bad has happened, so what to worry about? In fact an entire political and economic movement called MMT or a modern monetary theory emerged claiming that government debt does not matter and that we can, you guessed it, print as much as we need(kinda)
☑️But the size of the debt itself was never really and issue so long as the government or a big company could service the debts.
That is if their cashflow was positive enough to cover the interest payments on the debt. Now however, as the FED is raising rates, this is an issue.
☑️And its not the USA who’s pile of debt we need to be worried about(they are borrowing in the currency they can print themselves, remember?) but rather the rest of the world and the companies. The majority of developing countries don’t have the internal capital required for development, so they need to borrow on the international financial markets in Dollars. And these counties are now facing a perfect storm of a higher cost of new borrowings in Dollars, lower revenues from foreign trade due to recession(and yes we are in a recession, Wake up) and the massive energy and food costs due to the war in Ukraine and the problems caused by the supply chain crisis.
☑️Most big public companies aren’t doing great either. The share of listed companies with the debt servicing costs higher than the profits is now more than 25% and if we exclude the accounting and financial engineering shenanigans, it is save to say that this share is close to 30%.
☑️So the third of the economy is outright insolvent. Multiple countries will either default soon or will at least be plunge into civil and economic unrest and go the way of Sri-Lanka, Pakistan and others… And Jerome Powell said that he aint stopping and that the Fed funds rate should go up by at least 2 percentage points more. So instead of the collapse of the USA, we are likely to see a chain reaction debt crisis In the rest of the world unless the FED changes its mind…
I Hope you guys learned something new today✅
Wish you all Best Of Luck👍
😇And may the odds be always in your favor😇
Dear followers, let me know, what topic interests you for new educational posts?
explanation

$US10Y Bull Flag on the weekly TVC:US10Y Bull Flag on the weekly chart, its bullish until it fails. Interest rates going higher will be a problem for stocks like NASDAQ:AAPL NASDAQ:GOOGL NASDAQ:MSFT NASDAQ:META
