Interestrates

Oil prices caught in dollar's game, ahead of NFPOil prices are like a game of poker right now, with players trying to figure out what everyone else is holding. There's the China reopening story, OPEC's card tricks, SPR releases and refills, and the dollar's royal flush. It's a high stakes game, but the pot is huge!
Traders are watching NFP and CPI data like hawks, looking for any tells that might indicate which way oil prices are headed. Powell's hawkish comments have only upped the ante, with the markets going all in on a 50-point rate hike. Will they be able to bluff their way to a win?
For now, oil prices are stuck in a tight range of 73.00 to 82.50, like a hand with no pairs or straights. But there's still hope for a lucky break! You could try raising the stakes by buying a bounce off of the 73.00 level or buying a break of the 82.50 level. If you're feeling lucky, why not both? A break above 82.50 could mean a jackpot, while a break below 73.00 could signal a bust.
So grab your lucky rabbit's foot and get ready to play the oil price game! Keep your eyes peeled for any new cards on the table and you just might hit the jackpot.

NFP week and -0.10% Japan interest rate thoughtsJapan interest rate is at -0.1% vs UK interest rate 4%
Where will large funds being swinging to, for better yields?
Is there a possibility that an investor from Japan borrows money from local bank at very low interest rates, invest it in foreign asset classes for profiteering purposes?
What will happen to the desirability of Japanese Yen vs other G7 currencies with higher interest rates e.g. Europe, USA, Canada, Switzerland, Australia & New Zealand?
Technical wise, beautiful consolidation taking place above H1 Imbalance, slowly creating bullish structure. Guess what will likely transpire this/next week?
Having said that, several US high impact news this week and NFP Friday. Its going to get rough and wild.
By Sifu Steve @ XeroAcademy

AUDUSD RBA Decision 7th March 2023The AUDUSD remains "trapped" between the support (0.67) and resistance (0.6780) in the lead up to the Reserve Bank of Australia (RBA) interest rate decision at 11:30am GMT+8
The current expectation is for a 25bps rate hike, to take the interest rates in Australia from 3.35% to 3.60%. Generally, since August 2022, every interest rate hike from the RBA had seen the AUDUSD trade lower. This trend was broken with the most recent decision in February.
Currently trading at the 0.6746 price level, if the RBA does hike rates by 25bps AND signals that further rate hikes can be expected, the AUDUSD could trade up to the 0.6780 resistance level.
However, at the resistance level, if the price fails to break higher, the AUDUSD could reverse back down and continue to be trapped within the range.

Interest Rates are Moving Again - Breaking Above Recent High2 year, 5 year, 10 year and 30 year yield are all showing a similar characteristic:
· Low established in 2020
· Major support trend started forming since then
· Seem to have completed its retracement with a double-bottom
· Resuming on its major support trend
· Target to break above its recent all-time high set on Oct 22
Chart illustrated a 10 year yield futures market.
Interest rates and yield moves in tandem, why?
Borrowers (for eg. home owners with loan) take reference from interest rates and lenders (or investors) take reference on the yield. Interest rates and yield moves in tandem.
Meaning if yields are indicating an upward momentum driven by mainly the investors, interest rates will soon to follow or vice-versa.
Though interest rates are making a U-turn from its recent low and breaking above its all-time high.
Are you seeing opportunity or feeling stress with more volatility ahead?
My strategy:
• Have lesser long-term hold on stocks
• Trading into the indices - Sell into strength and trading into the volatility
• Investing into commodities related asset
• Buying into dip(s) on yield futures
CME Micro Years Yield Futures
Minimum fluctuation
0.001 Index points (1/10th basis point per annum) = $1.00
Disclaimer:
• What presented here is not a recommendation, please consult your licensed broker.
• Our mission is to create lateral thinking skills for every investor and trader, knowing when to take a calculated risk with market uncertainty and a bolder risk when opportunity arises.
CME Real-time Market Data help identify trading set-ups in real-time and express my market views. If you have futures in your trading portfolio, you can check out on CME Group data plans available that suit your trading needs www.tradingview.com

AUDUSD Outlook 6th March 2023The AUDUSD traded with significantly choppy price action toward the end of last week. The price generally fluctuated along the 0.6750 price level before trading slightly higher, toward the resistance level of 0.6780, due to the weakness of the DXY.
Although the AUDUSD has been trapped within the price range of 0.67 and 0.6780 in the short term, the current DXY weakness could see the AUDUSD trade slightly higher. However, look toward how the price action develops for a potential setup, with the RBA interest rate decision due tomorrow.
Based on previous backtesting, the AUDUSD tends to trade lower following the RBA interest rate decision.
Therefore, if by the news release tomorrow, the AUDUSD continues to trade below the 0.6780 resistance level, this could be a good setup for a retest of the 0.67 price level again.

Interest rates - Bond yields... Are they really going higher?Recently the market's expectation for the Fed Funds Rate peaking around 5% and then coming down at the end of Q4 2023 changed, with the market now seeing rates going to 5.5%. Many investors/analysts are discussing bond yields heading to 6% and staying higher for longer. However, is that going to happen? What is sentiment telling us right now? What is data indicating? If rates keep going up, what does this mean for other risk assets?
Sentiment right now seems to be quite bullish on yields (bearish on bonds). We are probably near a short-term top for bond yields, and I think this Fed hike may be the last one. The reason is that in Q3-Q4, we started seeing an actual economic deceleration, and inflation dropped significantly. In January, we had some weird data that might have to do with seasonality and adjustments on how inflation is calculated. The critical thing to note here is that rising interest rates act with long and variable lags and that the drop in inflation since July 2022 was caused by factors irrelevant to interest rate hikes.
So let's take things from the beginning... Since Covid hit, we have seen tectonic shifts in markets. Many things changed in the global economy, which was already in bad shape. It's unlikely that inflation will be contained for a long time, given that we are at the end of the debt cycle, the end of globalization, we are in a war cycle, we are at war against the climate, and the labor market is changing rapidly. Therefore, bonds will likely substantially underperform inflation in the next decade. In 2020 and 2021, fiscal policy was heavily used over monetary policy, and we still feel the effects of those policies and the aftereffects of Covid.
US monetary policy started shifting in March 2022, when the Fed began hiking rates and Quantitative tightening in July. Hence the changes in monetary policy couldn't have affected markets, as it takes more than 12 months for changes like this to have any effect. Of course, we also had the Russian invasion, which caused a commodity spike, and we had Europe and the US spending a lot on Ukraine and war equipment broadly. Then the relationship between US and China started worsening, while China was under lockdown and only started reopening in December - January.
The global economy is in terrible shape and will get into a steep recession eventually. Some data make it look strong at times, but it isn't. I think the Fed is looking and acting in the worst possible way, and it's trapped. At the moment, markets are afloat mainly because of human ingenuity, past fiscal and monetary stimulus, and the actions of Central banks like the BoJ, HKMA, and PBoC, as well as the BoE and ECB having some form of QE going on, while the Fed & US treasury is increasing market liquidity by draining the TGA, creating T-bills and bank reserves. It's unclear what will happen when all the interest rate hikes start affecting the economy, but Central banks and Governments will resume supporting markets and the economy. There are several tricks they can implement before they start cutting rates or continuing QE, or doing Yield Curve Control, but ultimately they will get to that point.
Now finally, let's get to the charts!
TLT / UB look like they are bottoming here. Swept the lows but closed slightly above them. Double top and significant gaps are higher, so that's where I think it's headed. I don't want to say that we will go massively lower, but for now, I treat this as a range, and I don't want to let my view that inflation will come down affect me. My target is the range highs and nothing more.
SHY looks like it capitulated and filled a double gap (partially) to the downside. That double gap occurred near the bottom, but now we have a massive double gap open to the upside, telling me it could go higher. Both that and TLT tell me yields down (bonds up)!
Short-term yields have been increasing, with US 2y getting near 5%. Maybe that's the psychological level everyone thinks will break easily, but it doesn't. The majority is eyeing 6%. Perhaps we do a slight break above 5% on the 2y, then fall quickly below it. The average bond yield (random average) is at 4.5%, it also made a new high, but this could be a trap. I am not seeing much strength here. The 10y, which I used as the base chart for today, reaches a critical level where the major correction to the downside began and has found some resistance there.
Finally, I wanted to discuss a few currencies and some overall observations. EURUSD and GBP are at support but looking weak. I can see how they could have one last dip and then higher, but I don't want to see them go much lower from here.
USDJPY and USDCNH are trading higher, with USDJPY being 10% lower from where it peaked. The interest rate differential was the same as now or lower, so something is happening here. Maybe rates are peaking? Maybe the interventions from CBs and Govs are working? Stocks are also much higher than back then, and they don't look like they will go down. Both pairs seem to be back in an uptrend which seems close to peaking. Based on how their charts look, I don't think the USD will keep strengthening, which is telling me that something big has shifted in markets, which is bullish risk assets, and potentially bearish on bonds yields.

Interest rates are moving againWhat is moving this week? Our weekly eyeball into the different markets.
Interest rates likely to be breaking its all time high again, get ready for another volatile month ahead.
Difference between yield and interest rate:
Borrowers take reference from interest rates and lenders take reference on the yield. Interest rates and yield moves in tandem.
Minimum price fluctuation:
0.001 Index points (1/10th basis point per annum) = $1.00
Disclaimer:
• What presented here is not a recommendation, please consult your licensed broker.
• Our mission is to create lateral thinking skills for every investor and trader, knowing when to take a calculated risk with market uncertainty and a bolder risk when opportunity arises.
CME Real-time Market Data help identify trading set-ups in real-time and express my market views. If you have futures in your trading portfolio, you can check out on CME Group data plans available that suit your trading needs www.tradingview.com

AUDUSD Outlook 1st March 2023Overnight, the AUDUSD fluctuated between the 0.67 and 0.6760 price range as the DXY retraced lower but recovered in strength toward the end of the trading session.
Early this morning, the AUD CPI was released at 7.4% (Forecast: 8.1% Previous: 8.4%) which was significantly lower than expected. This signals that the ongoing interest rate hikes from the RBA are taking effect in lowering inflation in Australia.
However, a cost of the significant rate increases is the slowdown in the economy as the Australian GDP slid to 0.5% (Forecast: 0.8% Previous: 0.7%).
The AUDUSD traded lower to test the 0.67 support level but rebound strongly to the upside, testing the bearish trendline.
If the price breaks above the trendline, the AUDUSD could see further moves higher toward the near-term resistance area of 0.6780 before continuing with the downtrend, retesting the 0.67 round number support level and breaking below that. Beyond 0.67, the next key support level is 0.6630.

GOLD| DECRYPTERS | XAUUSD | SHORTWelcome to Team Decrypters
We think GOLD can go more down side base on BPS AND DXY
High Chances of it Because of 15th march interest Rate 50 BPS , A bounce from support little bit and than Drop to ASHES

However you slice it, real estate doesn’t look good.While it might not be the subprime/GFC “SELL” kind of situation, the real estate sector is undoubtedly facing headwinds.
With the most recent Fed’s preferred inflation measure, the Personal Consumption Expenditure (PCE) printing higher than consensus, maybe it’s about time we take the Fed’s hawkish commentary more seriously. To review, let us look at interest rate expectations from a month ago vs today. Market expectations are now pricing in three 25bps hikes instead of one, and more importantly no more rate cuts in the second half of 2023. This rise in rates expectation has notably resulted in sideways action for equities, while the dollar strengthens. What a difference a month makes!
Mostly importantly, it’s not hard to see how higher rates will translate into higher mortgage rates. This is bad news for home buyers as borrowing becomes more and more unaffordable. In fact, higher mortgage rates have continued to weigh on the minds of Fed officials as underscored by the following statements in the latest Fed minutes, including “Participants agreed that activity in the housing market had continued to weaken, largely reflecting the increase in mortgage rates over the past year.” and “Participants agreed that cumulative policy firming to date had reduced demand in the most interest-rate-sensitive sectors of the economy, particularly housing.”
Existing home sales are now at a 12-year low, surpassing the 2020 lows. Only 2 other periods post-GFC, saw a lower print, and it’s worth noting that mortgage rates during those periods were at the same level or lower.
Home prices have also started to turn over, ending a 12-year run higher. Lower prices could indicate tepid demand in the housing market, which we will watch closely over the next few prints.
And forward-looking indicators all seem to point towards contraction. With US Building permits and NAHB Housing Market Index slightly off the covid low, while the MBA Purchase Index close to the 7-year low.
It does seem like however, we slice it, real estate looks pretty ugly now. One way to express the bearish view on real estate could be to use the CME E-Mini Real Estate Select Sector Futures which tracks the S&P Real Estate Select Sector Index. Looking at the sector futures alongside the 30-year Mortgage rates shows us the effect of the rising rates on the real estate sector.
On the technical front, we see the sector future breaking the short-term support established since October 2022, while the longer-term trend seems to point downwards.
Given our view that rates have further to go, negative home prices and sentiment measures across the board, and a technical break lower, we see the potential for the sector future to trade lower. We set our stops at 196, a previous resistance level, and the take-profit level at 163, with each 0.05 increment in the index equal to 12.5 USD.
The charts above were generated using CME’s Real-Time data available on TradingView. Inspirante Trading Solutions is subscribed to both TradingView Premium and CME Real-time Market Data which allows us to identify trading set-ups in real-time and express our market opinions. If you have futures in your trading portfolio, you can check out on CME Group data plans available that suit your trading needs www.tradingview.com
Disclaimer:
The contents in this Idea are intended for information purpose only and do not constitute investment recommendation or advice. Nor are they used to promote any specific products or services. They serve as an integral part of a case study to demonstrate fundamental concepts in risk management under given market scenarios. A full version of the disclaimer is available in our profile description.
Reference:
www.cmegroup.com
www.federalreserve.gov

DXY Outlook 27th Feb 2023On Friday, the US Core PCE price index was released at 0.6% (Forecast: 0.4%). As the Core PCE price index is a key inflation indicator for the Federal Reserve, a stronger-than-expected change signals that we could see further interest rate increases from the FOMC.
This is also why following the news release, the DXY climbed steadily from the 104.65 price level up toward the 105.30 price area.
Currently consolidating above the 105 price level, look for the price to retrace briefly (possibly toward the 104.80 level (supported by the horizontal level and the upward trendline) before resuming to trade higher again, toward the next key resistance level of 105.80.

SPY Prediction for 2023Inflation is looking stickier than the FED hoped, further hiking is likely required. At this point I'm comparing to the last two financial downturns.
I'm not expecting a market bottom until rates have been cut greatly. Maybe between September 2023 and March 2024. In previous downturns bottoms did not occur until fed funds rate had already been cut greatly. Targeting a monthly RSI of 30 to begin buying in large.

Rates Obsession - a pro interest rates set-up on TradingView Interest rate pricing has a huge effect across many financial markets at present – the correlation between short-term rates, rates volatility and the USD is certainly evident.
However, with such a big window for increased volatility in interest rates pricing, as traders try and price the prospect of a 25bp or 50bp hike at the 22 March FOMC, as well as peak fed funds pricing, could increased pricing result in a big move in the USD and NAS100?
In the video, we look at how we can look at the fed funds curve and understand ‘what is priced in’ – we look at how to measure the degree of cuts priced in for a specific period of time, and how to look at implied volatility in bond markets – and, why it is important for FX and index traders?
Interest rates and short-term US Treasury bonds are the first derivative and so many markets take their direction from these inputs - hopefully, this gives some understanding of how you can use TradingView more effectively to assess these inputs.

EURUSD bagged and taggedAs mentioned before, so long as DXY has not reach the finishing line, which is the higher time frame upside objective,
Risk Off will still be in play.
Same narrative, different pair.
What happens when DXY finally gets to the upside objective? We sit sideline and study what it wants to do next.
There are only 3 possible direction of the market, Bullish / Bearish / Consolidation.
Usually, in my opinion, after a prolonged rally / decline, price will tend to consolidate for a bit.
After consolidation comes expansion. The question is, expansion to the upside or downside?
Now, this short-term bullishness of USD as I previously stated, could be Bear Market Rally for USD.
Mr Powell will likely hike rates again in the next Federal Fund Rate announcement.
In theory, higher interest rate means bullish for currency.
But look at US domestic debt condition. Will that spook investors?
Housing and Banking looks about to get crushed.
US Credit Card debt climbs nearly US$1 Trillion
*source: Insider Intelligent*
Household debt hits record US$16.9 Trillion
*source: CNN Business*
Housing Market Downturn Wipes $2.3 Trillion In Value As Experts Predict Prices Could Still Tumble Another 10%
*source: Forbes*
US Home-Purchase Applications Drop to 28-Year Low
*source: Bloomberg*

AW 10Y Bond Yields - The Large Pullback Ahead Means Recession...In this video I talk about the bigger picture going back to 1150AD and how I have always anticipated this move up in rates.
See down below all videos that are related to this idea.
We are in a correction phase of Wave 2 in Bond Yields.
This type of expansion means that they are preparing themselves for a recession even though they don't mention it.
They know.
The FED must always keep the public distracted with the inflation narrative.
The truth is that they have to keep the party going therefore they will use manipulated data to justify their actions.
This is all done through compartmentalization which is used by governments and the military industrial complex.
This is also done to the public to make sure you are happy even though you are losing everything.
Sound familiar? The truth is they have been slowly preparing you for the future.
Don't think that it's coming because it's been here the whole time.
#BoilingFrog.
Remember to use Disciplined Money Management Principles to ensure longevity as a trader.
If you don't know the long term pattern shouldn't you be doing your research instead of just following the crowd?
Just remember: I am not a financial adviser; I suggest using this only as a guide. Always do your own research.
***AriasWave is not the same as Elliott Wave so your counts may differ to mine if you happen to use it.***

Prudential (PRU.l) bearish scenario:The technical figure Channel Up can be found in the daily chart in the UK company Prudential plc (PRU.l). Prudential plc is a British multinational insurance company. It was founded in London in May 1848 to provide loans to professional and working people. The Channel UP broke through the support line on 22/02/2023. If the price holds below this level, you can have a possible bearish price movement with a forecast for the next 25 days towards 1 173.20 GBX. According to experts, your stop-loss order should be placed at 1 336.00 GBX if you decide to enter this position.
Prudential's stock increased significantly by 41% over the past three months. But the company's key financial indicators appear to be differing across the board and that makes us question whether or not the company's current share price momentum can be maintained.
While the company does have a high rate of reinvestment, the low ROE means that all that reinvestment is not reaping any benefit to its investors, and moreover, its having a negative impact on the earnings growth.
Prudential's earnings have declined over five years, contributing to shareholders 21% loss.
Risk Disclosure: Trading Foreign Exchange (Forex) and Contracts of Difference (CFD's) carries a high level of risk. By registering and signing up, any client affirms their understanding of their own personal accountability for all transactions performed within their account and recognizes the risks associated with trading on such markets and on such sites. Furthermore, one understands that the company carries zero influence over transactions, markets, and trading signals, therefore, cannot be held liable nor guarantee any profits or losses.

Upside pressure for UK yields remains apparentRemember upside pressure for UK 10Y yield implies downside pressure still for UK gilts......
Disclaimer:
The information posted on Trading View is for informative purposes and is not intended to constitute advice in any form, including but not limited to investment, accounting, tax, legal or regulatory advice. The information therefore has no regard to the specific investment objectives, financial situation or particular needs of any specific recipient. Opinions expressed are our current opinions as of the date appearing on Trading View only. All illustrations, forecasts or hypothetical data are for illustrative purposes only. The Society of Technical Analysts Ltd does not make representation that the information provided is appropriate for use in all jurisdictions or by all Investors or other potential Investors. Parties are therefore responsible for compliance with applicable local laws and regulations. The Society of Technical Analysts will not be held liable for any loss or damage resulting directly or indirectly from the use of any information on this site.

german bund interest rates descending triangle descending triangle broke; 134,50 support likely will be broken soon, just sell call options on 137 and get premiums easy peasy, friday 24 Feb winds up the standard contract so do like #blackrock

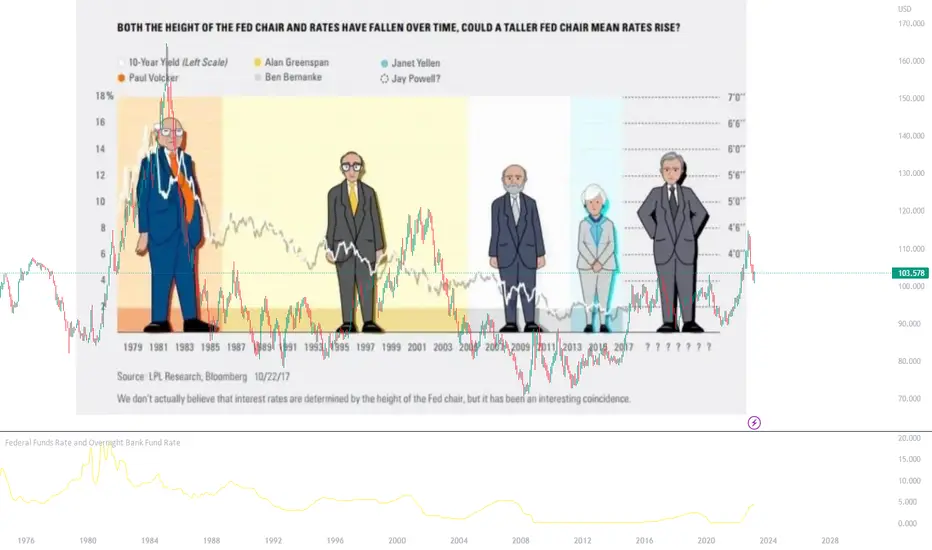
On the lighter side of thingsThe questions in recent times...
- Is the federal reserve going to slow down on future rate increases?
- Could we see a cut in rates in 2023?
- With terminal rates still undecided, could it be revised higher?
Perhaps the height of the Central Banker of the US Federal Reserve could be a leading indicator of interest rate decisions! (I'm not being serious, but it was interesting to see the correlations)
I started trading FX when Chair Bernanke (5ft 8in) was in the prime position and oversaw a steady decline in interest rates (ignoring the fact that the Global Financial Crisis caused significant turmoil in the markets)
The current Chair, Jerome Powell stands at 5ft 10in, an increase from Chair Yellen at 5ft 3in. A change in the Central Banker height trend has led to US interest rates climbing higher from 0% to the current of 4.75%!!
Chair Greenspan (5ft 8in), was THE first central banker I've read about and probably what got me interested in the financial markets, ushered in a strong US economy in the 90s. Greenspan oversaw rate hikes as he too battled with "high" inflation in 1997.
So, perhaps instead of overthinking about employment, CPI, GDP, QE, and YCC, all we have to do is pay attention to the change in the height of the Federal Reserve Chairperson.
What do you think?
10Y Yield Looks Bullish - Higher RatesI don't know how high this thing goes, but right now it looks like it is heading higher.

AUDUSD Retest, Possible Bearish trend.AUDUSD a possible down trend due to possible Federal Reserve increase interest rates.

Reduce inflation rate from 6.5% to 3% this years, says WilliamsFOMC's Williams speech did not do much, as he was echoing what Jerome Powell already said 2 days ago. Rate hikes to resume, but at slower pace. Williams mentioned that inflation rate in the US should cool off to 3% this year, now at 6.5%. That's 50% lower.
Question is, how much more rate hike is required to push inflation down by 50%? Will that be somehow somewhat slowdown the US economy as a whole? A whole lot more tightening will need to take place, as I see it. Lending has already begun to tighten and credit is more difficult to obtain due to stricter requirements by banks.
Hmm... how will this play out?
By Sifu Steve @ XeroAcademy
#usdollar #usd #dxy #interestrates #useconomy #federalreserve #FOMC #inflation
