Review and Intraday set up for 5th August 2025Nifty future and banknifty future analysis and intraday plan.
Quarterly results.
This video is for information/education purpose only. you are 100% responsible for any actions you take by reading/viewing this post.
please consult your financial advisor before taking any action.
----Vinaykumar hiremath, CMT
Intraday

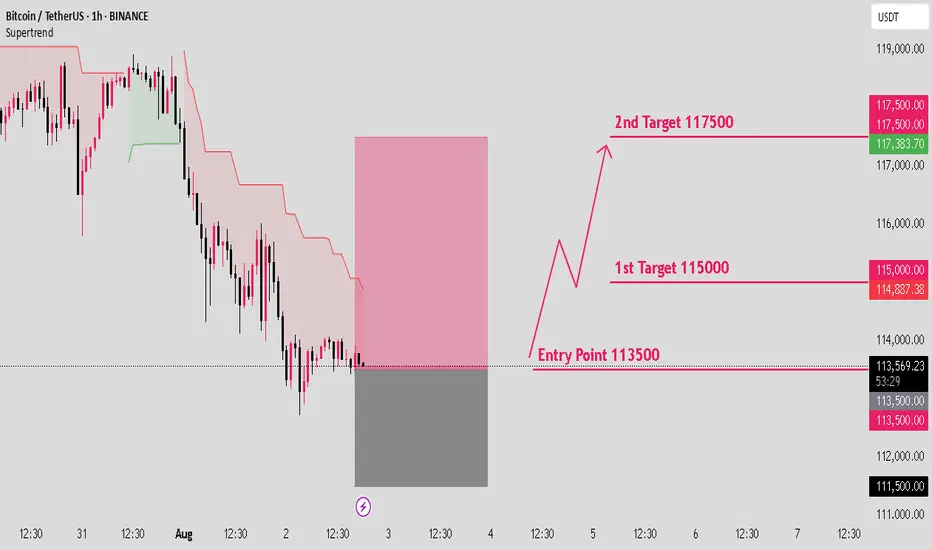
BTCUSD long setup: Targeting the next bull move.Hello IGT FOLLOWERS
Here is my BTCUSD overview, Bitcoin is showing bullish momentum after holding strong support near $112,000. A breakout above the $115000 resistance suggests buyers are regaining control. RSI is turning upward, and volume is increasing on green candles signaling demand. As long as price holds above $113,000, bulls may push toward the $117,500 target.
Key points :
Entry point : 113500
1st Target : 115000
2nd Target : 117500
Follow me for more latest updates and signals
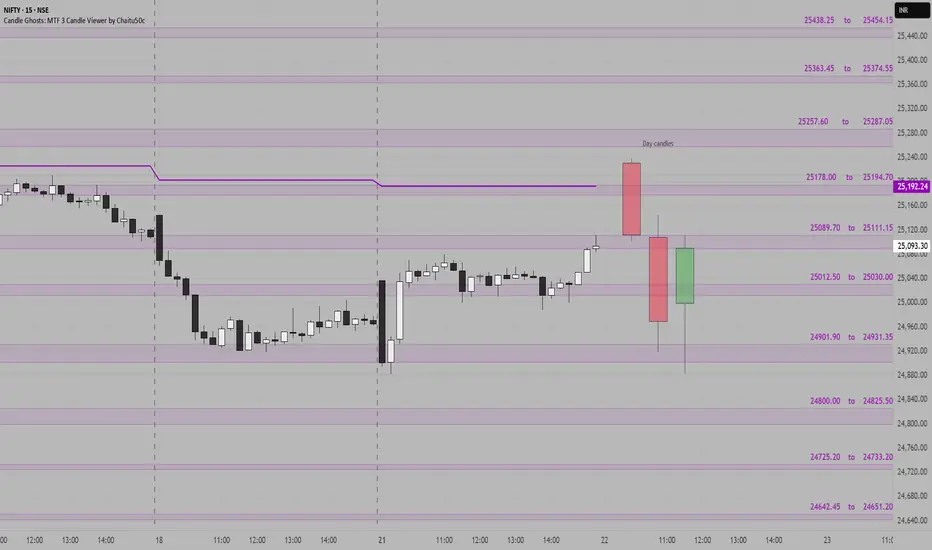
NIFTY SUPPORT & RESISTANCE ZONES FOR 22-07-2025Nifty Support & Resistance Zones for Tomorrow 22-07-2025
Based on price cluster analysis and recent market structure, the following key support and resistance levels have been identified for the upcoming session:
Resistance Zones:
25438.25 – 25454.15
25363.45 – 25374.55
25257.60 – 25287.05
25178.00 – 25194.70
25089.70 – 25111.15
Support Zones:
25012.50 – 25030.00
24901.90 – 24931.35
24800.00 – 24825.50
24725.20 – 24733.20
24642.45 – 24651.20
These levels are derived from high-probability zones where price has shown repeated interaction in the recent past. Watch how Nifty reacts at these zones for potential breakout, reversal, or pullback setups.
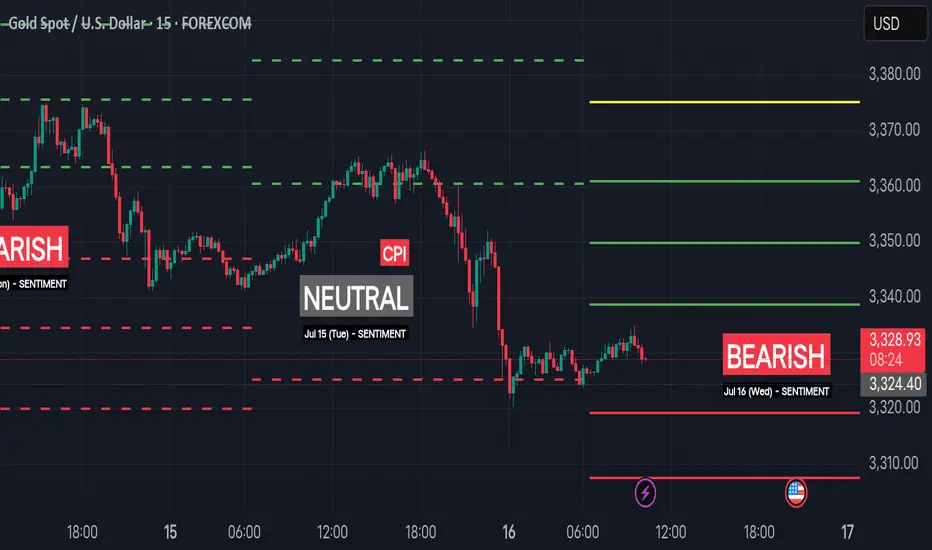
Bearish Sentiment (Jul 16 Wed) | Intraday S/R for Swing TradingSentiment: Bearish
🟢 Support Levels
1. 3319.20 – Minor support near Friday’s bounce zone
2. 3307.60 – Key support from early U.S. session rejection zone
3. 3296.10 – Institutional support / demand buildup
4. Extreme Support: 3283.40 – Break below this opens extended sell-off zone
🔴 Resistance Levels
1. 3338.70 – Minor resistance from overnight price action
2. 3349.80 – Key resistance aligned with previous close and seller defense
3. 3361.00 – Strong intraday ceiling, potential short trigger
4. Extreme Resistance: 3375.20 – Break above this signals risk-on bullish momentum
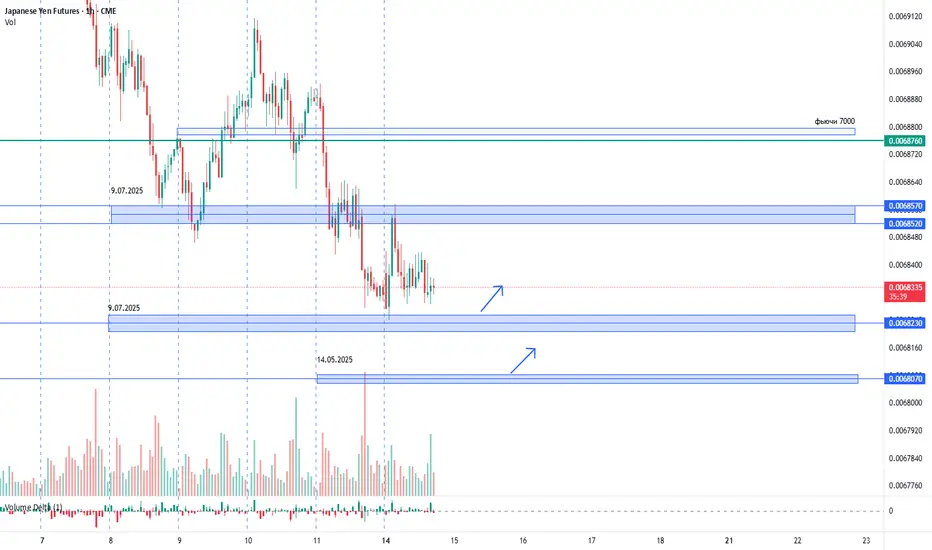
USDJPY. 14.07.2025. The plan for the next few days.The nearest interesting resistance zones have already been worked out at night and have given a good reaction. Let's mark the others where we can expect a reaction. It's not certain that there will be a major reversal, but I believe we will see a correction that can be monetized. We are waiting for a reaction and looking for an entry point.
The post will be adjusted based on changes.
Don't forget to click on the Rocket! =)
NIFTY 50 CHART ANALYSIS INTRADAYHere I give you a chart analysis on Nifty 50 for 8th July 2025. intraday trend is neutral and
mid trend is Berish but price to shifted to bullish trend. let's see what will happen in upcoming days.

XAUUSD H4 Outlook – July 7, 2025“You don’t chase gold. You set the trap, then wait.”
👋 Hey traders — we’re gearing up for a new week on gold, and the H4 chart is starting to speak clearly. After Friday’s clean push into premium rejection zones, price is now compressing beneath a key supply block. Structure is fragile, and the next move will likely come fast.
Let’s position with precision before the breakout.
—
🔸 H4 Bias
Structure remains bearish short-term, with clear lower highs forming below a major supply at 3344–3351.
The broader bias leans neutral as we trade between unmitigated demand and inducement-heavy resistance. Confirmation is everything.
—
🔴 Supply Zones (Sell Areas)
3344–3351
→ H4 Fair Value Gap + OB combo inside premium
→ If price wicks above recent highs and rejects here, it could trigger a clean swing sell.
3380–3394
→ Origin of the last bearish leg + liquidity wick
→ High-risk, high-reward rejection zone if price spikes impulsively this week (e.g. post-Fed tone or surprise volatility).
—
🟢 Demand Zones (Buy Areas)
3265–3275
→ H4 FVG + flip zone + prior sweep level
→ If price taps and holds here, we may see re-accumulation for a move toward 3327–3340.
3235–3246
→ Strong unmitigated OB + discount level
→ Ideal sniper long zone only on clean rejection + structure shift (BOS on M15+).
—
🟡 Flip / Decision Zone
3299–3305
→ EMA50 + micro-range equilibrium
→ If price breaks and holds above this zone with strength, bias turns short-term bullish. If it rejects, continuation down is favored.
—
🎯 Execution Notes
EMA21/50 are acting as active compression bands — watch for rejection pressure
RSI shows no clear divergence yet — but volume is thinning
Liquidity is building above 3340 and below 3265 — prepare for traps both ways
—
🔚 Final Words
Sniper traders aren’t early — they’re precise. If you’ve been reacting too fast lately, this is your week to reset. Gold is telling a story here… but only structure speaks the truth.
🚀 If this helps bring clarity to your outlook, tap follow — we do this daily, with structure, not signals.
—
📢 Disclosure: I use Trade Nation’s broker feed on TradingView and I’m part of their influencer program.
📉 This is educational content, not financial advice.

CADCHF - BEARISH - QUANT-LEVEL FX LISTDaily: Downtrend
H4: Downtrend
H1: Downtrend
m15: Downtrend
Risk of Entering Now: Better Zone a little higher
Target at least previous day low
tg@darksheeptrades

Review and plan for 1st July 2025Nifty future and banknifty future analysis and intraday plan.
swing idea - trent
This video is for information/education purpose only. you are 100% responsible for any actions you take by reading/viewing this post.
please consult your financial advisor before taking any action.
----Vinaykumar hiremath, CMT


GBPJPY I Intraday Short from Top of the ChannelWelcome back! Let me know your thoughts in the comments!
** GBPJPY Analysis - Listen to video!

Nasdaq Deep Bearish RetraceI Think we're going to retrace (potentially deeply) on FED release or just before it to then reverse aggressively higher.
I am considering the current "range" on m15 as re-distribution and expecting lower prices on Fed release or just prior before continuation higher that may be delayed till tomorrow next FED.

DXY: US dollar To Drop Further Around 95?The US dollar has been steadily declining since the new president was elected in the USA. This decline has been accompanied by the ongoing trade wars. Numerous economic indicators have supported this trend, and we anticipate further depreciation in the coming days or weeks. Before trading, it’s essential to conduct your own analysis and gain a comprehensive understanding of the market.
We wish you the best of success in trading. Good luck and trade safely.
Like and comment for more, and as always, happy trading!
Team Setupsfx_

USDJPY Trading RangeUSDJPY saw some corrections late on Friday. Overall, the pair remains sideways in a wide range of 143,000-145,100 and has yet to establish a clear continuation trend.
The wider band in the sideways trend is extended at 146,000 and 142,000.
The trading strategy will be based on the band that is touched.
Pay attention to the breakout as it may continue the strong trend and avoid trading against the trend when breaking.
Support: 143,000, 142,000
Resistance: 145,000, 146,000

Gold XAUUSD Possible Move 9th June 2025Market Structure:
The overall trend remains bearish, with a series of lower highs and lower lows.
Recent bullish retracement is corrective and approaching a key supply zone (3340 region).
Zones of Interest:
Supply Zone (Sell Area): 3335–3340
This area acted as a previous area of institutional selling. Price is expected to tap into this zone before resuming the downward move.
Demand Zone (Target): 3295–3305
This level served as a previous strong demand zone and aligns with previous reaction zones.
Liquidity & Structure:
Liquidity grab expected above minor highs around 3330–3335 before a potential reversal.
Structure shows a liquidity sweep, followed by a market shift confirming the bearish move.
Key Confluences:
Bearish market structure
Return to supply
Clear risk-to-reward setup
Anticipated lower high formation
Clean FVG + OB alignment in supply zone
📉 Trade Idea / Signal
Type: Sell Limit
Entry: 3335–3340
Stop Loss: 3355 (above supply zone highs)
Take Profit: 3320
Take Profit: 3300
Risk–Reward: ~1:3
🧠 Trade Plan
Wait for price to enter 3335–3340 zone.
Look for confirmation (e.g., bearish engulfing, BOS, CHoCH on LTF).
Execute short with SL above the zone.
Target the 3300 handle which aligns with the HTF demand zone and price imbalance fill.

BTC Scalping / Intraday Signal – Entry, Stop & Target Ready!🕒 Timeframe: 15min / 5min
⚠️ Note: Manage your risk — intraday volatility is high.
This is a short-term opportunity, not a long hold.
Disclaimer: This is our personal analysis and not financial advice. Always do your own research before making any investment decisions.
💬 What’s your take on this? Drop your thoughts in the comments and feel free to share this with your friends! ❤️

ETH Scalping Signal – Entry, Stop & Target Ready!🕒 Timeframe: 15min / 5min
⚠️ Note: Manage your risk — intraday volatility is high.
This is a short-term opportunity, not a long hold.
Disclaimer: This is our personal analysis and not financial advice. Always do your own research before making any investment decisions.
💬 What’s your take on this? Drop your thoughts in the comments and feel free to share this with your friends! ❤️

NASDAQ Meltdown Incoming? The Calm Before the Crash…🚨 Get ready! The NASDAQ is about to take us on a wild plunge straight to the depths of market hell... 💥🔥
Yes, yes, I know—they’ll say it’s all "because of this" or "due to that," the usual play-acting we’ve seen a hundred times before. Just another scene in the never-ending economic theater. 🎭
But here’s the forecast for tomorrow’s news:
📉 United States Initial Jobless Claims – possibly lower than expected?
📈 United States GDP Growth Rate QoQ – higher than expected?
And then... yada yada yada. You know the rest.
What does that mean? A chain reaction in risk-on assets — stocks, indexes, crypto — all heading for a steep drop. 💣📉
If you’re still a believer, here’s your solid proof — laid out 24 hours before it happens. Don’t say we didn’t warn you.
The choice is yours:
💊 Red pill or blue pill?

Review and plan for 23rd May 2025 Nifty future and banknifty future analysis and intraday plan.
Quarterly results
This video is for information/education purpose only. you are 100% responsible for any actions you take by reading/viewing this post.
please consult your financial advisor before taking any action.
----Vinaykumar hiremath, CMT

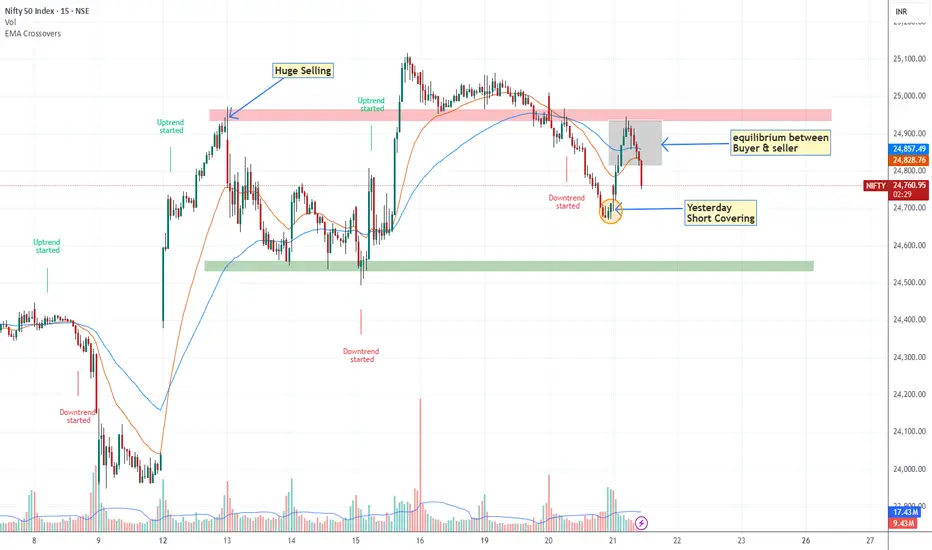
Nifty Might Range-Bound until it doesn't break 24950 levelToday 21/05/2025 around 11 O clock Nifty Tested 24950 the push was not above average volume driven that's why market was going to pullback although something absence of sellers comparatively had seen on 13 may u can see on chart but still it required to break 24950 level with good volume for being upward journey, until we expect market may range between 24500-25000.
strong Resistance- 24950-25000
Strong Support -24500
Fartcoin Potential UpsidesHey Traders, in today's trading session we are monitoring Fartcoin for a buying opportunity around 1.0480 zone, Fartcoin is trading in an uptrend and currently is in a correction phase in which it is approaching the trend at 1.0480 support and resistance area.
Trade safe, Joe.

XLMUSDT Potential UpsidesHey Traders, in today's trading session we are monitoring XLM/USDT for a buying opportunity around 0.2730 zone, XLM/USDT is trading in an uptrend and currently is in a correction phase in which it is approaching the trend at 0.2730 support and resistance area.
Trade safe, Joe.
