Bullish Continuation Buying after valid Retest with RRR of 1:2 as we can Clearly see the Market is Bullish so it can Turn out to be a High Probability Trade with proper Risk management.
Intraday-trading

NIFTY INTRADAY LEVELS FOR 03/10/2024BUY ABOVE - 25860
SL - 25790
TARGETS - 25920,25980,26050
SELL BELOW - 25700
SL - 25790
TARGETS - 25610,25550,25490
NO TRADE ZONE - 25700 to 25860
Previous Day High - 25920
Previous Day Low - 25700
Based on price action major support & resistance's are here, the red lines acts as resistances, the green lines acts as supports. If the price breaks the support/resistance, it will move to the next support/resistance line. White lines indicates previous day high & low, high acts as a resistance & low acts as a support for next day.
Trendlines are also significant to price action. If the price is above/below the trendlines, can expect an UP/DOWN with aggressive move.
Please NOTE: this levels are for intraday trading only.
Disclaimer - All information on this page is for educational purposes only,
we are not SEBI Registered, Please consult a SEBI registered financial advisor for your financial matters before investing And taking any decision. We are not responsible for any profit/loss you made.
Request your support and engagement by liking and commenting & follow to provide encouragement
HAPPY TRADING 👍

NIFTY INTRADAY LEVELS FOR 12/08/2024BUY ABOVE - 24380
SL - 24320
TARGETS - 24440,24530,24590
SELL BELOW - 24320
SL - 24380
TARGETS - 24270,24200,24110
NO TRADE ZONE - 24320 to 24380
Previous Day High - 24440
Previous Day Low - 24320
Based on price action major support & resistance's are here, the red lines acts as resistances, the green lines acts as supports. If the price breaks the support/resistance, it will move to the next support/resistance line. White lines indicates previous day high & low, high acts as a resistance & low acts as a support for next day.
Trendlines are also significant to price action. If the price is above/below the trendlines, can expect an UP/DOWN with aggressive move.
Please NOTE: this levels are for intraday trading only.
Disclaimer - All information on this page is for educational purposes only,
we are not SEBI Registered, Please consult a SEBI registered financial advisor for your financial matters before investing And taking any decision. We are not responsible for any profit/loss you made.
Request your support and engagement by liking and commenting & follow to provide encouragement
HAPPY TRADING 👍


NIFTY INTRADAY LEVELS FOR 09/07/2024BUY ABOVE - 24350
SL - 24300
TARGETS - 24400,24480,24550
SELL BELOW - 24300
SL - 24350
TARGETS - 24230,24160,24060
NO TRADE ZONE - 24300 to 24350
Previous Day High - 24350
Previous Day Low - 24230
Based on price action major support & resistance's are here, the red lines acts as resistances, the green lines acts as supports. If the price breaks the support/resistance, it will move to the next support/resistance line. White lines indicates previous day high & low, high acts as a resistance & low acts as a support for next day.
Trendlines are also significant to price action. If the price is above/below the trendlines, can expect an UP/DOWN with aggressive move.
Please NOTE: this levels are for intraday trading only.
Disclaimer - All information on this page is for educational purposes only,
we are not SEBI Registered, Please consult a SEBI registered financial advisor for your financial matters before investing And taking any decision. We are not responsible for any profit/loss you made.
Request your support and engagement by liking and commenting & follow to provide encouragement
HAPPY TRADING 👍

NIFTY INTRADAY ANALYSIS FOR 4TH JULY 2024BUY ABOVE - 24300
SL - 24230
TARGETS - 24380,24450,24520
SELL BELOW - 24230
SL - 24300
TARGETS - 24160,24060,23990
NO TRADE ZONE - 24230 to 24300
Previous Day High - 24300
Previous Day Low - 24230
Based on price action major support & resistance's are here, the red lines acts as resistances, the green lines acts as supports. If the price breaks the support/resistance, it will move to the next support/resistance line. White lines indicates previous day high & low, high acts as a resistance & low acts as a support for next day.
Trendlines are also significant to price action. If the price is above/below the trendlines, can expect an UP/DOWN with aggressive move.
Please NOTE: this levels are for intraday trading only.
Disclaimer - All information on this page is for educational purposes only,
we are not SEBI Registered, Please consult a SEBI registered financial advisor for your financial matters before investing And taking any decision. We are not responsible for any profit/loss you made.
Request your support and engagement by liking and commenting & follow to provide encouragement
HAPPY TRADING 👍

BANK NIFTY INTRADAY LEVELS FOR 27 JUNE 2024BUY ABOVE - 53000
SL - 52670
TARGETS - 53200,53400,53600
SELL BELOW - 52670
SL - 53000
TARGETS - 52400,52200,51960
NO TRADE ZONE - 52670 to 53000
Previous Day High - 53000
Previous Day Low - 52400
Based on price action major support & resistance's are here, the red lines acts as resistances, the green lines acts as supports. If the price breaks the support/resistance, it will move to the next support/resistance line. White lines indicates previous day high & low, high acts as a resistance & low acts as a support for next day.
Trendlines are also significant to price action. If the price is above/below the trendlines, can expect an UP/DOWN with aggressive move.
Please NOTE: this levels are for intraday trading only.
Disclaimer - All information on this page is for educational purposes only,
we are not SEBI Registered, Please consult a SEBI registered financial advisor for your financial matters before investing And taking any decision. We are not responsible for any profit/loss you made.
Request your support and engagement by liking and commenting & follow to provide encouragement
HAPPY TRADING 👍

AUDCADHi guys,
In this chart i Found a Demand Zone in AUDCAD CHART for short term trading entry,
Observed these Levels based on price action and Demand & Supply.
*Don't Take any trades based on this Picture.
... because this chart is for educational purpose only not for Buy or Sell Recommendation..
Thank you

BANK NIFTY INTRADAY LEVELS FOR 25 JUNE 2024BUY ABOVE - 51740
SL - 51510
TARGETS - 51960,52200,52500
SELL BELOW - 51510
SL - 51740
TARGETS - 5151200,50950,50730
NO TRADE ZONE - 51510 to 51740
Previous Day High - 51740
Previous Day Low - 51200
Based on price action major support & resistance's are here, the red lines acts as resistances, the green lines acts as supports. If the price breaks the support/resistance, it will move to the next support/resistance line. White lines indicates previous day high & low, high acts as a resistance & low acts as a support for next day.
Trendlines are also significant to price action. If the price is above/below the trendlines, can expect an UP/DOWN with aggressive move.
Please NOTE: this levels are for intraday trading only.
Disclaimer - All information on this page is for educational purposes only,
we are not SEBI Registered, Please consult a SEBI registered financial advisor for your financial matters before investing And taking any decision. We are not responsible for any profit/loss you made.
Request your support and engagement by liking and commenting & follow to provide encouragement
HAPPY TRADING 👍

NIFTY INTRADAY LEVELS FOR 24/06/2024BUY ABOVE - 23500
SL - 23430
TARGETS - 23580,23650,23730
SELL BELOW - 23430
SL - 23500
TARGETS - 23370,23300,23230
NO TRADE ZONE - 23430 to 23500
Previous Day High - 23650
Previous Day Low - 23430
Based on price action major support & resistance's are here, the red lines acts as resistances, the green lines acts as supports. If the price breaks the support/resistance, it will move to the next support/resistance line. White lines indicates previous day high & low, high acts as a resistance & low acts as a support for next day.
Trendlines are also significant to price action. If the price is above/below the trendlines, can expect an UP/DOWN with aggressive move.
Please NOTE: this levels are for intraday trading only.
Disclaimer - [/b ]All information on this page is for educational purposes only,
we are not SEBI Registered, Please consult a SEBI registered financial advisor for your financial matters before investing And taking any decision. We are not responsible for any profit/loss you made.
Request your support and engagement by liking and commenting & follow to provide encouragement
HAPPY TRADING 👍

BANK NIFTY INTRADAY LEVELS FOR 24/06/2024BUY ABOVE - 51960
SL - 51600
TARGETS - 52200,52500,52800
SELL BELOW - 51600
SL - 51960
TARGETS - 51200,50950,50730
NO TRADE ZONE - 51600 to 51960
Previous Day High - 51960
Previous Day Low - 51200
Based on price action major support & resistance's are here, the red lines acts as resistances, the green lines acts as supports. If the price breaks the support/resistance, it will move to the next support/resistance line. White lines indicates previous day high & low, high acts as a resistance & low acts as a support for next day.
Trendlines are also significant to price action. If the price is above/below the trendlines, can expect an UP/DOWN with aggressive move.
Please NOTE: this levels are for intraday trading only.
Disclaimer - All information on this page is for educational purposes only,
we are not SEBI Registered, Please consult a SEBI registered financial advisor for your financial matters before investing And taking any decision. We are not responsible for any profit/loss you made.
Request your support and engagement by liking and commenting & follow to provide encouragement
HAPPY TRADING 👍

BANK NIFTY INTRADAY LEVELS FOR 20/06/2024BUY ABOVE - 51600
SL - 51200
TARGETS - 51960,52200,52500
SELL BELOW - 51200
SL - 51600
TARGETS - 50950,50730,50550
NO TRADE ZONE - 51200 to 51600
Previous Day High - 51960
Previous Day Low - 50400
Based on price action major support & resistance's are here, the red lines acts as resistances, the green lines acts as supports. If the price breaks the support/resistance, it will move to the next support/resistance line. White lines indicates previous day high & low, high acts as a resistance & low acts as a support for next day.
Trendlines are also significant to price action. If the price is above/below the trendlines, can expect an UP/DOWN with aggressive move.
Please NOTE: this levels are for intraday trading only.
Disclaimer - All information on this page is for educational purposes only,
we are not SEBI Registered, Please consult a SEBI registered financial advisor for your financial matters before investing And taking any decision. We are not responsible for any profit/loss you made.
Request your support and engagement by liking and commenting & follow to provide encouragement
HAPPY TRADING 👍

BANK NIFTY INTRADAY LEVELS FOR 13 JUNE 2024BUY ABOVE - 49890
SL - 49670
TARGETS - 50100,50250,50550
SELL BELOW - 49670
SL - 49890
TARGETS - 49530,49290,49050
NO TRADE ZONE - 49690 to 49890
Previous Day High - 50250
Previous Day Low - 49690
Based on price action major support & resistance's are here, the red lines acts as resistances, the green lines acts as supports. If the price breaks the support/resistance, it will move to the next support/resistance line. White lines indicates previous day high & low, high acts as a resistance & low acts as a support for next day.
Trendlines are also significant to price action. If the price is above/below the trendlines, can expect an UP/DOWN with aggressive move.
Please NOTE: this levels are for intraday trading only.
Disclaimer - All information on this page is for educational purposes only,
we are not SEBI Registered, Please consult a SEBI registered financial advisor for your financial matters before investing And taking any decision. We are not responsible for any profit/loss you made.
Request your support and engagement by liking and commenting & follow to provide encouragement
HAPPY TRADING 👍

NIFTY INTRADAY LEVELS FOR 12 JUNE 2024BUY ABOVE - 23300
SL - 23230
TARGETS - 23410,23500,23600
SELL BELOW - 23230
SL - 23300
TARGETS - 23150,23080,23000
NO TRADE ZONE - 23230 to 23300
Previous Day High - 23410
Previous Day Low - 23230
Based on price action major support & resistance's are here, the red lines acts as resistances, the green lines acts as supports. If the price breaks the support/resistance, it will move to the next support/resistance line. White lines indicates previous day high & low, high acts as a resistance & low acts as a support for next day.
Trendlines are also significant to price action. If the price is above/below the trendlines, can expect an UP/DOWN with aggressive move.
Please NOTE: this levels are for intraday trading only.
Disclaimer - All information on this page is for educational purposes only,
we are not SEBI Registered, Please consult a SEBI registered financial advisor for your financial matters before investing And taking any decision. We are not responsible for any profit/loss you made.
Request your support and engagement by liking and commenting & follow to provide encouragement
HAPPY TRADING 👍

BANK NIFTY INTRADAY LEVELS FOR 28 MAY 2024BUY ABOVE - 49480
SL - 49290
TARGETS - 49670,49850,50000
SELL BELOW - 49290
SL - 49480
TARGETS - 49050,48800,48620
NO TRADE ZONE - 49050 to 49670
Previous Day High - 49670
Previous Day Low - 49050
Based on price action major support & resistance's are here, the red lines acts as resistances, the green lines acts as supports. If the price breaks the support/resistance, it will move to the next support/resistance line. White lines indicates previous day high & low, high acts as a resistance & low acts as a support for next day.
Trendlines are also significant to price action. If the price is above/below the trendlines, can expect an UP/DOWN with aggressive move.
Please NOTE: this levels are for intraday trading only.
Disclaimer - All information on this page is for educational purposes only,
we are not SEBI Registered, Please consult a SEBI registered financial advisor for your financial matters before investing And taking any decision. We are not responsible for any profit/loss you made.
Request your support and engagement by liking and commenting & follow to provide encouragement
HAPPY TRADING 👍

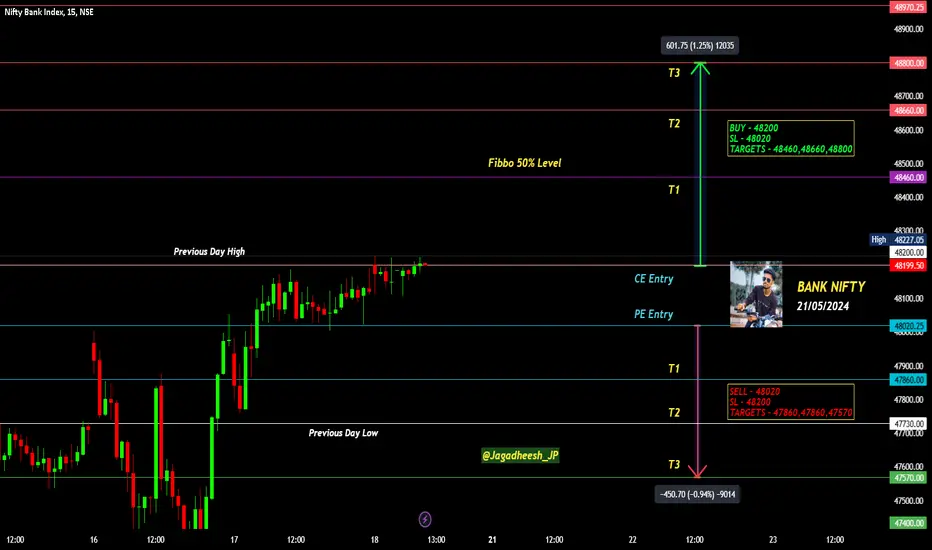
BANK NIFTY INTRADAY LEVELS FOR 21 MAY 2024BUY ABOVE - 48200
SL - 48020
TARGETS - 48460,48660,48800
SELL BELOW - 48020
SL - 48200
TARGETS - 47860,47860,47570
NO TRADE ZONE - 48020 to 48200
Previous Day High - 48200
Previous Day Low - 47730
Based on price action major support & resistance's are here, the red lines acts as resistances, the green lines acts as supports. If the price breaks the support/resistance, it will move to the next support/resistance line. White lines indicates previous day high & low, high acts as a resistance & low acts as a support for next day.
Trendlines are also significant to price action. If the price is above/below the trendlines, can expect an UP/DOWN with aggressive move.
Please NOTE: this levels are for intraday trading only.
Disclaimer - All information on this page is for educational purposes only,
we are not SEBI Registered, Please consult a SEBI registered financial advisor for your financial matters before investing And taking any decision. We are not responsible for any profit/loss you made.
Request your support and engagement by liking and commenting & follow to provide encouragement
HAPPY TRADING 👍
NIFTY INTRADAY LEVELS FOR 21 MAY 2024BUY ABOVE - 22500
SL - 22430
TARGETS - 22550,22600,22640
SELL BELOW - 22430
SL - 22500
TARGETS - 22350,22300,22230
NO TRADE ZONE - 22430 to 22500
Previous Day High - 22500
Previous Day Low - 22350
Based on price action major support & resistance's are here, the red lines acts as resistances, the green lines acts as supports. If the price breaks the support/resistance, it will move to the next support/resistance line. White lines indicates previous day high & low, high acts as a resistance & low acts as a support for next day.
Trendlines are also significant to price action. If the price is above/below the trendlines, can expect an UP/DOWN with aggressive move.
Please NOTE: this levels are for intraday trading only.
Disclaimer - All information on this page is for educational purposes only,
we are not SEBI Registered, Please consult a SEBI registered financial advisor for your financial matters before investing And taking any decision. We are not responsible for any profit/loss you made.
Request your support and engagement by liking and commenting & follow to provide encouragement
HAPPY TRADING 👍

NIFTY INTRADAY LEVELS FOR 13/05/2024BUY ABOVE - 22070
SL - 22020
TARGETS - 22120,22180,22240
SELL BELOW - 22020
SL - 22070
TARGETS - 21960,21900,21850
NO TRADE ZONE - 22020 to 22070
Previous Day High - 22120
Previous Day Low - 21960
Based on price action major support & resistance's are here, the red lines acts as resistances, the green lines acts as supports. If the price breaks the support/resistance, it will move to the next support/resistance line. White lines indicates previous day high & low, high acts as a resistance & low acts as a support for next day.
Trendlines are also significant to price action. If the price is above/below the trendlines, can expect an UP/DOWN with aggressive move.
Please NOTE: this levels are for intraday trading only.
Disclaimer - All information on this page is for educational purposes only,
we are not SEBI Registered, Please consult a SEBI registered financial advisor for your financial matters before investing And taking any decision. We are not responsible for any profit/loss you made.
Request your support and engagement by liking and commenting & follow to provide encouragement
HAPPY TRADING 👍

BANK NIFTY INTRADAY LEVELS FOR 09/05/2024BUY ABOVE - 48220
SL - 48050
TARGETS - 48460,48660,48800
SELL BELOW - 47900
SL - 48050
TARGETS - 47730,47560,47400
NO TRADE ZONE - 47900 to 48220
Previous Day High - 48220
Previous Day Low - 47900
Based on price action major support & resistance's are here, the red lines acts as resistances, the green lines acts as supports. If the price breaks the support/resistance, it will move to the next support/resistance line. White lines indicates previous day high & low, high acts as a resistance & low acts as a support for next day.
Trendlines are also significant to price action. If the price is above/below the trendlines, can expect an UP/DOWN with aggressive move.
Please NOTE: this levels are for intraday trading only.
Disclaimer - All information on this page is for educational purposes only,
we are not SEBI Registered, Please consult a SEBI registered financial advisor for your financial matters before investing And taking any decision. We are not responsible for any profit/loss you made.
Request your support and engagement by liking and commenting & follow to provide encouragement
HAPPY TRADING 👍

BANK NIFTY INTRADAY LEVELS FOR 03/05/2024BUY ABOVE - 49480
SL - 49340
TARGETS - 49670,49850,50000
SELL BELOW - 49180
SL - 49340
TARGETS - 49020,48800,48630
NO TRADE ZONE - 49180 to 49480
Previous Day High - 49480
Previous Day Low - 49180
Based on price action major support & resistance's are here, the red lines acts as resistances, the green lines acts as supports. If the price breaks the support/resistance, it will move to the next support/resistance line. White lines indicates previous day high & low, high acts as a resistance & low acts as a support for next day.
Trendlines are also significant to price action. If the price is above/below the trendlines, can expect an UP/DOWN with aggressive move.
Please NOTE: this levels are for intraday trading only.
Disclaimer - All information on this page is for educational purposes only,
we are not SEBI Registered, Please consult a SEBI registered financial advisor for your financial matters before investing And taking any decision. We are not responsible for any profit/loss you made.
Request your support and engagement by liking and commenting & follow to provide encouragement
HAPPY TRADING 👍

BANK NIFTY INTRADAY LEVEL FOR 29/04/2024BUY ABOVE - 48310
SL - 48220
TARGETS - 48400,48500,48630
SELL BELOW - 48120
SL - 48220
TARGETS - 48030,47940,47840
NO TRADE ZONE - 48120 to 48310
Previous Day High - 48630
Previous Day Low - 48120
Based on price action major support & resistance's are here, the red lines acts as resistances, the green lines acts as supports. If the price breaks the support/resistance, it will move to the next support/resistance line. White lines indicates previous day high & low, high acts as a resistance & low acts as a support for next day.
Trendlines are also significant to price action. If the price is above/below the trendlines, can expect an UP/DOWN with aggressive move.
Please NOTE: this levels are for intraday trading only.
Disclaimer - All information on this page is for educational purposes only,
we are not SEBI Registered, Please consult a SEBI registered financial advisor for your financial matters before investing And taking any decision. We are not responsible for any profit/loss you made.
Request your support and engagement by liking and commenting & follow to provide encouragement
HAPPY TRADING 👍

S&P 500 INTRADAY LEVELS FOR 18/03/2024BUY ABOVE - 5124
SL - 5113
TARGETS - 5131,5140,5150
SELL BELOW - 5113
SL - 5124
TARGETS - 5104,5091,5083
NO TRADE ZONE - 5113 to 5124
Previous Day High - 5131
Previous Day Low - 5104
Based on price action major support & resistance's are here, the red lines acts as resistances, the green lines acts as supports. If the price breaks the support/resistance, it will move to the next support/resistance line. White lines indicates previous day high & low, high acts as a resistance & low acts as a support for next day.
Trendlines are also significant to price action. If the price is above/below the trendlines, can expect an UP/DOWN with aggressive move.
Please NOTE: this levels are for intraday trading only.
Disclaimer - All information on this page is for educational purposes only,
we are not SEBI Registered, Please consult a SEBI registered financial advisor for your financial matters before investing And taking any decision. We are not responsible for any profit/loss you made.
Request your support and engagement by liking and commenting & follow to provide encouragement
HAPPY TRADING 👍

NIFTY INTRADAY LEVELS FOR 14/03/2024BUY - 47200
SL - 47050
TARGETS - 47500,47650,47800
SELL - 46870
SL - 47050
TARGETS - 46750,46560,46450
NO TRADE ZONE - 46870 to 47200
Previous Day High - 47500
Previous Day Low - 46870
Based on price action major support & resistance's are here, the red lines acts as resistances, the green lines acts as supports. If the price breaks the support/resistance, it will move to the next support/resistance line. White lines indicates previous day high & low, high acts as a resistance & low acts as a support for next day.
Trendlines are also significant to price action. If the price is above/below the trendlines, can expect an UP/DOWN with aggressive move.
Please NOTE: this levels are for intraday trading only.
Disclaimer - All information on this page is for educational purposes only,
we are not SEBI Registered, Please consult a SEBI registered financial advisor for your financial matters before investing And taking any decision. We are not responsible for any profit/loss you made.
Request your support and engagement by liking and commenting & follow to provide encouragement
HAPPY TRADING 👍
