BANK NIFTY INTRADAY LEVELS FOR 01/03/2024BUY ABOVE - 46300
SL - 46100
TARGETS - 46450,46560,46750
SELL BELOW - 45930
SL - 46100
TARGETS - 45730,45570,45330
NO TRADE ZONE - 45930 to 46300
Previous Day High - 46300
Previous Day Low - 45730
Based on price action major support & resistance's are here, the red lines acts as resistances, the green lines acts as supports. If the price breaks the support/resistance, it will move to the next support/resistance line. White lines indicates previous day high & low, high acts as a resistance & low acts as a support for next day.
Trendlines are also significant to price action. If the price is above/below the trendlines, can expect an UP/DOWN with aggressive move.
Please NOTE: this levels are for intraday trading only.
Disclaimer - All information on this page is for educational purposes only,
we are not SEBI Registered, Please consult a SEBI registered financial advisor for your financial matters before investing And taking any decision. We are not responsible for any profit/loss you made.
Request your support and engagement by liking and commenting & follow to provide encouragement
HAPPY TRADING 👍
Intraday-trading

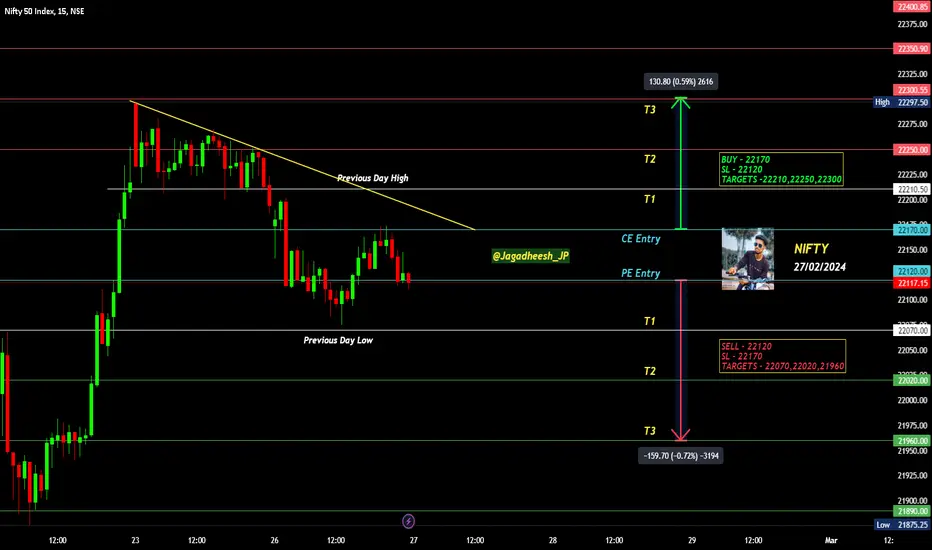
NIFTY INTRADAY LEVELS FOR 27/02/2024BUY ABOVE - 22170
SL - 22120
TARGETS -22210,22250,22300
SELL BELOW - 22120
SL - 22170
TARGETS - 22070,22020,21960
NO TRADE ZONE - 22120 to 22170
Previous Day High - 22210
Previous Day Low - 22070
Based on price action major support & resistance's are here, the red lines acts as resistances, the green lines acts as supports. If the price breaks the support/resistance, it will move to the next support/resistance line. White lines indicates previous day high & low, high acts as a resistance & low acts as a support for next day.
Trendlines are also significant to price action. If the price is above/below the trendlines, can expect an UP/DOWN with aggressive move.
Please NOTE: this levels are for intraday trading only.
Disclaimer - All information on this page is for educational purposes only,
we are not SEBI Registered, Please consult a SEBI registered financial advisor for your financial matters before investing And taking any decision. We are not responsible for any profit/loss you made.
Request your support and engagement by liking and commenting & follow to provide encouragement
HAPPY TRADING 👍
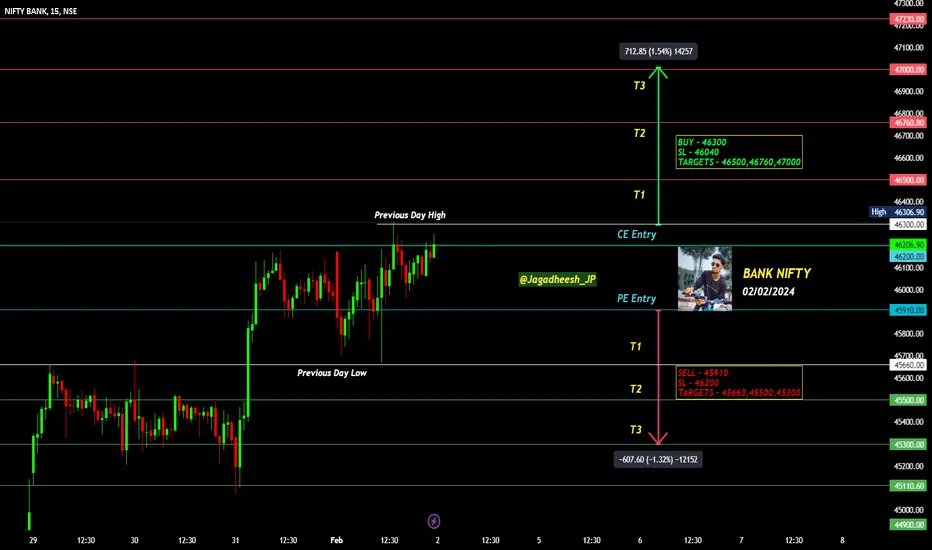
BANK NIFTY INTRADAY LEVELS FOR 02/02/2024BUY ABOVE - 46300
SL - 46040
TARGETS - 46500,46760,47000
SELL BELOW - 45910
SL - 46200
TARGETS - 45660,45500,45300
NO TRADE ZONE - 45910 to 46300
Previous Day High - 46300
Previous Day Low - 45660
Based on price action major support & resistance's are here, the red lines acts as resistances, the green lines acts as supports. If the price breaks the support/resistance, it will move to the next support/resistance line. White lines indicates previous day high & low, high acts as a resistance & low acts as a support for next day.
Trendlines are also significant to price action. If the price is above/below the trendlines, can expect an UP/DOWN with aggressive move.
Please NOTE: this levels are for intraday trading only.
Disclaimer - All information on this page is for educational purposes only,
we are not SEBI Registered, Please consult a SEBI registered financial advisor for your financial matters before investing And taking any decision. We are not responsible for any profit/loss you made.
Request your support and engagement by liking and commenting & follow to provide encouragement
HAPPY TRADING 👍
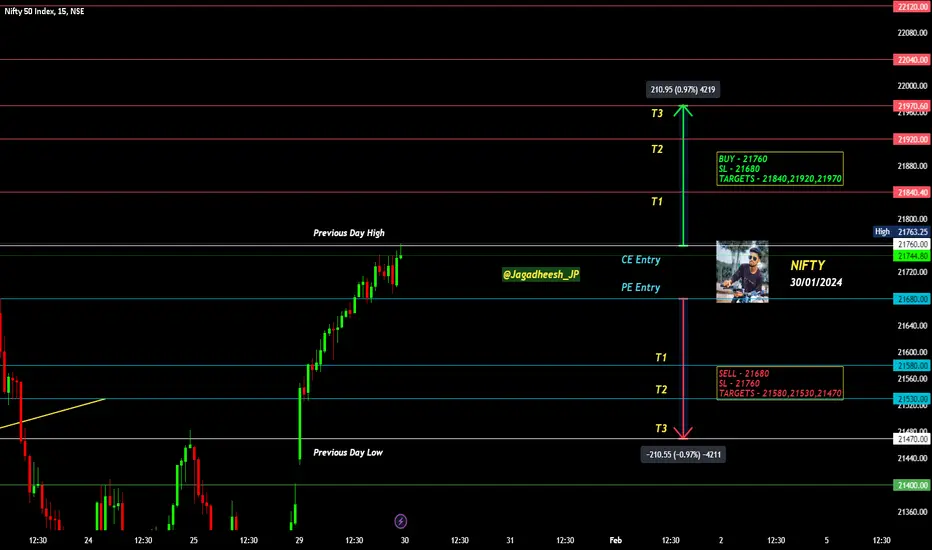
NIFTY INTRADAY LEVELS FOR 30/01/2024BUY ABOVE - 21760
SL - 21680
TARGETS - 21840,21920,21970
SELL BELOW - 21680
SL - 21760
TARGETS - 21580,21530,21470
NO TRADE ZONE - 21680 to 21760
Previous Day High - 21760
Previous Day Low - 21470
Based on price action major support & resistance's are here, the red lines acts as resistances, the green lines acts as supports. If the price breaks the support/resistance, it will move to the next support/resistance line. White lines indicates previous day high & low, high acts as a resistance & low acts as a support for next day.
Trendlines are also significant to price action. If the price is above/below the trendlines, can expect an UP/DOWN with aggressive move.
Please NOTE: this levels are for intraday trading only.
Disclaimer - All information on this page is for educational purposes only,
we are not SEBI Registered, Please consult a SEBI registered financial advisor for your financial matters before investing And taking any decision. We are not responsible for any profit/loss you made.
Request your support and engagement by liking and commenting & follow to provide encouragement
HAPPY TRADING 👍
NIFTY INTRADAY LEVELS FOR 19/01/2024BUY ABOVE - 21540
SL - 21480
TARGETS - 21610,21680,21730
SELL BELOW - 21420
SL - 21480
TARGETS - 21300,21210,21130
NO TRADE ZONE - 21420 to 21540
Previous Day High - 21540
Previous Day Low - 21300
Based on price action major support & resistance's are here, the red lines acts as resistances, the green lines acts as supports. If the price breaks the support/resistance, it will move to the next support/resistance line. White lines indicates previous day high & low, high acts as a resistance & low acts as a support for next day.
Trendlines are also significant to price action. If the price is above/below the trendlines, can expect an UP/DOWN with aggressive move.
Please NOTE: this levels are for intraday trading only.
Disclaimer - All information on this page is for educational purposes only,
we are not SEBI Registered, Please consult a SEBI registered financial advisor for your financial matters before investing And taking any decision. We are not responsible for any profit/loss you made.
Request your support and engagement by liking and commenting & follow to provide encouragement
HAPPY TRADING 👍

Today's GOLD strategy will decrease to the 2054 area and then reOctober brought a significant turning point for gold as rising geopolitical uncertainty coupled with the prospect of changes to US monetary policy caused spot prices in USD/oz to increase by 7.32% - biggest monthly gain since March 2023. Gold ended the month up 8.76% year to date, while also breaching the psychological US$2000/oz threshold on October 27 for the first time since March Year. October also marked the third consecutive month of losses across global and US stocks - the first since 2020 - with the SP 500® Index and MSCI ACWI Index falling 2.1% and 3%, respectively. 0% in October, despite the US posting a gross domestic product of 4.9%. product growth (GDP) in Q3 2023.
Gold's rally was fueled by increased geopolitical volatility following the October 7 Hamas attack on Israel, with Israel responding by declaring war on Hamas in the Gaza Strip. Market concerns about the potential escalation of this conflict and regional spillovers across the Middle East have boosted risk sentiment and demand for defensive assets such as gold. As geopolitical uncertainty remains high in the Middle East and Ukraine, gold may continue to receive support from portfolio diversification and safe-haven purchases.
The consensus that the Federal Reserve (Fed) was nearing the end of its rate hike cycle solidified in October. After pausing interest rates since the September 20 FOMC meeting, the decision to leave rates unchanged on November 1 for the second straight meeting confirmed market expectations that had boosted gold throughout October. Looking ahead, markets continue to price in a mid-term Fed rate cut 2024, which should support gold prices later in the year.

BANK NIFTY INTRADAY LEVELS FOR 29/11/2023BUY ABOVE - 43960
SL - 43870
TARGETS - 44060,44170,44260
SELL BELOW - 43800
SL - 43870
TARGETS - 43740,43650,43560
NO TRADE ZONE - 43800 to 43960
Previous Day High - 43960
Previous Day Low - 43740
I am sharing BANK NIFTY levels this levels acts as important support & resistance for intraday. if you want to trade with this levels wait for 15 min Candle closing above that levels. You can trade with breakout and reversal both.
In this channel, I share my expertise in trading strategies, technical analysis, and market trends to help you make informed decisions in your trading ventures.
Stay tuned for daily updates, in-depth market analyses, and real-time trading scenarios to witness firsthand how we transform from Zero to Hero in the trading world. My Only aim is to empower you with the knowledge and skills necessary to navigate the complexities of the financial markets successfully.
Based on price action major support & resistance's are here, the red lines acts as resistances, the green lines acts as supports. If the price breaks the support/resistance, it will move to the next support/resistance line. White lines indicates previous day high & low, high acts as a resistance & low acts as a support for next day.
Trendlines are also significant to price action. If the price is above/below the trendlines, can expect an UP/DOWN with aggressive move.
Please NOTE: this levels are for intraday trading only.
Disclaimer - All information on this page is for educational purposes only,
we are not SEBI Registered, Please consult a SEBI registered financial advisor for your financial matters before investing And taking any decision. We are not responsible for any profit/loss you made.
Request your support and engagement by liking and commenting & follow to provide encouragement
HAPPY TRADING 👍

Market Review for Thursday 16-11-23 Trading OpportunitiesA look at the Market Sentiment and trading opportunities on offer for the session. Review of the price action we want to see prior to an entry Setup.
The only Trades which have been highlighted are ones coming off a level and showing promise.

NIFTY INTRADAY LEVELS FOR 13/11/2023BUY ABOVE - 19540
SL - 19510
TARGETS - 19590,19660,19720
SELL BELOW - 19510
SL - 19540
TARGETS - 19460,19410,19370
NO TRADE ZONE - 19510 to 19540
Previous Day High - 19540
Previous Day Low - 19510
I am sharing NIFTY levels this levels acts as important support & resistance for intraday. if you want to trade with this levels wait for 15 min Candle closing above that levels. You can trade with breakout and reversal both.
In this channel, I share my expertise in trading strategies, technical analysis, and market trends to help you make informed decisions in your trading ventures.
Stay tuned for daily updates, in-depth market analyses, and real-time trading scenarios to witness firsthand how we transform from Zero to Hero in the trading world. My Only aim is to empower you with the knowledge and skills necessary to navigate the complexities of the financial markets successfully.
Based on price action major support & resistance's are here, the red lines acts as resistances, the green lines acts as supports. If the price breaks the support/resistance, it will move to the next support/resistance line. White lines indicates previous day high & low, high acts as a resistance & low acts as a support for next day.
Please NOTE: this levels are for intraday trading only.
Disclaimer - All information on this page is for educational purposes only,
we are not SEBI Registered, Please consult a SEBI registered financial advisor for your financial matters before investing And taking any decision. We are not responsible for any profit/loss you made.
Request your support and engagement by liking and commenting & follow to provide encouragement
HAPPY TRADING 👍

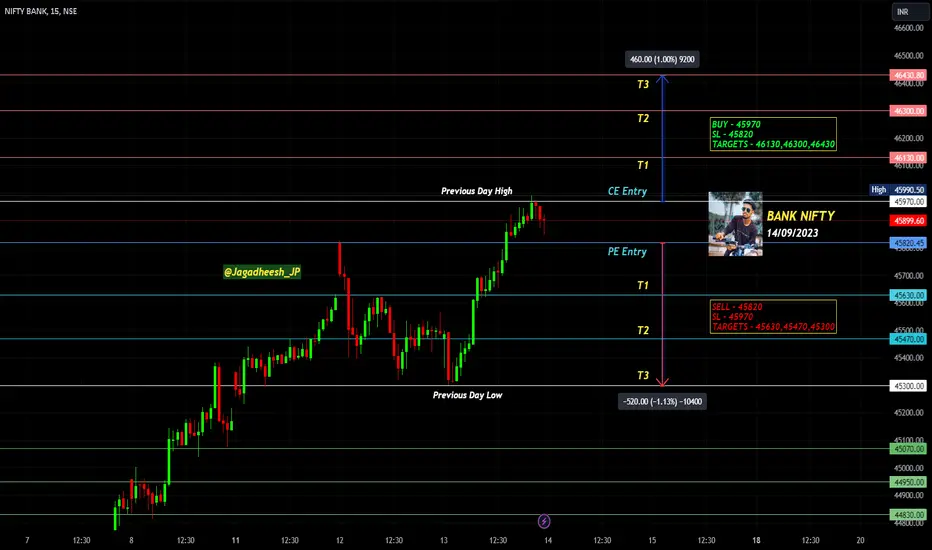
BANK NIFTY INTRADAY LEVELS FOR 14/09/2023BUY ABOVE - 45970
SL - 45820
TARGETS - 46130,46300,46430
SELL BELOW - 45820
SL - 45970
TARGETS - 45630,45470,45300
Previous Day High - 45990
Previous Day Low - 45300
I am sharing BANK NIFTY levels this levels acts as important support & resistance for intraday. if you want to trade with this levels wait for 15 min Candle closing above that levels. You can trade with breakout and reversal both.
In this channel, I share my expertise in trading strategies, technical analysis, and market trends to help you make informed decisions in your trading ventures.
Stay tuned for daily updates, in-depth market analyses, and real-time trading scenarios to witness firsthand how we transform from Zero to Hero in the trading world. My Only aim is to empower you with the knowledge and skills necessary to navigate the complexities of the financial markets successfully.
Based on price action major support & resistance's are here, the red lines acts as resistances, the green lines acts as supports. If the price breaks the support/resistance, it will move to the next support/resistance line. White lines indicates previous day high & low, high acts as a resistance & low acts as a support for next day.
Trendlines are also significant to price action. If the price is above/below the trendlines, can expect an UP/DOWN with aggressive move.
Please NOTE: this levels are for intraday trading only.
Disclaimer - All information on this page is for educational purposes only,
we are not SEBI Registered, Please consult a SEBI registered financial advisor for your financial matters before investing And taking any decision. We are not responsible for any profit/loss you made.
Request your support and engagement by liking and commenting & follow to provide encouragement
HAPPY TRADING 👍
Banknifty Intraday Levels 04/08/2023BUY ABOVE 44750
TARGET-1 44860
TARGET-2 44930
TARGET-3 45000
SELL BELOW 44500
TARGET-1 44400
TARGET-2 44281
TARGET-3 44150
44500 is a very important level, 44500 is the make or break point, which was easily broken today, but today's closing is at the level of 44500, if it breaks, then the market may fall to 44100-44000.
If there is any reversal then it will come from 44000- 44100.

BANK NIFTY INTRADAY LEVELS FOR 17/07/2023PARALLEL CHANNEL FORMATION
Price is consolidating in a PARALLEL CHANNEL which has been tested multiple times as resistance and support. 44550 to 44500 is a good support area from where buyers are continuously trying to push the price upside and 45000 is a good resistance where sellers are active.
if any side breakout happens we can get a good targets
For Intraday Trading levels is 👇
BUY ABOVE - 44940
SL - 44850
TARGETS - 45100,45240,45370
SELL BELOW - 44850
SL - 44940
TARGETS - 44720,44600,44500
SORRY! For the late posting guys.... 😔🤒🤧 I'm not feeling well
Disclaimer - All information on this page is for educational purposes only,
we are not SEBI Registered, Please consult a SEBI registered financial advisor for your financial matters before investing And taking any decision. We are not responsible for any profit/loss you made.
HAPPY TRADING 👍
@Jagadheesh_Jk

BANK NIFTY ANALYSIS - 30/06/2023BUY ABOVE - 44100
SL - 43940
TARGETS - 44260,44480,44600
SELL BELOW - 43940
SL - 44100
TARGETS - 43810,43700,43530
Trade Safe & Happy Trading Guys
This is only for educational purpose so TAKE YOUR OWN RISK REWARD

NIFTY ANALYSIS - 21/06/2023BUY ABOVE - 18820
SL - 18790
TARGETS - 18870,18920,18960
SELL BELOW - 18790
SL - 18820
TARGETS - 18750,18640,18610
Trade Safe & Happy Trading Guys
This is only for educational purpose so TAKE YOUR OWN RISK REWARD

BANK NIFTY ANALYSIS - 20/06/2023BUY ABOVE - 43700
SL - 43530
TARGETS - 43870,44000,40280
SELL BELOW - 43530
SL - 43700
TARGETS - 43390,43170,43030
Trade Safe & Happy Trading Guys
This is only for educational purpose so TAKE YOUR OWN RISK REWARD

BANK NIFTY ANALYSIS - 29/05/2023BUY ABOVE - 44080
SL - 43960
TARGETS - 44150,44250,44400
SELL BELOW - 43960
SL - 44080
TARGETS - 43890,43680,43530
Trade Safe & Happy Trading Guys
This is only for educational purpose so TAKE YOUR OWN RISK REWARD

BANK NIFTY ANALYSIS - 24/05/2023BUY ABOVE - 43970
SL - 43860
TARGETS - 44080,44250,44400
SELL BELOW - 43860
SL - 43970
TARGETS - 43680,43530,43360
Trade Safe & Happy Trading Guys
This is only for educational purpose so TAKE YOUR OWN RISK REWARD

BANK NIFTY - 23/05/2023BUY ABOVE - 44000
SL - 43890
TARGETS - 44150,44250,44400
SELL BELOW - 43680
SL - 43780
TARGETS - 43530,43360,43170
Trade Safe & Happy Trading Guys
This is only for educational purpose so TAKE YOUR OWN RISK REWARD

BANK NIFTY ANALYSIS - 19/05/2023BUY ABOVE - 43890
SL - 43770
TARGETS - 44080,44150,44250
SELL BELOW - 43600
SL - 43700
TARGETS - 43530,43360,43170
Trade Safe & Happy Trading Guys
This is only for educational purpose so TAKE YOUR OWN RISK REWARD


NIFTY ANALYSIS - 10/05/2023BUY ABOVE - 18290
SL - 18250
TARGETS - 18350,18400,18450
SELL BELOW - 18250
SL - 18290
TARGETS - 18220,18170,18130
Trade Safe & Happy Trading Guys
This is only for educational purpose so TAKE YOUR OWN RISK REWARD

BANK NIFTY ANALYSIS - 27/04/2023BUY ABOVE - 42860
SL - 42800
TARGETS - 43000,43100,43260
SELL BELOW - 42800
SL - 42860
TARGETS - 42700,42600,42440
Trade Safe & Happy Trading Guys
This is only for educational purpose so TAKE YOUR OWN RISK REWARD

NIFTY ANALYSIS - 21/04/2023BUY ABOVE - 17660
SL - 17640
TARGETS - 17745,17820,17900
SELL BELOW - 17580
SL - 17640
TARGETS - 17500,17410,17310
Trade Safe & Happy Trading Guys
This is only for educational purpose so TAKE YOUR OWN RISK REWARD
