Day Trading Nifty 22240 Break Triggered a Sell-15th May ’24 Below mentioned points are discussed in my post analysis video(Fast forward to 0:33 for Hindi Audio)
-No Trades in the morning
-NO Volumes in nifty before 10
-22240 Break Triggered a Sell
-How will i trade when market opens tom
Intraday

BANK NIFTY INTRADAY LEVELS FOR 15/05/2024BUY ABOVE - 47900
SL - 47730
TARGETS - 48050,48220,48460
SELL BELOW - 47730
SL - 47900
TARGETS - 47560,47400,47200
NO TRADE ZONE - 47730 to 47900
Previous Day High - 47900
Previous Day Low - 47570
Based on price action major support & resistance's are here, the red lines acts as resistances, the green lines acts as supports. If the price breaks the support/resistance, it will move to the next support/resistance line. White lines indicates previous day high & low, high acts as a resistance & low acts as a support for next day.
Trendlines are also significant to price action. If the price is above/below the trendlines, can expect an UP/DOWN with aggressive move.
Please NOTE: this levels are for intraday trading only.
Disclaimer - All information on this page is for educational purposes only,
we are not SEBI Registered, Please consult a SEBI registered financial advisor for your financial matters before investing And taking any decision. We are not responsible for any profit/loss you made.
Request your support and engagement by liking and commenting & follow to provide encouragement
HAPPY TRADING 👍

NIFTY INTRADAY LEVELS FOR 15/05/2024BUY ABOVE - 22300
SL - 22220
TARGETS - 22350,22420,22470
SELL BELOW - 22180
SL - 22220
TARGETS - 22130,22070,22020
NO TRADE ZONE - 22180 to 22270
Previous Day High - 22270
Previous Day Low - 22070
Based on price action major support & resistance's are here, the red lines acts as resistances, the green lines acts as supports. If the price breaks the support/resistance, it will move to the next support/resistance line. White lines indicates previous day high & low, high acts as a resistance & low acts as a support for next day.
Trendlines are also significant to price action. If the price is above/below the trendlines, can expect an UP/DOWN with aggressive move.
Please NOTE: this levels are for intraday trading only.
Disclaimer - All information on this page is for educational purposes only,
we are not SEBI Registered, Please consult a SEBI registered financial advisor for your financial matters before investing And taking any decision. We are not responsible for any profit/loss you made.
Request your support and engagement by liking and commenting & follow to provide encouragement
HAPPY TRADING 👍

Day Trading Nifty- Scalp sold Nifty around VWAP 14th May ’24 Below mentioned points are discussed in my post analysis video(Fast forward to 0:24 for Hindi Audio)
-No Trades in the morning
-Nifty Had poor volumes before 10
-Day Trading Nifty - Scalp sold Nifty around vwap;SL Hit
-How will i trade when market opens tom

I've gone long in Cipla#Educational purpose only
I think the first hourly candle made yesterday is strong and the low won't be broken. I have explained my analyses in the video and I hope this helps.

BANK NIFTY INTRADAY LEVELS FOR 14 MAY 2024BUY ABOVE - 47900
SL - 47730
TARGETS - 48050,48220,48460
SELL BELOW - 47730
SL - 47900
TARGETS - 47560,47400,47200
NO TRADE ZONE - 47730 to 47900
Previous Day High - 47900
Previous Day Low - 47000
Based on price action major support & resistance's are here, the red lines acts as resistances, the green lines acts as supports. If the price breaks the support/resistance, it will move to the next support/resistance line. White lines indicates previous day high & low, high acts as a resistance & low acts as a support for next day.
Trendlines are also significant to price action. If the price is above/below the trendlines, can expect an UP/DOWN with aggressive move.
Please NOTE: this levels are for intraday trading only.
Disclaimer - All information on this page is for educational purposes only,
we are not SEBI Registered, Please consult a SEBI registered financial advisor for your financial matters before investing And taking any decision. We are not responsible for any profit/loss you made.
Request your support and engagement by liking and commenting & follow to provide encouragement
HAPPY TRADING 👍

NIFTY INTRADAY LEVELS FOR 14 MAY 2024BUY ABOVE - 22130
SL - 22070
TARGETS - 22180,22240,22300
SELL BELOW - 22070
SL - 22130
TARGETS - 22020,21960,21900
NO TRADE ZONE - 22070 to 22130
Previous Day High - 22130
Previous Day Low - 21820
Based on price action major support & resistance's are here, the red lines acts as resistances, the green lines acts as supports. If the price breaks the support/resistance, it will move to the next support/resistance line. White lines indicates previous day high & low, high acts as a resistance & low acts as a support for next day.
Trendlines are also significant to price action. If the price is above/below the trendlines, can expect an UP/DOWN with aggressive move.
Please NOTE: this levels are for intraday trading only.
Disclaimer - All information on this page is for educational purposes only,
we are not SEBI Registered, Please consult a SEBI registered financial advisor for your financial matters before investing And taking any decision. We are not responsible for any profit/loss you made.
Request your support and engagement by liking and commenting & follow to provide encouragement
HAPPY TRADING 👍

Day Trading Nifty-Bought Twice-13th May ’24Below mentioned points are discussed in my post analysis video(Fast forward to 0:41 for Hindi Audio)
-No Trades in the morning
-Good Sell Volumes in nifty before 10
-Day Trading Nifty-Bought Twice;
-How will i trade when market opens tom

BANK NIFTY INTRADAY LEVELS FOR 13/05/2024BUY ABOVE - 47560
SL - 47400
TARGETS - 47730,47900,48050
SELL BELOW - 47400
SL - 47560
TARGETS - 47200,47000,46800
NO TRADE ZONE - 47400 to 47560
Previous Day High - 47900
Previous Day Low - 47400
Based on price action major support & resistance's are here, the red lines acts as resistances, the green lines acts as supports. If the price breaks the support/resistance, it will move to the next support/resistance line. White lines indicates previous day high & low, high acts as a resistance & low acts as a support for next day.
Trendlines are also significant to price action. If the price is above/below the trendlines, can expect an UP/DOWN with aggressive move.
Please NOTE: this levels are for intraday trading only.
Disclaimer - All information on this page is for educational purposes only,
we are not SEBI Registered, Please consult a SEBI registered financial advisor for your financial matters before investing And taking any decision. We are not responsible for any profit/loss you made.
Request your support and engagement by liking and commenting & follow to provide encouragement
HAPPY TRADING 👍

NIFTY INTRADAY LEVELS FOR 13/05/2024BUY ABOVE - 22070
SL - 22020
TARGETS - 22120,22180,22240
SELL BELOW - 22020
SL - 22070
TARGETS - 21960,21900,21850
NO TRADE ZONE - 22020 to 22070
Previous Day High - 22120
Previous Day Low - 21960
Based on price action major support & resistance's are here, the red lines acts as resistances, the green lines acts as supports. If the price breaks the support/resistance, it will move to the next support/resistance line. White lines indicates previous day high & low, high acts as a resistance & low acts as a support for next day.
Trendlines are also significant to price action. If the price is above/below the trendlines, can expect an UP/DOWN with aggressive move.
Please NOTE: this levels are for intraday trading only.
Disclaimer - All information on this page is for educational purposes only,
we are not SEBI Registered, Please consult a SEBI registered financial advisor for your financial matters before investing And taking any decision. We are not responsible for any profit/loss you made.
Request your support and engagement by liking and commenting & follow to provide encouragement
HAPPY TRADING 👍

Day Trading Nifty-Scalped Sold Around Vwap-10th May ’24Below mentioned points are discussed in my post analysis video(Fast forward to 0:36 for Hindi Audio)
-No Trades in the morning
-Nifty had Buy volumes in the morning
-Scalped Sold Around Vwap;Same Structure as yesterday!
-How will i trade when market opens tom

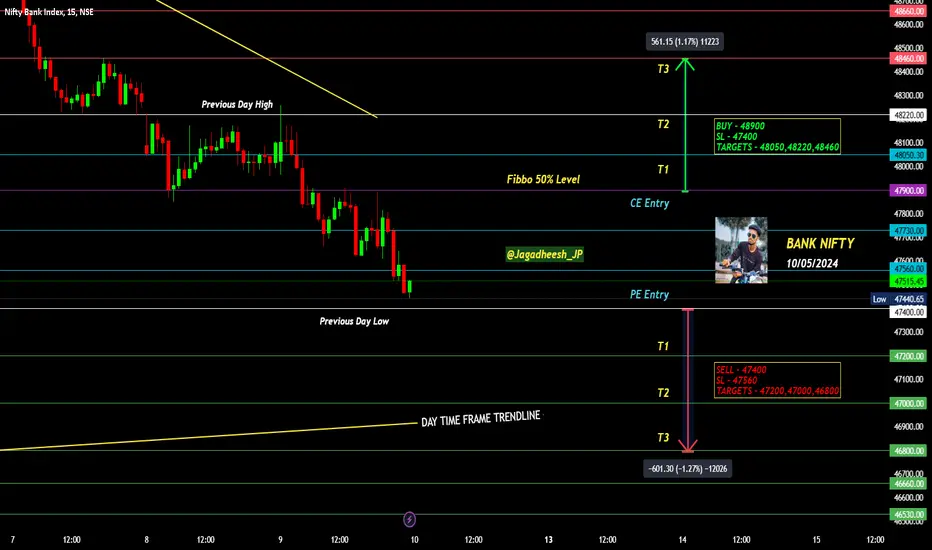
BANK NIFTY INTRADAY LEVELS FOR 10/05/2024BUY ABOVE - 48900
SL - 47400
TARGETS - 48050,48220,48460
SELL BELOW - 47400
SL - 47560
TARGETS - 47200,47000,46800
NO TRADE ZONE - 47400 to 47900
Previous Day High - 48220
Previous Day Low - 47400
Based on price action major support & resistance's are here, the red lines acts as resistances, the green lines acts as supports. If the price breaks the support/resistance, it will move to the next support/resistance line. White lines indicates previous day high & low, high acts as a resistance & low acts as a support for next day.
Trendlines are also significant to price action. If the price is above/below the trendlines, can expect an UP/DOWN with aggressive move.
Please NOTE: this levels are for intraday trading only.
Disclaimer - All information on this page is for educational purposes only,
we are not SEBI Registered, Please consult a SEBI registered financial advisor for your financial matters before investing And taking any decision. We are not responsible for any profit/loss you made.
Request your support and engagement by liking and commenting & follow to provide encouragement
HAPPY TRADING 👍
NIFTY INTRADAY LEVELS FOR 10/05/2024BUY ABOVE - 22070
SL - 22020
TARGETS - 22120,22180,22240
SELL BELOW - 21960
SL - 22020
TARGETS - 21900,21850,21800
NO TRADE ZONE - 21960 to 22070
Previous Day High - 22300
Previous Day Low - 21960
Based on price action major support & resistance's are here, the red lines acts as resistances, the green lines acts as supports. If the price breaks the support/resistance, it will move to the next support/resistance line. White lines indicates previous day high & low, high acts as a resistance & low acts as a support for next day.
Trendlines are also significant to price action. If the price is above/below the trendlines, can expect an UP/DOWN with aggressive move.
Please NOTE: this levels are for intraday trading only.
Disclaimer - All information on this page is for educational purposes only,
we are not SEBI Registered, Please consult a SEBI registered financial advisor for your financial matters before investing And taking any decision. We are not responsible for any profit/loss you made.
Request your support and engagement by liking and commenting & follow to provide encouragement
HAPPY TRADING 👍

#IDEA long trade setup intraday (09/05/24)Greetings Folks,
today I have prepared a setup of
NSE:IDEA on NSE
the analysis is as follows-
- marked an important support zone in higher timeframe
- price tapped in it and respected the support zone
- in lower timeframe , there is a ranged structure
speculating that nifty might move in up direction, we can plan a small counter trade
don't play with fire, always use a predefined stoploss

Day Trading Nifty - Sold & Bought Near Prev Day Low 9th May ’24 Below mentioned points are discussed in my post analysis video(Fast forward to 0:36 for Hindi Audio)
-No Trades in the morning
-No Volumes in nifty before 10
-Sold & Bought Near Prev Day Low!
-How will i trade when market opens tom

GOLD (XAUUSD) - IntradaySet the Sell Pending Orders at:
R1: 2329.847 (SL: 2334.847 | TP: 2319.847 )
R2: 2352.639 (SL: 2357.639 | TP: 2332.639 )
Set the Buy Pending Orders at:
S1: 2305.000 (SL: 2300.000 | TP: 2315.000 )
S2: 2281.517 (SL: 2276.517 | TP: 2301.517)

SILVER (XAGUSD) - IntradaySet the Sell Pending Orders at:
R1: 27.72200 (SL: 27.82200 | TP: 27.52200 )
R2: 28.05900 (SL: 28.15900 | TP: 27.65900 )
Set the Buy Pending Orders at:
S1: 27.26500 (SL: 27.16500 | TP: 27.46500 )
S2: 26.98300 (SL: 26.88300 | TP: 27.38300)

EURUSD 9 May 2024 W19 - Intraday Analysis - US Jobless ClaimsThis is my Intraday analysis on EURUSD for 9 May 2024 W19 based on Smart Money Concept (SMC) which includes the following:
Market Sentiment
4H Chart Analysis
15m Chart Analysis
Market Sentiment
Nothing changed since the start of the week and as per Tuesday sentiment, investors are waiting for a catalyst to have a clear policy direction for the upcoming quarter.
4H Chart Analysis
1.
Swing Bearish
Internal Bullish
Reached Swing EQ
INT Structure Pullback Phase
2.
Swing continuing bearish following the HTF Bearish Trend. Expectations is set for the Swing to stay bearish to fulfill the HTF targets.
3.
Nothing much changed since yesterday as we just tapping into a demand zone (FLIP) that may provide some bullish reaction.
INT Structure turned Bullish signaling a complex pullback phase with deep pullback that reached the Swing EQ and tapped into the Daily Supply.
Currently with INT Structure is Bullish we don't have a solid confirmation that the Swing PB is over and we will continue Bearish. Instead, INT structure could continue Bullish.
More Price development required from LTF in order to play the INT Structure PB or the INT structure Bullish continuation.
15m Chart Analysis
1.
Swing Bullish
Internal Bullish
Long : Phase B (LP)
Short : Phase C (HP)
2.
Finally we are barely out from Friday NFP Range and price still ranging with clear direction.
With a Bearish iBOS we confirmed the 15m Swing Pullback.
Currently price tapped and formed Bullish Sub-Internal Structure that is facilitating the INT Pullback.
Not convinced much of Longs as per our position in the HTF (Tapped into Daily Supply), instead will follow the Bearish INT Structure and look for Shorts from 15m Supply that are well positioned within the Swing.
3.
15m/4H Demand zones for possible longs one reached.

BANK NIFTY INTRADAY LEVELS FOR 09/05/2024BUY ABOVE - 48220
SL - 48050
TARGETS - 48460,48660,48800
SELL BELOW - 47900
SL - 48050
TARGETS - 47730,47560,47400
NO TRADE ZONE - 47900 to 48220
Previous Day High - 48220
Previous Day Low - 47900
Based on price action major support & resistance's are here, the red lines acts as resistances, the green lines acts as supports. If the price breaks the support/resistance, it will move to the next support/resistance line. White lines indicates previous day high & low, high acts as a resistance & low acts as a support for next day.
Trendlines are also significant to price action. If the price is above/below the trendlines, can expect an UP/DOWN with aggressive move.
Please NOTE: this levels are for intraday trading only.
Disclaimer - All information on this page is for educational purposes only,
we are not SEBI Registered, Please consult a SEBI registered financial advisor for your financial matters before investing And taking any decision. We are not responsible for any profit/loss you made.
Request your support and engagement by liking and commenting & follow to provide encouragement
HAPPY TRADING 👍

NIFTY INTRADAY LEVELS FOR 09/05/2024BUY ABOVE - 22350
SL - 22300
TARGETS - 22420,22470,22510
SELL BELOW - 22240
SL - 22300
TARGETS - 22200,22160,22100
NO TRADE ZONE - 22240 to 22350
Previous Day High - 22350
Previous Day Low - 22200
Based on price action major support & resistance's are here, the red lines acts as resistances, the green lines acts as supports. If the price breaks the support/resistance, it will move to the next support/resistance line. White lines indicates previous day high & low, high acts as a resistance & low acts as a support for next day.
Trendlines are also significant to price action. If the price is above/below the trendlines, can expect an UP/DOWN with aggressive move.
Please NOTE: this levels are for intraday trading only.
Disclaimer - All information on this page is for educational purposes only,
we are not SEBI Registered, Please consult a SEBI registered financial advisor for your financial matters before investing And taking any decision. We are not responsible for any profit/loss you made.
Request your support and engagement by liking and commenting & follow to provide encouragement
HAPPY TRADING 👍

EURUSD 8 May 2024 W19 - Intraday AnalysisThis is my Intraday analysis on EURUSD for 8 May 2024 W19 based on Smart Money Concept (SMC) which includes the following:
Market Sentiment
4H Chart Analysis
15m Chart Analysis
Market Sentiment
Nothing changed since the start of the week and as per yesterday sentiment here, investors are waiting for a catalyst to have a clear policy direction for the upcoming quarter.
4H Chart Analysis
1.
Swing Bearish
Internal Bullish
Reached Swing EQ
INT Structure Pullback Phase
2.
Swing continuing bearish following the HTF Bearish Trend. Expectations is set for the Swing to stay bearish to fulfill the HTF targets.
3.
Nothing much changed since yesterday as we just tapping into a demand zone (FLIP) that may provide some bullish reaction.
INT Structure turned Bullish signaling a complex pullback phase with deep pullback that reached the Swing EQ and tapped into the Daily Supply.
Currently with INT Structure is Bullish we don't have a solid confirmation that the Swing PB is over and we will continue Bearish. Instead, INT structure could continue Bullish.
More Price development required from LTF in order to play the INT Structure PB or the INT structure Bullish continuation.
15m Chart Analysis
1.
Swing Bullish
Internal Bullish
Long : Phase B (LP)
Short : Phase C (HP)
2.
Finally we are barely out from Friday NFP Range.
With a Bearish iBOS we confirmed the 15m Swing Pullback.
Currently price tapped into a 4H Demand which could initiate the INT Structure PB.
Bullish CHoCH will be the first sign that the INT PB is starting.
Not convinced much of Longs as per our position in the HTF (Tapped into Daily Supply), instead will follow the Bearish INT Structure and look for Shorts from 15m Supply that are well positioned within the Swing.
3.
15m/4H Demand zones for possible longs one reached.

BANK NIFTY INTRADAY LEVELS FOR 08/05/2024BUY ABOVE - 48460
SL - 48220
TARGETS - 48660,48800,48970
SELL BELOW - 48220
SL - 48460
TARGETS - 48120,47940,47730
NO TRADE ZONE - 48220 to 48460
Previous Day High - 49970
Previous Day Low - 48220
Based on price action major support & resistance's are here, the red lines acts as resistances, the green lines acts as supports. If the price breaks the support/resistance, it will move to the next support/resistance line. White lines indicates previous day high & low, high acts as a resistance & low acts as a support for next day.
Trendlines are also significant to price action. If the price is above/below the trendlines, can expect an UP/DOWN with aggressive move.
Please NOTE: this levels are for intraday trading only.
Disclaimer - All information on this page is for educational purposes only,
we are not SEBI Registered, Please consult a SEBI registered financial advisor for your financial matters before investing And taking any decision. We are not responsible for any profit/loss you made.
Request your support and engagement by liking and commenting & follow to provide encouragement
HAPPY TRADING 👍

NIFTY INTRADAY LEVELS FOR 08/05/2024BUY ABOVE - 22350
SL - 22300
TARGETS - 22420,22470,22510
SELL BELOW - 22240
SL - 22300
TARGETS - 22200,22160,22100
NO TRADE ZONE - 22240 to 22350
Previous Day High - 22510
Previous Day Low - 22240
Based on price action major support & resistance's are here, the red lines acts as resistances, the green lines acts as supports. If the price breaks the support/resistance, it will move to the next support/resistance line. White lines indicates previous day high & low, high acts as a resistance & low acts as a support for next day.
Trendlines are also significant to price action. If the price is above/below the trendlines, can expect an UP/DOWN with aggressive move.
Please NOTE: this levels are for intraday trading only.
Disclaimer - All information on this page is for educational purposes only,
we are not SEBI Registered, Please consult a SEBI registered financial advisor for your financial matters before investing And taking any decision. We are not responsible for any profit/loss you made.
Request your support and engagement by liking and commenting & follow to provide encouragement
HAPPY TRADING 👍
