EURUSD 12 Feb 2024 W7 - Intraday AnalysisThis is my Intraday analysis on EURUSD for 12 Feb 2024 W7 based on Smart Money Concept (SMC) which includes the following Time Frames:
4H
15m
4H Chart Analysis
1.
Swing Bullish
INT Bearish
OF Bearish
In Swing Discount / Possible LiQ Sweep
2.
Price made a bullish BOS and after a BOS we expect a pullback.
After mitigating the Weekly Supply zone, price started the Swing pullback phase after a bearish CHoCH.
Price reached the 4H/Daily demand zones as expected after breaking the range and formed a Bullish INT Structure iBOS.
This Bullish iBOS failed to continue Bullish and we changed to Bearish INT Structure which means that the Swing Pullback Phase is not over.
We are also within the 4H Swing Demand/Discount so keep in mind that at anytime the Swing Continuation could start.
More price development needed with the current PA.
3.
Bearish momentum still active with a Bearish iBOS.
With the current series of bearish INT Structures, there is a HP that the 4H Swing Low will go as there is no much demand zones and the current demand is fully mitigated and every move up is just a sell opportunity.
After the iBOS we would expect a pullback. Price failed to close below the 4H Low which could be a sweep of LIQ.
As per previous days analysis, i was waiting to see at least a bullish CHoCH in order to see a possibility of a Pullback of the 4H Bearish iBOS and the 4H Swing is still Holding.
From the Fractal CHoCHs happening after Sweeping the LiQ below the 4H Swing Low showing that demand in control.
We are currently in the Pullback Phase of the Bearish iBOS and expectations to continue Bullish till the INT Structure EQ and maybe extending to the INT Extreme Supply.
15m Chart Analysis
1.
Swing Bearish
INT Bullish
Pullback Phase
2.
INT Structure turned Bullish with iBOS confirming that the 15m Swing Pullback started as expected and we may have a deeper pullback.
After iBOS we expect a pullback which already started after a Bearish CHoCH.
As we didn't reach the Swing EQ or any HP POI we will have still the probability to continue up to maybe the 4H Supply Zone.
3.
As long we we respect the Bullish INT structure we are good to go up.
Once we have the Bearish iBOS, the narrative will be that the 15m Swing pullback is over and we will be looking to target the Weak Swing Low.
Intraday

BANK NIFTY INTRADAY LEVELS FOR 12/02/2024BUY ABOVE - 45730
SL - 45570
TARGETS - 46010,46200,46300
SELL BELOW - 45330
SL - 45570
TARGETS - 45110,44900,44610
NO TRADE ZONE - 45330 to 45730
Previous Day High - 45730
Previous Day Low - 44900
Based on price action major support & resistance's are here, the red lines acts as resistances, the green lines acts as supports. If the price breaks the support/resistance, it will move to the next support/resistance line. White lines indicates previous day high & low, high acts as a resistance & low acts as a support for next day.
Trendlines are also significant to price action. If the price is above/below the trendlines, can expect an UP/DOWN with aggressive move.
Please NOTE: this levels are for intraday trading only.
Disclaimer - All information on this page is for educational purposes only,
we are not SEBI Registered, Please consult a SEBI registered financial advisor for your financial matters before investing And taking any decision. We are not responsible for any profit/loss you made.
Request your support and engagement by liking and commenting & follow to provide encouragement
HAPPY TRADING 👍

NIFTY INTRADAY LEVELS FOR 12/02/2024BUY ABOVE - 21810
SL - 21770
TARGETS - 21860,21910,21970
SELL BELOW - 21730
SL - 21770
TARGETS - 21670,21580,21530
NO TRADE ZONE - 21730 to 21810
Previous Day High - 21810
Previous Day Low - 21670
Based on price action major support & resistance's are here, the red lines acts as resistances, the green lines acts as supports. If the price breaks the support/resistance, it will move to the next support/resistance line. White lines indicates previous day high & low, high acts as a resistance & low acts as a support for next day.
Trendlines are also significant to price action. If the price is above/below the trendlines, can expect an UP/DOWN with aggressive move.
Please NOTE: this levels are for intraday trading only.
Disclaimer - All information on this page is for educational purposes only,
we are not SEBI Registered, Please consult a SEBI registered financial advisor for your financial matters before investing And taking any decision. We are not responsible for any profit/loss you made.
Request your support and engagement by liking and commenting & follow to provide encouragement
HAPPY TRADING 👍

[INTRADAY] #BANKNIFTY PE & CE Levels(12/02/2024) Today will be gap up opening in BANKNIFTY. After opening if banknifty sustain above 45550 level then possible upside rally of 400-500 points upto 45950 level & this rally can extend another 400 points if market gives breakout 46050 level.Any Major downside only expected in case banknifty starts trading below 45450 level.

Crude on Monthly Support : Long entry.CRUDE on Monthly support, seems like holding it, safe traders may wait for trendline breakout, risky may enter with SL below support.
Levels on chart.
-View for education purpose only.
Saptarish Trading.

S&P 500 - INTRADAY LEVELS 09/02/2024BUY ABOVE - 5000
SL - 4990
TARGETS - 5015,5030,5045
SELL BELOW - 4985
SL - 4995
TARGETS - 4975,4958,4940
NO TRADE ZONE - 4985 to 5000
Previous Day High - 5000
Previous Day Low - 4985
Based on price action major support & resistance's are here, the red lines acts as resistances, the green lines acts as supports. If the price breaks the support/resistance, it will move to the next support/resistance line. White lines indicates previous day high & low, high acts as a resistance & low acts as a support for next day.
Trendlines are also significant to price action. If the price is above/below the trendlines, can expect an UP/DOWN with aggressive move.
Please NOTE: this levels are for intraday trading only.
Disclaimer - All information on this page is for educational purposes only,
we are not SEBI Registered, Please consult a SEBI registered financial advisor for your financial matters before investing And taking any decision. We are not responsible for any profit/loss you made.
Request your support and engagement by liking and commenting & follow to provide encouragement
HAPPY TRADING 👍

XAU/USD 09 Feb 2024 Intraday AnalysisH4 Analysis:
-> Swing: Bullish.
-> Internal Bearish.
-> Has reached EQ.
Price printed double bullish iBOS to confirm swing pullback phase is complete.
Currently internal structure remains bearish.
Expectation remains as H4 analysis dated 08/02/2024, for price to continue to trade bearish to target weak internal low.
H4 Chart:
M15 Analysis:
-> Swing: Bullish.
-> Internal: Bullish.
-> Sub-Internal: Bearish.
-> Has reached EQ.
Following swing BOS price very aggressively pushed to the upside.
Price printed a bullish iBOS where we are now in the pullback phase.
Sub-structure to internal structure, which is marked in red printed bullish iiBOS followed by a bearish iiBOS.
Price tapped into M15 POI (as shown on chart) where we saw a bullish reaction.
Intraday expectation remains the same. Price to target weak internal low at 2001.895
M15 Chart:

MISHTANN BUY 20.50-21.50 SL 17 TGT 27/34/40/50MISHTANN BUY 20.50-21.50 SL 17 TGT 27/34/40/50
7KInvest Ideas$$
DISCLAIMER: These videos are for educational purposes only. Investing of any kind involves risk. While it is possible to minimize risk, your investments are solely your responsibility. It is imperative that you conduct your own research. I am merely sharing my opinion with no guarantee of gains or losses on investments.

Rising Wedge breakdown in ULTRACEMCOULTRATECH CEMENT LTD
Key highlights: 💡⚡
✅On 3 HOUR Time Frame Stock Showing Breakdown of Rising Wedge Pattern .
✅Strong bearish Candlestick Form on this timeframe.
✅It can give movement up to the Breakdown target of 9326-.
✅Can Go short in this stock by placing a stop loss above 10082+.

EURUSD 9 Feb 2024 W6 - Intraday Analysis - US CPI RevisionsThis is my Intraday analysis on EURUSD for 9 Feb 2024 W6 based on Smart Money Concept (SMC) which includes the following Time Frames:
4H
15m
4H Chart Analysis
1.
Swing Bullish
INT Bearish
OF Bearish
In Swing Discount
2.
Price made a bullish BOS and after a BOS we expect a pullback.
After mitigating the Weekly Supply zone, price started the Swing pullback phase after a bearish CHoCH.
Price reached the 4H/Daily demand zones as expected after breaking the range and formed a Bullish INT Structure iBOS.
This Bullish iBOS failed to continue Bullish and we changed to Bearish INT Structure which means that the Swing Pullback Phase is not over.
We are also within the 4H Swing Demand/Discount so keep in mind that at anytime the Swing Continuation could start.
More price development needed with the current PA.
3.
Bearish momentum still active with a Bearish iBOS.
With the current series of bearish INT Structures, there is a HP that the 4H Swing Low will go as there is no much demand zones and the current demand is in mitigation and every move up is just a sell opportunity.
After the iBOS we would expect a pullback. Price failed to close below the 4H Low which could be a sweep of LIQ.
As per previous days analysis, i was waiting to see at least a bullish CHoCH in order to see a possibility of a Pullback of the 4H Bearish iBOS and the 4H Still Holding. We had formed this Bullish CHoCH yesterday and according to that we formed a fresh demand zone that could have the potential to provide a deeper pullback to the 4H iBOS and maybe the continuation on the 4H Bullish Swing.
And as i was waiting for the 15m to align bullish to play the 4H iBOS pullback if possible. The 15m aligned with the 4H expectations and we initialized the Pullback Phase for the 4H Bearish iBOS and the 15m Bearish Swing.
15m Chart Analysis
1.
Swing Bearish
INT Bearish
Pullback Phase
2.
INT Structure turned Bullish with iBOS confirming that the 15m Swing Pullback started as expected and we may have a deeper pullback.
After the Bullish iBOS we initiated the pullback of the INT Structure and reached the 4H Demand and we directly bounced back up.
We reached the 4H Supply where price is currently reacting.
3.
Mitigation of the 4H demand formed a 15m Demand. Not a HP demand for longs but it will provide a reaction if reached.
Wouldn't be much convinced to long from this demand again as i'm expecting the orders taken already from the 4H are enough to continue up and reach the Weak INT High.
If price reached that deep to this demand, my expectations that we will have a HP move to break the 15m Weak Swing Low.

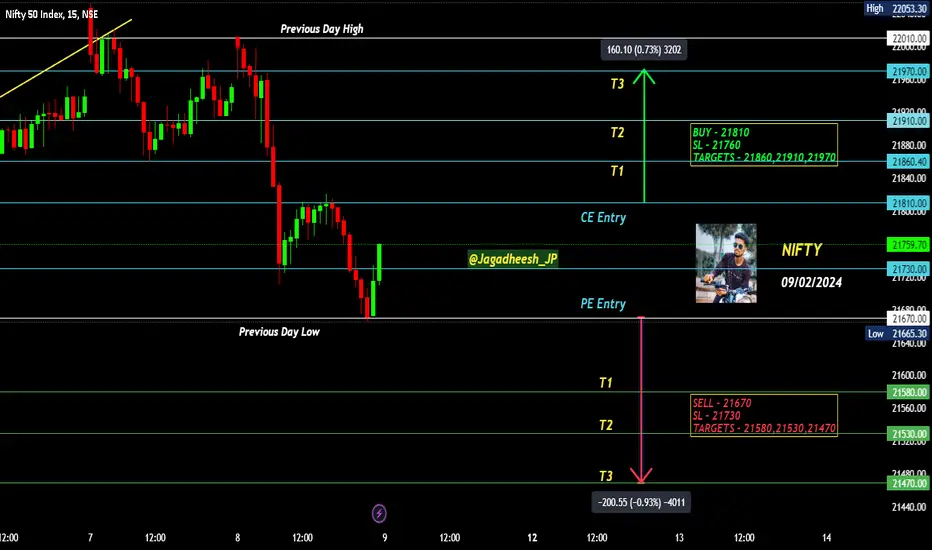
NIFTY INTRADAY LEVELS FOR 09/02/2024BUY ABOVE - 21810
SL - 21760
TARGETS - 21860,21910,21970
SELL BELOW - 21670
SL - 21730
TARGETS - 21580,21530,21470
NO TRADE ZONE - 21670 to 21810
Previous Day High - 22010
Previous Day Low - 21670
Based on price action major support & resistance's are here, the red lines acts as resistances, the green lines acts as supports. If the price breaks the support/resistance, it will move to the next support/resistance line. White lines indicates previous day high & low, high acts as a resistance & low acts as a support for next day.
Trendlines are also significant to price action. If the price is above/below the trendlines, can expect an UP/DOWN with aggressive move.
Please NOTE: this levels are for intraday trading only.
Disclaimer - All information on this page is for educational purposes only,
we are not SEBI Registered, Please consult a SEBI registered financial advisor for your financial matters before investing And taking any decision. We are not responsible for any profit/loss you made.
Request your support and engagement by liking and commenting & follow to provide encouragement
HAPPY TRADING 👍
#NIFTY Intraday Support and Resistance Levels -09/02/2024Nifty will be gap down opening in today's session. After opening nifty start trading below 21730 level and then possible downside rally up to 21610 in today's session. in case nifty trades above 21810 level then the upside target can go up to the 21930 level.

When the price stagnates and then breaks a lateral trend...It's been a while since I published an analysis with a 1h timeframe. Well, the price of btc created a lateral trend (from 30 sessions upwards), establishing two levels in which it moved for a week, then the breaking of one of the levels brought a resumption of the rise and an increase in directionality associated with volatility, with a break visible to all. In this case the upper level being the rectangle is a purely continuation figure, it acted as a cap for a while, now a scenario where the price goes to test the resistance area between 46k and 49k usd, becomes more likely the one to follow before determining whether the correction is finished. It has already given a sign of this by making a high breaking this lateral trend, because it also exceeded the previous movement which lasted 12 days in terms of time.

EURUSD 8 Feb 2024 W6 - Intraday Analysis - US Jobless ClaimsThis is my Intraday analysis on EURUSD for 8 Feb 2024 W6 based on Smart Money Concept (SMC) which includes the following Time Frames:
4H
15m
NOTE: Nothing had changed much since yesterday we just managed to reach the 15m INT High but we didn't close above it. So mostly still on my expectations of yesterday.
4H Chart Analysis
1.
Swing Bullish
INT Bearish
OF Bearish
In Swing Discount
2.
Price made a bullish BOS and after a BOS we expect a pullback.
After mitigating the Weekly Supply zone, price started the Swing pullback phase after a bearish CHoCH.
Price reached the 4H/Daily demand zones as expected after breaking the range and formed a Bullish INT Structure iBOS.
This Bullish iBOS failed to continue Bullish and we changed to Bearish INT Structure which means that the Swing Pullback Phase is not over.
We are also within the 4H Swing Demand/Discount so keep in mind that at anytime the Swing Continuation could start.
More price development needed with the current PA.
3.
Bearish momentum still active with a Bearish iBOS.
With the current series of bearish INT Structures, there is a HP that the 4H Swing Low will go as there is no much demand zones and the current demand is in mitigation and every move up is just a sell opportunity.
After the iBOS we would expect a pullback. Price failed to close below the 4H Low which could be a sweep of LIQ.
As per yesterday analysis, i was waiting to see at least a bullish CHoCH in order to see a possibility of a Pullback of the 4H Bearish iBOS and the 4H Still Holding. We had formed this Bullish CHoCH yesterday and according to that we formed a fresh demand zone that could have the potential to provide a deeper pullback to the 4H iBOS and maybe the continuation on the 4H Bullish Swing.
I'll be waiting 15m to align bullish to play the 4H iBOS pullback if possible. Other wise waiting for better Short opportunity from the 4H Supply at the INT High.
Lets wait for the LTF to guide us.
15m Chart Analysis
1.
Swing Bearish
INT Bearish
Waiting Pullback Phase
2.
Swing is Bearish and we are currently in the bearish momentum after the break.
Price reached the 4H Swing Low and the Daily INT Low and failed to close below for 2 times now (Just wicked micro pips below it). Could be a sweep of LIQ or just mitigation and continuation bearish. No HTF POI mitigation yet.
From a structure prospective, We are expecting a Pullback for the 15m Swing and the 4H INT Structure.
I'll wait for the pullback phase after the 15m Bullish iBOS putting in consideration that there is a HP that we can create a Bearish 4H BOS and Daily iBOS. (Shorting the lows or after Break of Structure is not my edge)
Lets wait and see more price development.
3.
15m INT Structure is bearish and we are in the continuation after the Swing BOS.
Price failed for the 2nd time to break the 4H Swing Low/Daily INT Low yesterday and formed a Bullish CHoCH on the 4H. With that CHoCH we created a 4H Demand (Not the most convincing zone but better than nothing :D)
Price had mitigated the 4H Supply and the Strong INT High held and price failed currently to break. But be mindful that there will be a Swing Pullback and it seems started and most probably we will have a Bullish iBOS and a deeper pullback.

SAIL BUY 128-29 SL 118 TGT 140/164/200SAIL BUY 128-29 SL 118 TGT 140/164/200
DISCLAIMER: These videos are for educational purposes only. Investing of any kind involves risk. While it is possible to minimize risk, your investments are solely your responsibility. It is imperative that you conduct your own research. I am merely sharing my opinion with no guarantee of gains or losses on investments.

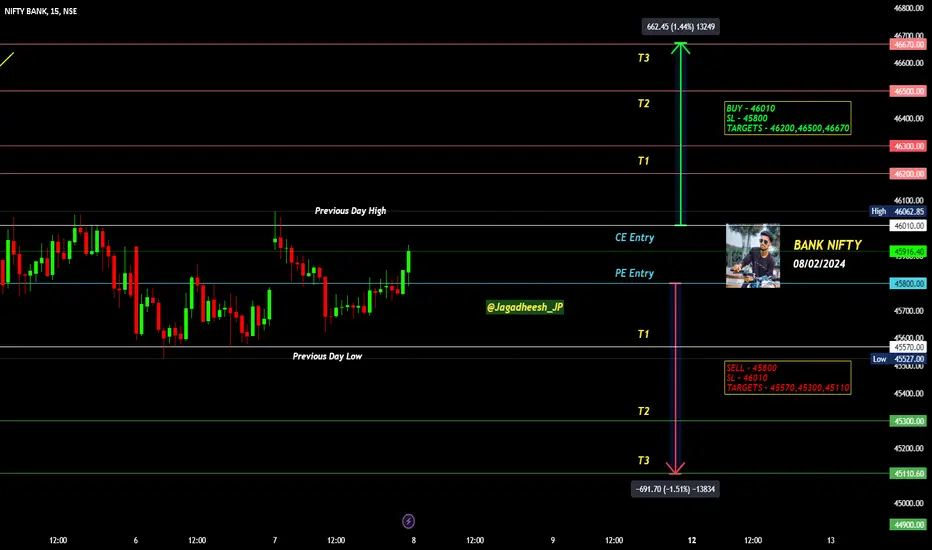
BANK NIFTY INTRADAY LEVELS FOR 08/02/2024BUY ABOVE - 46010
SL - 45800
TARGETS - 46200,46500,46670
SELL BELOW - 45800
SL - 46010
TARGETS - 45570,45300,45110
NO TRADE ZONE - 45800 to 46010
Previous Day High - 46010
Previous Day Low - 45570
Based on price action major support & resistance's are here, the red lines acts as resistances, the green lines acts as supports. If the price breaks the support/resistance, it will move to the next support/resistance line. White lines indicates previous day high & low, high acts as a resistance & low acts as a support for next day.
Trendlines are also significant to price action. If the price is above/below the trendlines, can expect an UP/DOWN with aggressive move.
Please NOTE: this levels are for intraday trading only.
Disclaimer - All information on this page is for educational purposes only,
we are not SEBI Registered, Please consult a SEBI registered financial advisor for your financial matters before investing And taking any decision. We are not responsible for any profit/loss you made.
Request your support and engagement by liking and commenting & follow to provide encouragement
HAPPY TRADING 👍
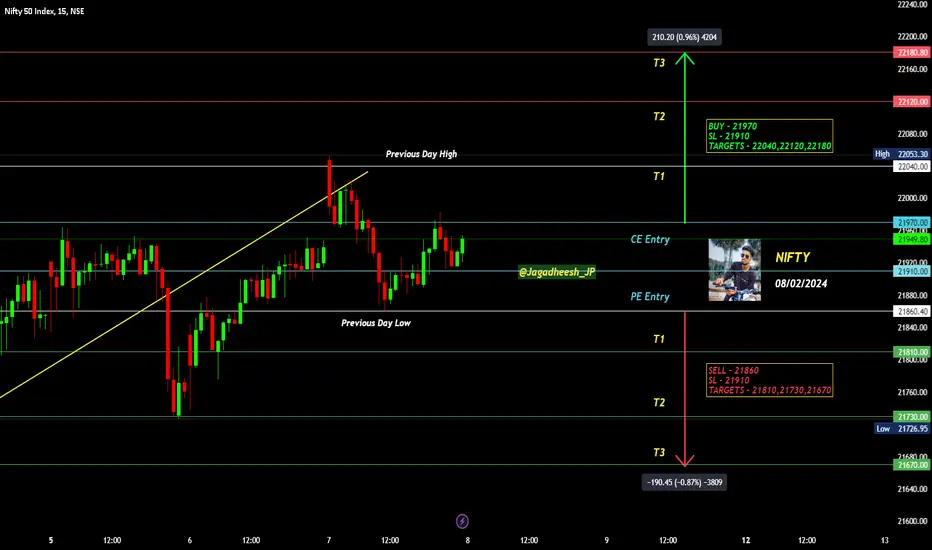
NIFTY INTRADAY LEVELS FOR 08/02/2024BUY ABOVE - 21970
SL - 21910
TARGETS - 22040,22120,22180
SELL BELOW - 21860
SL - 21910
TARGETS - 21810,21730,21670
NO TRADE ZONE - 21860 to 21970
Previous Day High - 22040
Previous Day Low - 21860
Based on price action major support & resistance's are here, the red lines acts as resistances, the green lines acts as supports. If the price breaks the support/resistance, it will move to the next support/resistance line. White lines indicates previous day high & low, high acts as a resistance & low acts as a support for next day.
Trendlines are also significant to price action. If the price is above/below the trendlines, can expect an UP/DOWN with aggressive move.
Please NOTE: this levels are for intraday trading only.
Disclaimer - All information on this page is for educational purposes only,
we are not SEBI Registered, Please consult a SEBI registered financial advisor for your financial matters before investing And taking any decision. We are not responsible for any profit/loss you made.
Request your support and engagement by liking and commenting & follow to provide encouragement
HAPPY TRADING 👍
[INTRADAY] #BANKNIFTY PE & CE Levels(08/02/2024) Today will be gap up opening in BANKNIFTY. After opening if banknifty sustain above 46050 level then possible upside rally of 400-500 points upto 46450 level.Any Major downside only expected in case banknifty starts trading below 45950 level.also possible reversal upside 45550 level.

XAU/USD 07 Fed 2024 Intraday AnalysisH4 Analysis:
-> Swing: Bullish.
-> Internal Bearish.
-> Has reached EQ.
Price printed double bullish iBOS to confirm swing pullback phase is complete.
Currently internal structure remains bearish.
Expectation remains as H4 analysis dated 06/02/2024, for price to continue to trade bearish to target weak internal low.
H4 Chart:
M15 Analysis:
-> Swing: Bullish.
-> Internal: Bullish.
-> Sub-Internal: Bullish.
-> Has reached EQ.
Following swing BOS price very aggressively pushed to the upside.
Price has printed a bullish iBOS where we are now in the pullback phase.
Sub-structure to internal structure, which is marked in red has now printed a bullish iiBOS.
Intraday expectation remains the same as 06/02/2024, for price to target weak internal high.
M15 Chart:

Reversal Broadening Wedge pattern in HDFCLIFEHDFC LIFE INSURANCE COMPANY LTD
Key highlights: 💡⚡
📈 On 1 Day Time Frame Stock Showing Reversal of Broadening Wedge Pattern.
📈 It can give movement upto the Reversal Final target of Above 717+.
📈 There have chances of breakout of Resistance level too.
📈 After breakout of Resistance level this stock can gives strong upside rally upto Above 860+.
📈 Can Go Long in this stock by placing a stop loss Below 511-.

EURUSD 7 Feb 2024 W6 - Intraday Analysis - US Trade BalanceThis is my Intraday analysis on EURUSD for 7 Feb 2024 W6 based on Smart Money Concept (SMC) which includes the following Time Frames:
4H
15m
4H Chart Analysis
1.
Swing Bullish
INT Bearish
OF Bearish
In Swing Discount
2.
Price made a bullish BOS and after a BOS we expect a pullback.
After mitigating the Weekly Supply zone, price started the Swing pullback phase after a bearish CHoCH.
Price reached the 4H/Daily demand zones as expected after breaking the range and formed a Bullish INT Structure iBOS.
This Bullish iBOS failed to continue Bullish and we changed to Bearish INT Structure which means that the Swing Pullback Phase is not over.
We are also within the 4H Swing Demand/Discount so keep in mind that at anytime the Swing Continuation could start.
More price development needed with the current PA.
3.
Bearish momentum still active with a Bearish iBOS.
With the current series of bearish INT Structures, there is a HP that the 4H Swing Low will go as there is no much demand zones and the current demand is in mitigation and every move up is just a sell opportunity.
After the iBOS we would expect a pullback. Price failed to close below the 4H Low which could be a sweep of LIQ.
As per yesterday analysis, i was waiting to see at least a bullish CHoCH in order to see a possibility of a Pullback of the 4H Bearish iBOS and the 4H Still Holding. We had formed this Bullish CHoCH yesterday and according to that we formed a fresh demand zone that could have the potential to provide a deeper pullback to the 4H iBOS and maybe the continuation on the 4H Bullish Swing.
I'll be waiting 15m to align bullish to play the 4H iBOS pullback if possible. Other wise waiting for better Short opportunity from the 4H Supply at the INT High.
Lets wait for the LTF to guide us.
15m Chart Analysis
1.
Swing Bearish
INT Bearish
Waiting Pullback Phase
2.
Swing is Bearish and we are currently in the bearish momentum after the break.
Price reached the 4H Swing Low and the Daily INT Low and failed to close below for 2 times now (Just wicked micro pips below it). Could be a sweep of LIQ or just mitigation and continuation bearish. No HTF POI mitigation yet.
From a structure prospective, We are expecting a Pullback for the 15m Swing and the 4H INT Structure.
I'll wait for the pullback phase after the 15m Bullish iBOS putting in consideration that there is a HP that we can create a Bearish 4H BOS and Daily iBOS. (Shorting the lows or after Break of Structure is not my edge)
Lets wait and see more price development.
3.
15m INT Structure is bearish and we are in the continuation after the Swing BOS.
Price failed for the 2nd time to break the 4H Swing Low/Daily INT Low yesterday and formed a Bullish CHoCH on the 4H. With that CHoCH we created a 4H Demand (Not the most convincing zone but better than nothing :D)
4H Supply within this INT Structure is the only supply that could provide a Bearish continuation. But be mindful that we could start also the Swing Pullback at anytime.

EURUSD I Intraday long from support Welcome back! Let me know your thoughts in the comments!
** EURUSD Analysis - Listen to video!
We recommend that you keep this pair on your watchlist and enter when the entry criteria of your strategy is met.
Please support this idea with a LIKE and COMMENT if you find it useful and Click "Follow" on our profile if you'd like these trade ideas delivered straight to your email in the future.
Thanks for your continued support!

Parallel Channel pattern breakout in MFSLMAX FINANCIAL SERV
Key highlights: 💡⚡
✅On 1Hour Time Frame Stock Showing Breakout of Parallel Channel Pattern.
✅Strong Bullish Candlestick Form on this timeframe.
✅It can give movement up to the Breakout target of 950+.
✅Can Go Long in this stock by placing a stop loss below 890-.
