EURUSD 17 Jan 2024 W3 - Intraday Analysis - US Retail/ EU CPIThis is my Intraday analysis on EURUSD for 17 Jan 2024 W3 based on Smart Money Concept (SMC) which includes the following Time Frames:
4H
15m
4H Chart Analysis
1.
Swing Bullish
INT Bearish
OF Bearish
In Discount
2.
Price made a bullish BOS and after a BOS we expect a pullback.
After mitigating the Weekly Supply zone, price started the Swing pullback phase after a bearish CHoCH.
Price reached the Swing EQ/Discount, mitigating 4H/Daily demand zones and ranged.
OF is bearish within the Swing Pullback phase signaling that we still looking for deeper pullback to the next Daily/4H Demand zones.
Current targets will be the Daily/4H demand zones and we can wait for price development on LTF to see if we will resume the Bullish Swing or not.
3.
Swing extreme demand for possible continuation to the upside.
15m Chart Analysis
1.
Swing Bearish
Internal Bearish
2.
Finally we are out of the range where the Swing turned bearish signaling the expectation that if the Swing turned bearish then the 4H is having a deep pullback phase within the 4H Bullish Swing.
After a BOS we expect a pullback phase to initiate and we will be looking for Bullish iBOS to confirm Swing Low and the initiation of the Swing pullback.
I'll be cautious that after range we were in the momentum will be aggressive and pullback may not happen directly and following the current INT structure will be the safe option.
3.
INT structure is continuing bearish and i would expect the continuation bearish till we reach the Daily/4H Demand zone as current targets.
No HP supply zone within the current INT structure as all are mitigated.
I'll be waiting for the next INT structure for Shorts if we didn't reach the Daily/4H Demand zones first.
Intraday

BANK NIFTY INTRADAY LEVELS FOR 17/01/2024BUY ABOVE - 48200
SL - 48050
TARGETS - 48310,48440,48620
SELL BELOW - 48050
SL - 48200
TARGETS - 47880,47750,47650
NO TRADE ZONE - 48050 to 48310
Previous Day High - 48250
Previous Day Low - 47880
Based on price action major support & resistance's are here, the red lines acts as resistances, the green lines acts as supports. If the price breaks the support/resistance, it will move to the next support/resistance line. White lines indicates previous day high & low, high acts as a resistance & low acts as a support for next day.
Trendlines are also significant to price action. If the price is above/below the trendlines, can expect an UP/DOWN with aggressive move.
Please NOTE: this levels are for intraday trading only.
Disclaimer - All information on this page is for educational purposes only,
we are not SEBI Registered, Please consult a SEBI registered financial advisor for your financial matters before investing And taking any decision. We are not responsible for any profit/loss you made.
Request your support and engagement by liking and commenting & follow to provide encouragement
HAPPY TRADING 👍

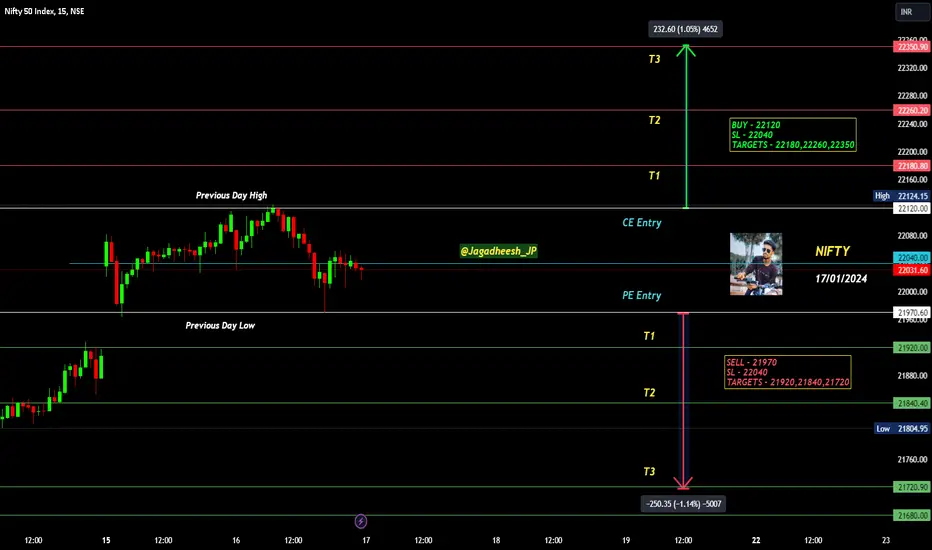
NIFTY INTRADAY LEVELS FOR 17/01/2024BUY - 22120
SL - 22040
TARGETS - 22180,22260,22350
SELL - 21970
SL - 22040
TARGETS - 21920,21840,21720
NO TRADE ZONE - 21970 to 22120
Previous Day High - 22120
Previous Day Low - 21970
Based on price action major support & resistance's are here, the red lines acts as resistances, the green lines acts as supports. If the price breaks the support/resistance, it will move to the next support/resistance line. White lines indicates previous day high & low, high acts as a resistance & low acts as a support for next day.
Trendlines are also significant to price action. If the price is above/below the trendlines, can expect an UP/DOWN with aggressive move.
Please NOTE: this levels are for intraday trading only.
Disclaimer - All information on this page is for educational purposes only,
we are not SEBI Registered, Please consult a SEBI registered financial advisor for your financial matters before investing And taking any decision. We are not responsible for any profit/loss you made.
Request your support and engagement by liking and commenting & follow to provide encouragement
HAPPY TRADING 👍
XAU/USD M15 Analysis 16 Jan 2024 Intraday-> Swing: Bullish.
-> Internal: Bullish.
-> Has reached EQ.
Following swing BOS price very aggressively pushed to the upside.
Currently price has printed a bullish iBOS where we are now in the pullback phase of the bullish iBOS.
Price has reacted at M15 POI's where we are now approaching internal EQ.
Expectation is for strong internal low to hold and react to H4 POI's

XAU/USD H4 ANALYSIS-> Swing: Bullish.
-> Internal Bearish.
-> Has reached EQ.
After the swing BOS price aggressively moved to the upside.
First structural sign of pullback initiation was the bearish iBOS. Price pulled back to beyond EQ where we saw reaction at POI's.
Price printed double bullish iBOS to confirm swing pullback phase is complete.
Currently internal structure is bearish. After iBOS we expect pullback which is underway
Price reached internal EQ and reacted at a POI.
Expectation is for price to target weak internal low.

EURUSD 16 Jan 2024 W3 - Intraday Analysis - German CPI/ZEWThis is my Intraday analysis on EURUSD for 16 Jan 2024 W3 based on Smart Money Concept (SMC) which includes the following Time Frames:
4H
15m
NOTE : Still price is ranging and i'm waiting for a break out of that range. Order flow on 4H is currently bearish within the INT Structure so my expectation is to stay bearish and may target the 15m Swing Low. A formation of Bearish Structure will indicate that the 4H Swing pullback is not yet done and we may have a deep pullback within the 4H Swing.
4H Chart Analysis
1.
Swing Bullish
INT Bullish
OF Bearish
Reached EQ
2.
Price made a bullish BOS and after a BOS we expect a pullback.
After mitigating the Weekly Supply zone, price started the Swing pullback phase after a bearish CHoCH.
Price reached the Swing EQ/Discount, mitigating 4H/Daily demand zones creating Bullish CHoCHs.
Still the OF is bearish within the Swing Pullback phase and the current PA is ranging, but as it's the pullback phase we would expect a Swing bullish continuation from current area or from the Swing extreme.
With the latest Bullish CHoCH, if the demand holds, we could see a Swing continuation to target the current INT High. If demand fails i would expect price continuing to the Swing extreme.
Lets wait for LTF confirmations and price development.
3.
Swing extreme demand for possible continuation to the upside.
15m Chart Analysis
1.
Swing Bullish
Internal Bullish
At Swing Extreme Low
2.
INT structure turned Bullish after mitigating the 4H demand zones and reaching the 15m Swing extreme.
The recent break (Fail to close below Swing Low) resulted with another iBOS and formed a 15m/4H Demand zone.
This demand is mitigated now and we are currently ranging.
3.
It's clear now that after NFP and CPI the market is in indecision phase and needs a catalyst to get out of the range.
For me price still Bullish until we have a Bearish Swing (Solid close below Swing Low)
I'll be waiting for more price development outside the range we are currently in.

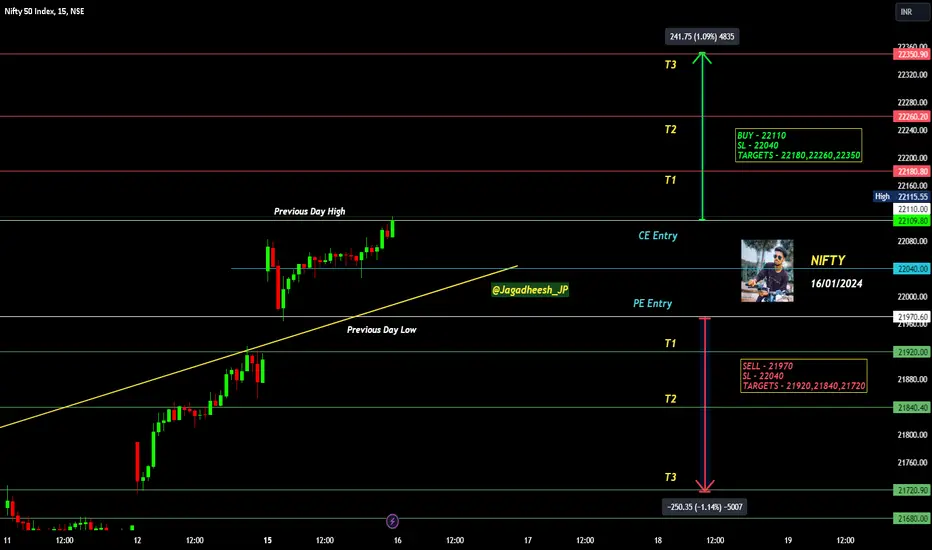
NIFTY INTRADAY LEVELS FOR 16/01/2024BUY - 22110
SL - 22040
TARGETS - 22180,22260,22350
SELL - 21970
SL - 22040
TARGETS - 21920,21840,21720
NO TRADE ZONE - 21970 to 22110
Previous Day High - 22110
Previous Day Low - 21970
Based on price action major support & resistance's are here, the red lines acts as resistances, the green lines acts as supports. If the price breaks the support/resistance, it will move to the next support/resistance line. White lines indicates previous day high & low, high acts as a resistance & low acts as a support for next day.
Trendlines are also significant to price action. If the price is above/below the trendlines, can expect an UP/DOWN with aggressive move.
Please NOTE: this levels are for intraday trading only.
Disclaimer - All information on this page is for educational purposes only,
we are not SEBI Registered, Please consult a SEBI registered financial advisor for your financial matters before investing And taking any decision. We are not responsible for any profit/loss you made.
Request your support and engagement by liking and commenting & follow to provide encouragement
HAPPY TRADING 👍
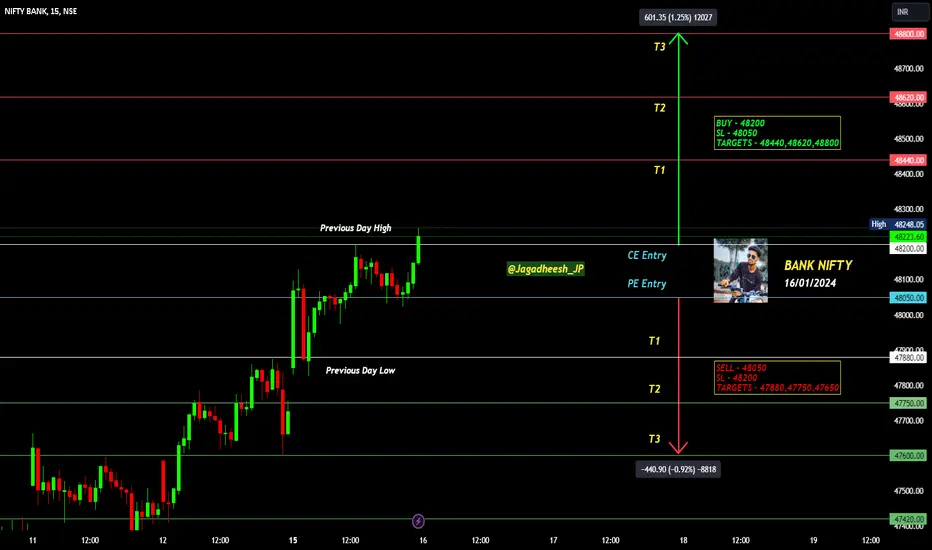
BANK NIFTY INTRADAY LEVELS FOR 16/01/2023BUY ABOVE - 48200
SL - 48050
TARGETS - 48440,48620,48800
SELL BELOW - 48050
SL - 48200
TARGETS - 47880,47750,47650
NO TRADE ZONE - 48050 to 48200
Previous Day High - 48250
Previous Day Low - 47880
Based on price action major support & resistance's are here, the red lines acts as resistances, the green lines acts as supports. If the price breaks the support/resistance, it will move to the next support/resistance line. White lines indicates previous day high & low, high acts as a resistance & low acts as a support for next day.
Trendlines are also significant to price action. If the price is above/below the trendlines, can expect an UP/DOWN with aggressive move.
Please NOTE: this levels are for intraday trading only.
Disclaimer - All information on this page is for educational purposes only,
we are not SEBI Registered, Please consult a SEBI registered financial advisor for your financial matters before investing And taking any decision. We are not responsible for any profit/loss you made.
Request your support and engagement by liking and commenting & follow to provide encouragement
HAPPY TRADING 👍
AUDUSDPrice is finally breaking through the range by making clear H's & L's, i would be waiting for Intraday Sell opportunities after the clean exhaustion on 1h TF and the target would be around 0.66520

USDJPY: decrease or increase in the new price week?Karina hello everyone!
The USD/JPY pair gained traction above the 145.00 mark during the early Asian session on Monday. The pair recovered despite the decline in the US Dollar. The market will likely have a quiet session amid the US bank holiday.
However, when considering technical trends and prospects:
USDJPY just broke the bullish Trendline and is in a corrective wave with betting resistance stopping the pair at 145,500.
The bears gained more advantage when the retracement exceeded the 0.5 Fibo level, showing that buying pressure has decreased a lot. If the 144,800 support level is broken, the bears will have more advantages in pushing the pair back to the 143,500 threshold.
And you, do you think USDJPY will increase or decrease in price?

EURUSD 15 Jan 2024 W3 - Intraday Analysis - US HolidayThis is my Intraday analysis on EURUSD for 15 Jan 2024 W3 based on Smart Money Concept (SMC) which includes the following Time Frames:
4H
15m
NOTE : No much development in price since NFP (2 Weeks). Can't see suitable option within that range knowing that it's a big range. But best is always wait for the setups that you are trained on and not to force a setup in current market behavior.
4H Chart Analysis
1.
Swing Bullish
INT Bullish
Reached EQ
2.
Price made a bullish BOS and after a BOS we expect a pullback.
After mitigating the Weekly Supply zone, price started the Swing pullback phase after a bearish CHoCH.
Price reached the Swing EQ/Discount, mitigating 4H/Daily demand zones creating Bullish CHoCHs.
Still the OF is bearish within the Swing Pullback phase and the current PA is ranging, but as it's the pullback phase we would expect a Swing bullish continuation from current area or from the Swing extreme.
With the latest Bullish CHoCH, if the demand holds, we could see a Swing continuation to target the current INT High. If demand fails i would expect price continuing to the Swing extreme.
Lets wait for LTF confirmations and price development.
3.
Swing extreme demand for possible continuation to the upside.
15m Chart Analysis
1.
Swing Bullish
Internal Bullish
At Swing Extreme Low
2.
INT structure turned Bullish after mitigating the 4H demand zones and reaching the 15m Swing extreme.
The recent break (Fail to close below Swing Low) resulted with another iBOS and formed a 15m/4H Demand zone.
This demand is mitigated now and we are currently ranging.
3.
It's clear now that after NFP and CPI the market is in indecision phase and needs a catalyst to get out of the range.
For me price still Bullish until we have a Bearish Swing (Solid close below Swing Low)
I'll be waiting for more price development outside the range we are currently in.

BANK NIFTY INTRADAY LEVELS FOR 15/01/2024BUY ABOVE - 47750
SL - 47600
TARGETS - 477880,48070,48200
SELL BELOW - 47600
SL - 47750
TARGETS - 47420,47230,47000
NO TRADE ZONE - 47600 to 47750
Previous Day High - 47880
Previous Day Low - 47230
I am sharing BANK NIFTY levels this levels acts as important support & resistance for intraday. if you want to trade with this levels wait for 15 min Candle closing above that levels. You can trade with breakout and reversal both.
In this channel, I share my expertise in trading strategies, technical analysis, and market trends to help you make informed decisions in your trading ventures.
Stay tuned for daily updates, in-depth market analyses, and real-time trading scenarios to witness firsthand how we transform from Zero to Hero in the trading world. My Only aim is to empower you with the knowledge and skills necessary to navigate the complexities of the financial markets successfully.
Based on price action major support & resistance's are here, the red lines acts as resistances, the green lines acts as supports. If the price breaks the support/resistance, it will move to the next support/resistance line. White lines indicates previous day high & low, high acts as a resistance & low acts as a support for next day.
Trendlines are also significant to price action. If the price is above/below the trendlines, can expect an UP/DOWN with aggressive move.
Please NOTE: this levels are for intraday trading only.
Disclaimer - All information on this page is for educational purposes only,
we are not SEBI Registered, Please consult a SEBI registered financial advisor for your financial matters before investing And taking any decision. We are not responsible for any profit/loss you made.
Request your support and engagement by liking and commenting & follow to provide encouragement
HAPPY TRADING 👍

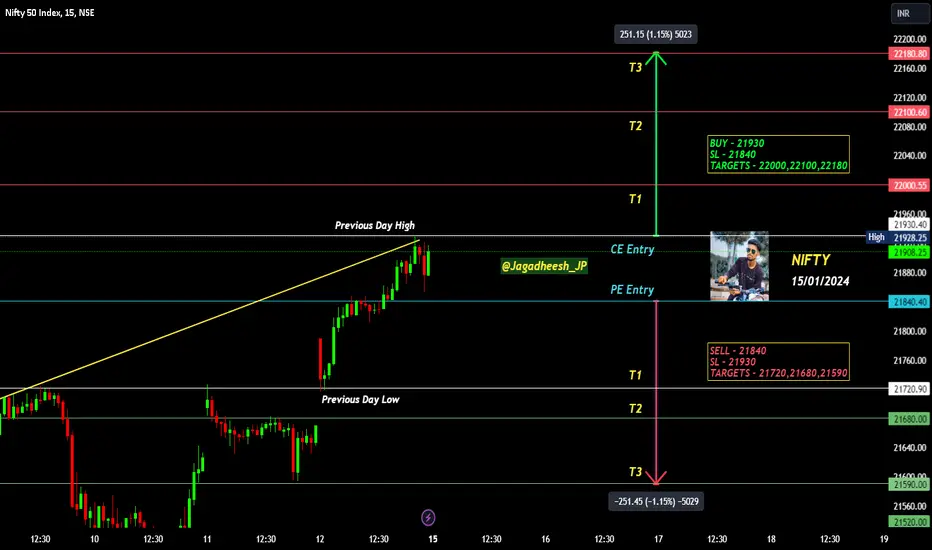
NIFTY INTRADAY LEVELS FOR 15/01/2024BUY ABOVE - 21930
SL - 21840
TARGETS - 22000,22100,22180
SELL BELOW - 21840
SL - 21930
TARGETS - 21720,21680,21590
NO TRADE ZONE - 21840 to 21930
Previous Day High - 21930
Previous Day Low - 21720
I am sharing NIFTY levels this levels acts as important support & resistance for intraday. if you want to trade with this levels wait for 15 min Candle closing above that levels. You can trade with breakout and reversal both.
In this channel, I share my expertise in trading strategies, technical analysis, and market trends to help you make informed decisions in your trading ventures.
Stay tuned for daily updates, in-depth market analyses, and real-time trading scenarios to witness firsthand how we transform from Zero to Hero in the trading world. My Only aim is to empower you with the knowledge and skills necessary to navigate the complexities of the financial markets successfully.
Based on price action major support & resistance's are here, the red lines acts as resistances, the green lines acts as supports. If the price breaks the support/resistance, it will move to the next support/resistance line. White lines indicates previous day high & low, high acts as a resistance & low acts as a support for next day.
Please NOTE: this levels are for intraday trading only.
Disclaimer - All information on this page is for educational purposes only,
we are not SEBI Registered, Please consult a SEBI registered financial advisor for your financial matters before investing And taking any decision. We are not responsible for any profit/loss you made.
Request your support and engagement by liking and commenting & follow to provide encouragement
HAPPY TRADING 👍
Breakout in Nifty
Observe the last two 15 minutes candle of the nifty chart. The second last candle was an indecesive candle with huge volume than the following last candle is a green opening morubozu with a greater volume than the previous candle, formation of the both candle is a bullish engulfing pattern.
As per the previous nifty analysis for longer time frame my view was bullish,view is still intact seeing the performance of nifty in previous daily session.
As of intraday I expect a gap-up tomorrow(15/01/2024) in this case i will wait for the price action to form opportunity and to present itself, other than this in case of of sideway opening or gap-down opening it would be best to wait for a retest of 21800-830 level or a breakout above previous week high.
NSE:NIFTY
Disclaimer- Just for educational purposes.

EURUSD 12 Jan 2024 W2 - Intraday Analysis - US PPI DayThis is my Intraday analysis on EURUSD for 12 Jan 2024 W2 based on Smart Money Concept (SMC) which includes the following Time Frames:
4H
15m
NOTE : Nothing changed much also yesterday even with CPI news. a whole ranging week and i wish we get out of that range today so we can have better opportunities next week. Wishing everyone a good weekend.
4H Chart Analysis
1.
Swing Bullish
INT Bullish
Reached EQ
2.
Price made a bullish BOS and after a BOS we expect a pullback.
After mitigating the Weekly Supply zone, price started the Swing pullback phase after a bearish CHoCH.
Price reached the Swing EQ/Discount, mitigating 4H/Daily demand zones creating Bullish CHoCHs.
Still the OF is bearish within the Swing Pullback phase and the current PA is ranging, but as it's the pullback phase we would expect a Swing bullish continuation from current area or from the Swing extreme.
With the latest Bullish CHoCH, if the demand holds, we could see a Swing continuation to target the current INT High. If it demand fails i would expect price continuing to the Swing extreme.
Lets wait for LTF confirmations and price development.
3.
Swing extreme demand for possible continuation to the upside.
15m Chart Analysis
1.
Swing Bullish
Internal Bullish
2.
INT structure turned Bullish after mitigating the 4H demand zones and reaching the 15m Swing extreme.
The recent break (Fail to close below Swing Low) resulted with another iBOS and formed a 15m/4H Demand zone.
This demand is mitigated now we are currently ranging.
For me it's clear now that market is waiting for CPI news today which will will provide us a clear view for next week.
3.
After CPI news yesterday, we pushed above range high (NFP High) which enabled me after to mark INT Structure high as we did a CHoCH.
Currently we still ranging inside the INT Structure. My Bias still Bullish till we see bearish Structures.

BANK NIFTY INTRADAY LEVELS FOR 12/01/2024BUY ABOVE - 47600
SL - 47420
TARGETS - 47780,47930,48070
SELL BELOW - 47420
SL - 47520
TARGETS - 47230,47000,46760
NO TRADE ZONE - 47420 to 47600
Previous Day High - 47600
Previous Day Low - 47230
I am sharing BANK NIFTY levels this levels acts as important support & resistance for intraday. if you want to trade with this levels wait for 15 min Candle closing above that levels. You can trade with breakout and reversal both.
In this channel, I share my expertise in trading strategies, technical analysis, and market trends to help you make informed decisions in your trading ventures.
Stay tuned for daily updates, in-depth market analyses, and real-time trading scenarios to witness firsthand how we transform from Zero to Hero in the trading world. My Only aim is to empower you with the knowledge and skills necessary to navigate the complexities of the financial markets successfully.
Based on price action major support & resistance's are here, the red lines acts as resistances, the green lines acts as supports. If the price breaks the support/resistance, it will move to the next support/resistance line. White lines indicates previous day high & low, high acts as a resistance & low acts as a support for next day.
Trendlines are also significant to price action. If the price is above/below the trendlines, can expect an UP/DOWN with aggressive move.
Please NOTE: this levels are for intraday trading only.
Disclaimer - All information on this page is for educational purposes only,
we are not SEBI Registered, Please consult a SEBI registered financial advisor for your financial matters before investing And taking any decision. We are not responsible for any profit/loss you made.
Request your support and engagement by liking and commenting & follow to provide encouragement
HAPPY TRADING 👍

NIFTY INTRADAY LEVELS FOR 12/01/2024BUY ABOVE - 21680
SL - 21630
TARGETS - 21750,21830,21930
SELL BELOW - 21590
SL - 21640
TARGETS - 21520,21450,21390
NO TRADE ZONE - 21590 to 21680
Previous Day High - 21720
Previous Day Low - 21590
I am sharing NIFTY levels this levels acts as important support & resistance for intraday. if you want to trade with this levels wait for 15 min Candle closing above that levels. You can trade with breakout and reversal both.
In this channel, I share my expertise in trading strategies, technical analysis, and market trends to help you make informed decisions in your trading ventures.
Stay tuned for daily updates, in-depth market analyses, and real-time trading scenarios to witness firsthand how we transform from Zero to Hero in the trading world. My Only aim is to empower you with the knowledge and skills necessary to navigate the complexities of the financial markets successfully.
Based on price action major support & resistance's are here, the red lines acts as resistances, the green lines acts as supports. If the price breaks the support/resistance, it will move to the next support/resistance line. White lines indicates previous day high & low, high acts as a resistance & low acts as a support for next day.
Please NOTE: this levels are for intraday trading only.
Disclaimer - All information on this page is for educational purposes only,
we are not SEBI Registered, Please consult a SEBI registered financial advisor for your financial matters before investing And taking any decision. We are not responsible for any profit/loss you made.
Request your support and engagement by liking and commenting & follow to provide encouragement
HAPPY TRADING 👍

EURUSD 11 Jan 2024 W2 - Intraday Analysis - US CPI DayThis is my Intraday analysis on EURUSD for 11 Jan 2024 W2 based on Smart Money Concept (SMC) which includes the following Time Frames:
4H
15m
NOTE : Nothing changed since yesterday too, price still ranging since last Friday NFP and market waiting US CPI Today.
4H Chart Analysis
1.
Swing Bullish
INT Bullish
Reached EQ
2.
Price made a bullish BOS and after a BOS we expect a pullback.
After mitigating the Weekly Supply zone, price started the Swing pullback phase after a bearish CHoCH.
Price reached the Swing EQ/Discount, mitigating 4H/Daily demand zones creating Bullish CHoCHs.
Still the OF is bearish within the Swing Pullback phase and the current PA is ranging, but as it's the pullback phase we would expect a Swing bullish continuation from current area or from the Swing extreme.
With the latest Bullish CHoCH, if the demand holds, we could see a Swing continuation to target the current INT High. If it demand fails i would expect price continuing to the Swing extreme.
Lets wait for LTF confirmations and price development.
3.
Swing extreme demand for possible continuation to the upside.
15m Chart Analysis
1.
Swing Bullish
Internal Bullish
At Swing Extreme Low
2.
INT structure turned Bullish after mitigating the 4H demand zones and reaching the 15m Swing extreme.
The recent break (Fail to close below Swing Low) resulted with another iBOS and formed a 15m/4H Demand zone.
This demand is mitigated now and we are currently ranging.
For me it's clear now that market is waiting for CPI news today which will will provide us a clear view for next week.

[INTRADAY] #BANKNIFTY PE & CE Levels (11/01/2024) Today will be gap up opening in BANKNIFTY. After opening if banknifty sustain above 47550 level then possible upside rally of 400-500 points upto 47950 level. Any Major downside only expected in case banknifty starts trading below 47450 level.

BANK NIFTY INTRADAY LEVELS FOR 11/01/2024BUY ABOVE - 47420
SL - 47200
TARGETS - 47600,47780,47930
SELL BELOW - 47200
SL - 47420
TARGETS - 47000,46760,46500
NO TRADE ZONE - 47200 to 47420
Previous Day High - 47420
Previous Day Low - 47000
I am sharing BANK NIFTY levels this levels acts as important support & resistance for intraday. if you want to trade with this levels wait for 15 min Candle closing above that levels. You can trade with breakout and reversal both.
In this channel, I share my expertise in trading strategies, technical analysis, and market trends to help you make informed decisions in your trading ventures.
Stay tuned for daily updates, in-depth market analyses, and real-time trading scenarios to witness firsthand how we transform from Zero to Hero in the trading world. My Only aim is to empower you with the knowledge and skills necessary to navigate the complexities of the financial markets successfully.
Based on price action major support & resistance's are here, the red lines acts as resistances, the green lines acts as supports. If the price breaks the support/resistance, it will move to the next support/resistance line. White lines indicates previous day high & low, high acts as a resistance & low acts as a support for next day.
Trendlines are also significant to price action. If the price is above/below the trendlines, can expect an UP/DOWN with aggressive move.
Please NOTE: this levels are for intraday trading only.
Disclaimer - All information on this page is for educational purposes only,
we are not SEBI Registered, Please consult a SEBI registered financial advisor for your financial matters before investing And taking any decision. We are not responsible for any profit/loss you made.
Request your support and engagement by liking and commenting & follow to provide encouragement
HAPPY TRADING 👍

NIFTY INTRADAY LEVELS FOR 11/01/2024BUY ABOVE - 21630
SL - 21560
TARGETS - 21680,21750,21830
SELL BELOW - 21560
SL - 21630
TARGETS - 21500,21450,21390
NO TRADE ZONE - 21560 to 21630
Previous Day High - 21630
Previous Day Low - 21450
I am sharing NIFTY levels this levels acts as important support & resistance for intraday. if you want to trade with this levels wait for 15 min Candle closing above that levels. You can trade with breakout and reversal both.
In this channel, I share my expertise in trading strategies, technical analysis, and market trends to help you make informed decisions in your trading ventures.
Stay tuned for daily updates, in-depth market analyses, and real-time trading scenarios to witness firsthand how we transform from Zero to Hero in the trading world. My Only aim is to empower you with the knowledge and skills necessary to navigate the complexities of the financial markets successfully.
Based on price action major support & resistance's are here, the red lines acts as resistances, the green lines acts as supports. If the price breaks the support/resistance, it will move to the next support/resistance line. White lines indicates previous day high & low, high acts as a resistance & low acts as a support for next day.
Please NOTE: this levels are for intraday trading only.
Disclaimer - All information on this page is for educational purposes only,
we are not SEBI Registered, Please consult a SEBI registered financial advisor for your financial matters before investing And taking any decision. We are not responsible for any profit/loss you made.
Request your support and engagement by liking and commenting & follow to provide encouragement
HAPPY TRADING 👍

EURUSD 10 Jan 2024 W2 - Intraday Analysishis is my Intraday analysis on EURUSD for 10 Jan 2024 W2 based on Smart Money Concept (SMC) which includes the following Time Frames:
4H
15m
NOTE : Nothing changed since yesterday too, price still ranging since last Friday NFP and market waiting US CPI on Thursday
4H Chart Analysis
1.
Swing Bullish
INT Bullish
Reached EQ
2.
Price made a bullish BOS and after a BOS we expect a pullback.
After mitigating the Weekly Supply zone, price started the Swing pullback phase after a bearish CHoCH.
Price reached the Swing EQ/Discount, mitigating 4H/Daily demand zones creating Bullish CHoCHs.
Still the OF is bearish within the Swing Pullback phase and the current PA is ranging, but as it's the pullback phase we would expect a Swing bullish continuation from current area or from the Swing extreme.
With the latest Bullish CHoCH, if the demand holds, we could see a Swing continuation to target the current INT High. If it demand fails i would expect price continuing to the Swing extreme.
Lets wait for LTF confirmations and price development.
3.
Swing extreme demand for possible continuation to the upside.
15m Chart Analysis
1.
Swing Bullish
Internal Bullish
At Swing Extreme Low
2.
INT structure turned Bullish after mitigating the 4H demand zones and reaching the 15m Swing extreme.
The recent break (Fail to close below Swing Low) resulted with another iBOS and formed a 15m/4H Demand zone.
This demand is mitigated now and we are currently ranging.
For me it's clear now that market is waiting for CPI news tomorrow which will will provide us a clear view for next week.

BANK NIFTY INTRADAY LEVELS FOR 10/01/2024BUY ABOVE - 47420
SL - 47200
TARGETS - 47600,47780,47930
SELL BELOW - 47200
SL - 47360
TARGETS - 47000,46760,46500
NO TRADE ZONE - 47200 to 47420
Previous Day High - 47930
Previous Day Low - 47200
I am sharing BANK NIFTY levels this levels acts as important support & resistance for intraday. if you want to trade with this levels wait for 15 min Candle closing above that levels. You can trade with breakout and reversal both.
In this channel, I share my expertise in trading strategies, technical analysis, and market trends to help you make informed decisions in your trading ventures.
Stay tuned for daily updates, in-depth market analyses, and real-time trading scenarios to witness firsthand how we transform from Zero to Hero in the trading world. My Only aim is to empower you with the knowledge and skills necessary to navigate the complexities of the financial markets successfully.
Based on price action major support & resistance's are here, the red lines acts as resistances, the green lines acts as supports. If the price breaks the support/resistance, it will move to the next support/resistance line. White lines indicates previous day high & low, high acts as a resistance & low acts as a support for next day.
Trendlines are also significant to price action. If the price is above/below the trendlines, can expect an UP/DOWN with aggressive move.
Please NOTE: this levels are for intraday trading only.
Disclaimer - All information on this page is for educational purposes only,
we are not SEBI Registered, Please consult a SEBI registered financial advisor for your financial matters before investing And taking any decision. We are not responsible for any profit/loss you made.
Request your support and engagement by liking and commenting & follow to provide encouragement
HAPPY TRADING 👍
