USDJPY Possible BEARISH setup🚀 USDJPY UPDATE: Bearish Setup
Summary:
Analysing price action from yesterday, breakout from the Daily timeframe accumulation zone has materialized with strong conviction.
TRADE SETUP Metrics:
- Entry: ✅
- Stop loss - Above Resistance Zone
- Target 1: (R:R 1:2)🎯
- Target 2: (R:R 1:3)🎯
- Target 3: (R:R 1:4)🎯
Technical Anticipations:
- Price action to show a Bearish follow-through
- Resistance zone to hold
Position Management:
- partial profits secured at Target 1
- Stop loss adjusted to breakeven upon reaching Targets
- Full Exit at Target 3
LIKE or COMMENT if this idea sparks your interest, or share your thoughts below!
FOLLOW to keep up with fresh ideas.
Tidypips: "Keep It Clean, Trade Mean!"
Intradayanalysis
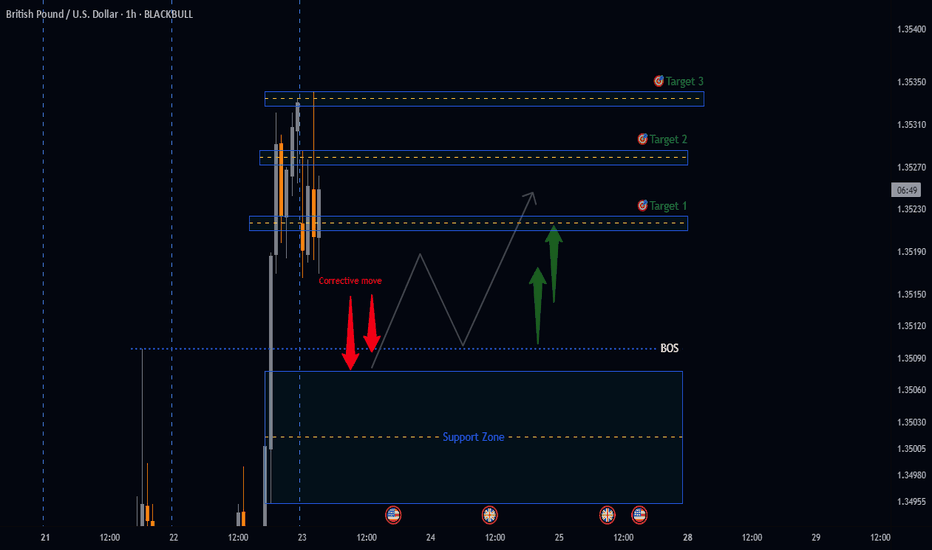
GBPUSD potential BULLISH Setup🚀 GBPUSD UPDATE: BULLISH Setup
Summary:
Analysing price action from yesterday, breakout from the Daily timeframe accumulation zone has materialized with strong conviction.
TRADE SETUP Metrics:
- Entry: ✅
- Stop loss - Below Support Zone
- Target 1: (R:R 1:2)🎯
- Target 2: (R:R 1:3)🎯
- Target 3: (R:R 1:4)🎯
Technical Anticipations:
- Price action to show a Bullish follow-through
- Support zone to hold
Position Management:
- partial profits secured at Target 1
- Stop loss adjusted to breakeven upon reaching Targets
- Final Target 3
LIKE or COMMENT if this idea sparks your interest, or share your thoughts below!
FOLLOW to keep up with fresh ideas.
Tidypips: "Keep It Clean, Trade Mean!"
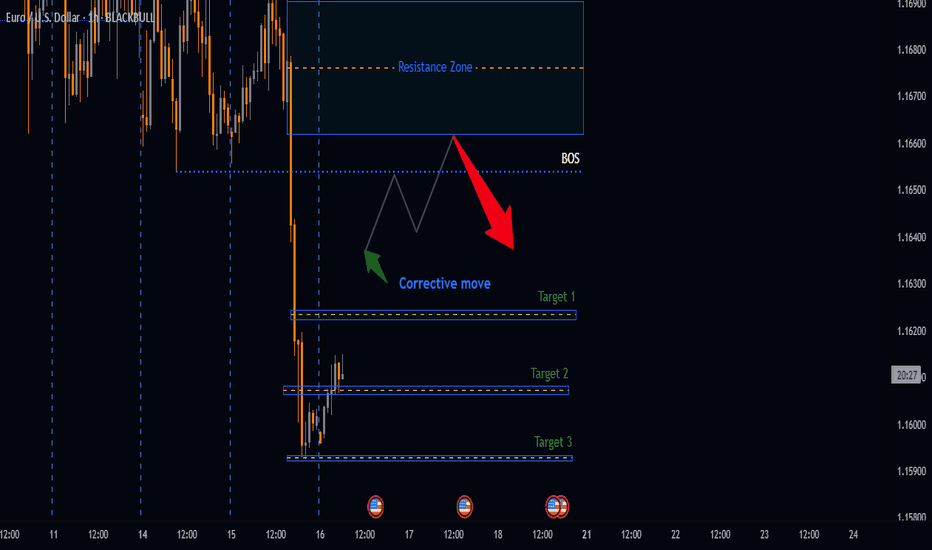
Potential Bearish Setup on EURUSDBearish Breakdown Setup
Summary
Analysing Price action from yesterday we have got a very nice distribution leg push that broke down below our accumulation zone a good indication of downside momentum, therefore the anticipation is that price will retest our BOS an ideal zone to look for bearish setups.
📉 EURUSD Daily Breakdown Potential setup
🔴 Distribution leg: 1.16921 - 1.15924
📉 Sell Below: 1.16540 (Confirmed Break)
🎯 Target 1: R:R 1:2
🎯 Target 2: R:R 1:3
🎯 Target 3: R:R 1:4
🛑 Stop Loss: Above Resistance Zone
🔍 Watch: Failure to break back in = Confirmation
LIKE or COMMENT if this idea sparks your interest, or share your thoughts below!
FOLLOW to keep up with fresh ideas.
Tidypips: "Keep It Clean, Trade Mean!"
XAU/USD 29 April 2024 Intraday AnalysisH4 Analysis:
-> Swing: Bullish.
-> Internal: Bullish.
Price has now printed a bullish iBOS aligned with swing structure.
Following the bullish iBOS we expect price to pullback.
As per yesterday's Intraday expectation, price had yet to confirm pullback initiation. First indication, but not confirmation was for price to print bearish CHoCH (*correction*, in yesterday's analysis I mentioned iBOS which should have been CHoCH). This would in-turn confirm internal structure.
Price has now printed a bearish CHoCH as per expectation.
Intraday expectation: Price to target weak internal high, however, all HTF's are requiring a pullback, therefore, price could potentially react at H4 POI.
H4 Chart:
M15 Analysis:
-> Swing: Bullish.
-> Internal: Bullish.
Price has printed a bullish iBOS.
Following bullish iBOS price is expected to pullback.
Price has printed a bearish CHoCH which is denoted with a blue dotted line. This indicates, but not confirms pullback initiation.
I have now mapped sub-internal structure to gain a micro-view of price action where price has printed a bullish CHoCH
Intraday expectation: Price to target weak internal high, however, caution at H4 POI as all HTF's require a pullback.
M15 Chart:
[INTRADAY] #BANKNIFTY PE & CE Levels (11/12/2023) Today will be gap down opening in BANKNIFTY . After opening if banknifty start trading below 46950 level then possible downside rally of 400-500 points upto 46550 Level. Any Major upside only expected in case banknifty starts trading above 47050 level & this rally can extend another 400 points if market gives breakout 47550 level.
Simple Intraday Anatomical Analysis of the SPY breakdownSo, last Friday the SPY was triggered for a hard down.
And on Monday, there was a gap down opening, marked out by the yellow box which shows the gap range. If the SPY closes above the yellow box, it is reversing trend to bounce upwards; however, if it closes below the yellow box, it reopened the gap and is heading for more downside.
Throughout the trading day, there was a clear attempt to close the Monday gap. And for less than an hour, the gap was closed, only to be promptly reopened. This formed the long overhead tails, that indicate selling, and the territory that the bears are winning. And then the day ended with with a nice down candle with a push down towards closing. Again, a bearish indication. The current issue is that it did not fully reopen the gap, meaning that there was no conclusive closure below the yellow box.
So at this point, it skews the favor slightly more towards the bearish side.
On the daily chart, the resulting candlestick formed is not very bearish (not red for a start) but is indicating through the long-ish tail at the top that some limited downside should be expected.
The Daily technical indicators follow through further into bearish territory.
So, here is the intra-day analysis of the SPY, pointing to a limited downside risk, not one to plunge like last Friday, but a likely lower low, especially after breaking below 402 (and 400 particularly).
It is going to be a very interesting week, especially to review on aday by day analysis... so much to learn of a breakdown anatomically part by part.
Take care!
IBULHSGFIN bullish breakout aheadThe Stock has been in a falling channel pattern and has also made a symmetrical triangle which is a continuation pattern but a triangle also means that the sellers are ready to sell low and buyers are ready to buy high and this results to consolidation and then a point of breakout.
Ibulhsgfin looks bullish to me, if it breaks both the triangle and the channel then we will see a good upmove for the targets marked above.
Buy Above - 254/Blue Line
MACD is BULLISH
RSI has room for BULLS
EMA are supportive
Please LIKE, COMMENT and SHARE to motivate and support me. I'll keep on posting new ideas on Indices & Stocks. Be sure to follow so that you don't miss any good trades that might have been rewarding.
Any comments and critiques will be appreciated even if it's of opposite view as a trader can also be right so many times.
USDCHF ShortTime Frame: 4H
Symbol: USDCHF
Bias: Short
USDCHF is trending short for a while. A minor adjustment is possible but the trend is down as the strength of the dollar is in a questionable position. Without a boost for dollar from influential market segments like commodity,labor and capital markets, a quick turning back is not possible. Let us see how dollar pairs against others.
US30 - Dow Jones - YM1! - H1 - Intraday Analysis -BUY 27800US30 - Dow Jones - YM1! - H1 - Intraday Analysis - BUY 27800
We have a Major bullish Trend on the Daily, H4 & H1 chart, price broke a Key Level 26500
Until this level holds we will be looking for Long entries until we have a bearish reversal signal.
We are waiting for a little correction on a key level 0.236 Fibonacci Extension Level before to enter Long.
Our first target will be the 0.618 Fibonacci Extension Level.
■■■■■■■■■■■■■■■■■■■■■■■■■■■■■■■■■■■■
Entry: 27325.00| Stoploss: 27175.00 | Takeprofit1: 27490.00 | Takeprofit2: 27800.00 |
■■■■■■■■■■■■■■■■■■■■■■■■■■■■■■■■■■■■
■■■■■■■■■■■■■■■■■■■■■■■■■■■■■■■■■■■■
If you like this idea please click the like button to support this channel, thanks.
■■■■■■■■■■■■■■■■■■■■■■■■■■■■■■■■■■■■■
Disclaimer: All information and ideas provided is for educational purposes only. It is not a recommendation to buy or sell.
■■■■■■■■■■■■■■■■■■■■■■■■■■■■■■■■■■■■■


