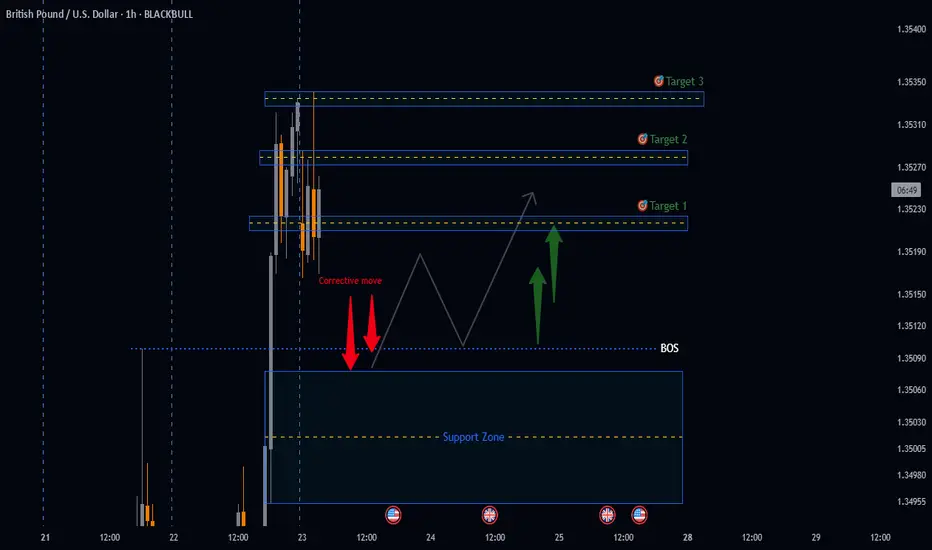
GBPUSD potential BULLISH Setup🚀 GBPUSD UPDATE: BULLISH Setup
Summary:
Analysing price action from yesterday, breakout from the Daily timeframe accumulation zone has materialized with strong conviction.
TRADE SETUP Metrics:
- Entry: ✅
- Stop loss - Below Support Zone
- Target 1: (R:R 1:2)🎯
- Target 2: (R:R 1:3)🎯
- Target 3: (R:R 1:4)🎯
Technical Anticipations:
- Price action to show a Bullish follow-through
- Support zone to hold
Position Management:
- partial profits secured at Target 1
- Stop loss adjusted to breakeven upon reaching Targets
- Final Target 3
LIKE or COMMENT if this idea sparks your interest, or share your thoughts below!
FOLLOW to keep up with fresh ideas.
Tidypips: "Keep It Clean, Trade Mean!"
Intradaysetup
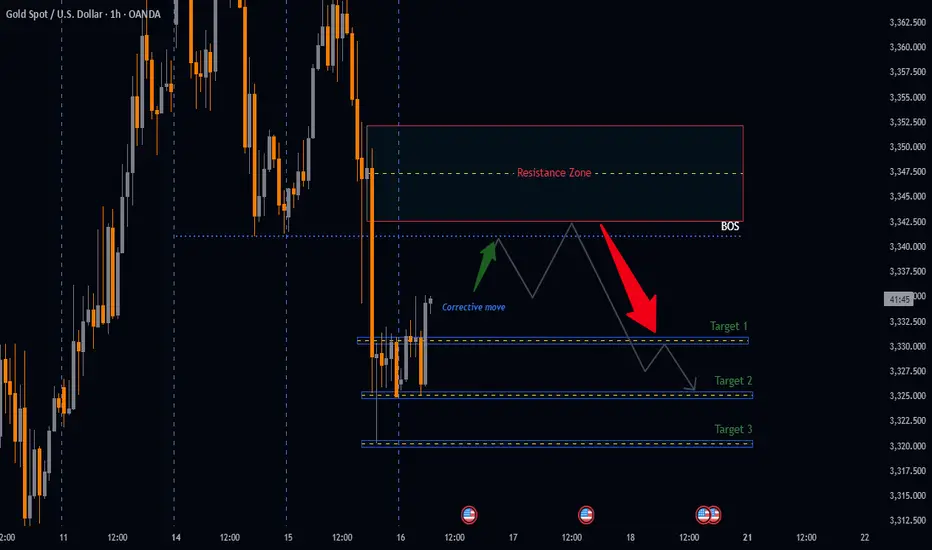
GOLD: A Bearish Trading SetupBearish Breakdown Setup
**Summary
Analysing Price action from yesterday we have got a very nice distribution leg push that broke down below our accumulation zone a good indication of downside momentum, therefore the anticipation is that price will retest our BOS an ideal zone to look for bearish setups.
📉 XAUUSD Daily Breakdown Potential setup
🔴 Distribution leg: 3366.425 - 3320.305
📉 Sell level: 3341 (BOS)
🎯 Target 1: R:R 1:2
🎯 Target 2: R:R 1:3
🎯 Target 3: R:R 1:4
🛑 Stop Loss: Above Resistance Zone
🔍 Watch: Failure to break back in = Confirmation
LIKE or COMMENT if this idea sparks your interest, or share your thoughts below!
FOLLOW to keep up with fresh ideas.
Tidypips: "Keep It Clean, Trade Mean!"
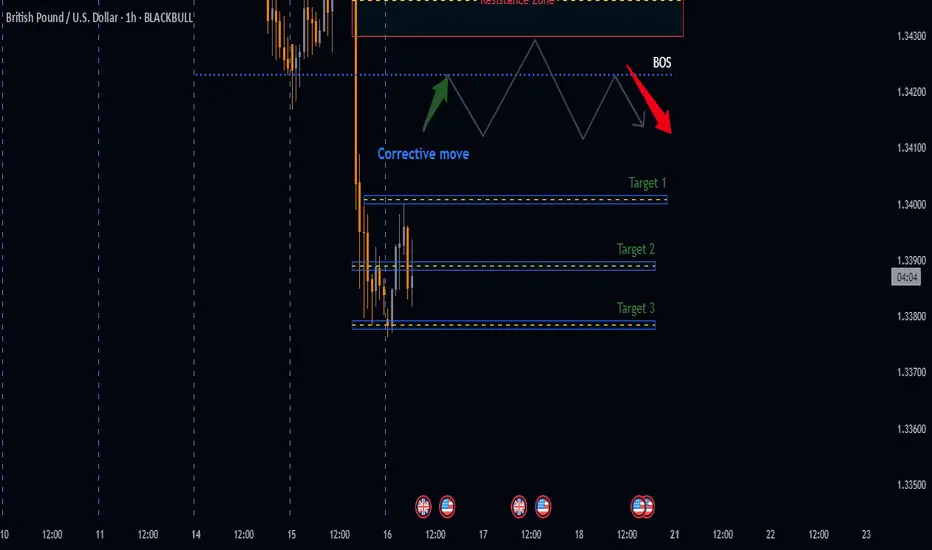
Potential Bearish Setup for GBPUSDBearish Breakdown Setup
**Summary
Analysing Price action from yesterday we have got a very nice distribution leg push that broke down below our accumulation zone a good indication of downside momentum, therefore the anticipation is that price will retest our BOS an ideal zone to look for bearish setups.
📉 GBPUSD Daily Breakdown Potential setup
🔴 Distribution leg: 1.34588 - 1.33785
📉 Sell level: 1.34230 (Confirmed Break)
🎯 Target 1: R:R 1:2
🎯 Target 2: R:R 1:3
🎯 Target 3: R:R 1:4
🛑 Stop Loss: Above Resistance Zone
🔍 Watch: Failure to break back in = Confirmation
LIKE or COMMENT if this idea sparks your interest, or share your thoughts below!
FOLLOW to keep up with fresh ideas.
Tidypips: "Keep It Clean, Trade Mean!"
Potential Bearish Setup on EURUSDBearish Breakdown Setup
Summary
Analysing Price action from yesterday we have got a very nice distribution leg push that broke down below our accumulation zone a good indication of downside momentum, therefore the anticipation is that price will retest our BOS an ideal zone to look for bearish setups.
📉 EURUSD Daily Breakdown Potential setup
🔴 Distribution leg: 1.16921 - 1.15924
📉 Sell Below: 1.16540 (Confirmed Break)
🎯 Target 1: R:R 1:2
🎯 Target 2: R:R 1:3
🎯 Target 3: R:R 1:4
🛑 Stop Loss: Above Resistance Zone
🔍 Watch: Failure to break back in = Confirmation
LIKE or COMMENT if this idea sparks your interest, or share your thoughts below!
FOLLOW to keep up with fresh ideas.
Tidypips: "Keep It Clean, Trade Mean!"

PB Fintech (NSE: 543390) Trade Setup📈 Breakout Watch | Price retesting key pivot at ₹1,745
Momentum building with RSI > 60 and bullish structure. Ideal for intraday or short swing.
🔵 Long Entry
Buy Above: ₹1,745 (Pivot breakout confirmation on 15m/1H candle close)
Target 1: ₹1,775 (minor resistance)
Target 2: ₹1,807 (next pivot)
Target 3: ₹1,869 (final swing target)
Stoploss: ₹1,720 (below previous candle low/support zone)
✅ Volume confirmation and RSI strength supporting move
🧠 Good for breakout traders looking for momentum continuation
🔴 Short Setup (if rejection from ₹1,745)
Sell Below: ₹1,730 (on rejection + bearish candle)
Target: ₹1,682
Stoploss: ₹1,745
📊 Indicators:
RSI: 65.7 → bullish, near breakout threshold
BB% B: 0.88 → strong bullish move near upper band

COFORGE 8100 CE – 29 MAY EXPIntraday to Short-Term Trade Setup (15min/1H)
🟢 Bullish Breakout | Volume Surge Confirmed
🛒 Entry Zone (Buy Above): ₹258–260
🔑 Confirmation on 15min candle close above ₹260 with volume
🎯 Targets:
T1: ₹276
T2: ₹306.50
T3: ₹353.90 (if momentum continues into next session)
🛑 Stop Loss:
SL: ₹230 (on candle close basis for 15min TF)
Conservative SL: ₹240 (if tighter risk appetite)
📊 Indicators Signal:
✅ 9 EMA crossed 26 EMA (momentum confirmation)
✅ RSI at 76.79 – strong, but watch for pullback
✅ BB %B at 0.89 – breakout zone
✅ Clean breakout above resistance (~₹230) with volume spike
✅ Pivot & resistance flip visible on both 15min & 1H TF
For Education Purposes Only

Equity Research Report – TVS Motor Company Ltd.📌 Timeframes Analyzed: 15-Minute and 1-Hour
📅 Date: May 5, 2025
📍 CMP: ₹2,774.40
📈 Setup: Bullish breakout from falling channel with EMA crossover
🔹 Technical Highlights
Pattern: Descending channel breakout (1H)
Moving Averages: Price is trading above the 20-EMA and 50-EMA with bullish crossover
Volume: Breakout confirmed by increasing volume
RSI (Momentum): RSI is trending up above 50 with positive divergence
🟢 Trade Plan – Intraday to Short-Term Swing
✅ Buy Levels (Confirmation Entry)
Buy Above: ₹2,780 (breakout confirmation level)
🎯 Targets
Timeframe Target 1 Target 2 Target 3
15-min ₹2,810 ₹2,835 ₹2,860
1-hour ₹2,850 ₹2,880 ₹2,920
🔻 Stop Loss
Intraday SL: ₹2,745 (below channel support and 50-EMA)
Swing SL: ₹2,720

BTCUSD 120 MINS TIME FRAMEThe Structure looks good to us, waiting for this instrument to correct and then give us these opportunities as shown on this instrument (Price Chart).
Note: Its my view only and its for educational purpose only. Only who has got knowledge about this strategy, will understand what to be done on this setup. its purely based on my technical analysis only (strategies). we don't focus on the short term moves, we look for only for Bullish or Bearish Impulsive moves on the setups after a good price action is formed as per the strategy. we never get into corrective moves. because it will test our patience and also it will be a bullish or a bearish trap. and try trade the big moves.
we do not get into bullish or bearish traps. We anticipate and get into only big bullish or bearish moves (Impulsive Moves). Just ride the Bullish or Bearish Impulsive Move. Learn & Know the Complete Market Cycle.
Buy Low and Sell High Concept. Buy at Cheaper Price and Sell at Expensive Price.
Keep it simple, keep it Unique.
please keep your comments useful & respectful.
Thanks for your support.....
Tradelikemee Academy
Sanjay K G

Nifty50 Intraday Levels TradePlan Analysis Aug 08Black Line zones - Resistances
R1 - 19617-19639
R2 - 19723-19795
R3 - 19805-19822
R4 - 19842-19876
Green line zones - Demand
S1 - 19593-19574
S2 - 19555-19510
S3 - 19595-19462
S4 - 19350-19295
Analysis:-
Nifty is in a process of forming a retracement , Lower High for the Downtrend formed. But if it moves strong above 19684-19733 which is the 78.6% to 88.6% retracement levels of the previous major swing, which also coincides with the Gap supply zone and out of the falling channel that has formed, then there are high probabilities that the market trend would change to uptrend.
Trade Plan:-
If the Market opens flat,
1) Would look for any rejection at the Trendline and initiate shorts till the demand levels such as today's day low, Friday's day low based on price action and setup confirmation.
2) Can also look for reversal trades at the demand zones marked post consolidation beyond 10:15 AM.
3) One can initiate longs if the trendline breakout happens post-consolidation beyond 60-75 minutes of market opening.
If the Market opens gap up,
1) Will look to short the market at the mentioned supply zones and run till the gap filling happens or till the Trendline support or the marked demand zones based on Technical setup confirmations.
2) One can initiate longs if the trendline breakout happens post-consolidation beyond 60-75 minutes of market opening.
3) Can go long once the gap filling is complete based on Technical setups.
If the Market opens gap down,
1) Will go short if today's or Friday's low is broken.
2) Will go long if gap is at demand levels marked with CONSOLIDATION and setup confirmation. Would look to run till Trendline/Gap resistances.
Happy trading! Please do comment for suggestions.
Please do check for Demand zones below 19200.

Bank Nifty Trade Setup (12-June-2023)This will be my personal trade Setup, This is not an advice of any kind to initiate trade according to this setup. This is for only for my learning purpose and maintaining my trading journal.
Bank Nifty selling of and forming shooting star candles... what should we expect ? Is it trend reversal ? or is it profit booking buy previously holding stocks ?
Day traders shouldn't worry about long term...
So for tomorrow this will be my trade setup:
1.) If opens flat which is near trendline or above it and horizontal reistance (44060) and takes support there i will buy for target of 44250.
2.) If opening flat and broke both trendline and resistance of 44060 keep acting as resistance i will short for target of 1st support 43850, then 2nd support 43730.
3.) Big gap up or down will stay away from market unless there is good setup.

Crypto - Trade SetupMost ALTs haven't tested the main resistance level yet and even though they rejected beneath the resistance still there is a smell of bulls in the price action. Yes not so much interest yet but i'm expecting something more likely upward towards the resistance zone soon. But like i say market emotions change with the time so we must not stay rigid, we need to move along with the market.
Here are the key areas for my trade setup on ENJI against USDT, I'm saying again once the price reaches my zones I'll observe the market emotion clearly then only i get into the trade otherwise I'll look for another trade setup. This is what disciplined traders do so what are you doing ??
My calling : 0.5922
Note : I'll update once the trade setup got triggered!
Disclaimer : I'm not a financial advisor, trade at your own risk.

Nifty spot Intraday levels Here are some levels marked on Nifty spot chart for intraday importance
Wave Structure could be like this.
Disclaimer
I am not sebi registered analyst
My studies are Educational purpose only
Please consult your Financial advisor before trading or investing

Nifty Setup for 11th March 2022Bullish Flag formed.
However, major resistance near 16750 zone.
Good Breakout is possible if market sustain over 16500, otherwise expect sideways to bearish movement.

Double top Trading exampleHow to trade double top
how to fix sl
how to fix tgt
for more confirmation use indicators ie adx macd rsi ema

Nifty Setup 8th March 2022Double Bottom Formation
Wait for breakout, target would be around 16150-16200 Zone.
In case of Breakdown, expect sideways movement with support near 15450-15500 Zone.

GBPJPY Inverse Head and Shoulder FAILEDThe price failed to break the resistance and now the price is in the middle of support and resistance area.
wait and see if the price rebound from support area (151.899) take a long entry until the next resistance, but if the price break the resistance, it is very possible that the price forms a falling wedge pattern. FX:GBPJPY

Double Bottom on AUDUSDFX:AUDUSD
double bottom on AUDUSD, price back to the retest area and form a bullish engulfing candle.

GBPAUD intraday 15 min set upas you can se, the price make double top pattern
entry :1.8801
stop level : 1.88685
take profit : 1.87207

ONGC: Another Oil sector stockWith an SL of 95 start accumulating it. It will consolidate on 120 before or after breakout.
Another Oil sector stock - you can choose between ONGC and IOC, have posted charts of both.
(IMP- Reliance can also give a good rally which will lead all the oil sector to perform well)
If you have any query feel free to ask in Comments or mssg me.
